. 2021 May 20;12(1):2981.
doi: 10.1038/s41467-021-23270-1.

The impact of chromosomal fusions on 3D genome folding and recombination in the germ line

Affiliations

The impact of chromosomal fusions on 3D genome folding and recombination in the germ line

Covadonga Vara et al. Nat Commun. .

Abstract

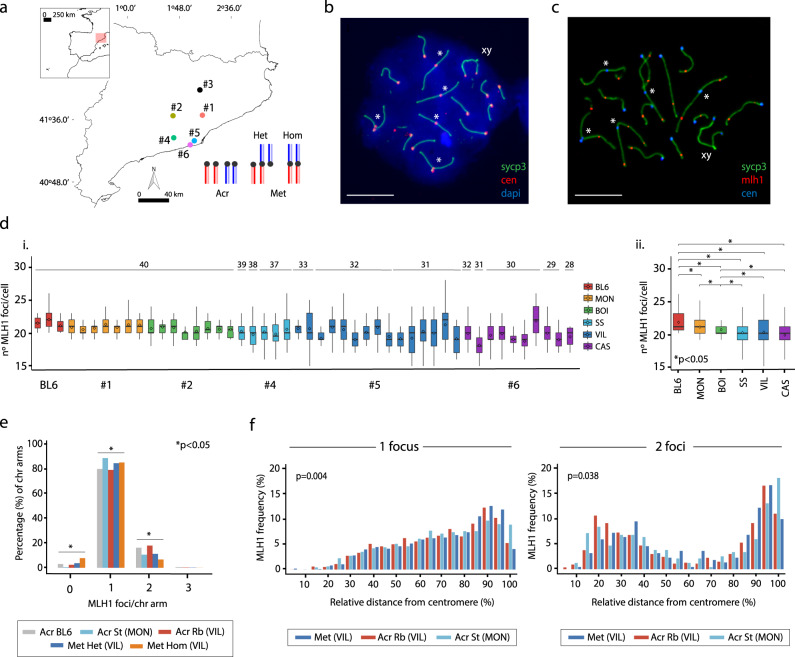
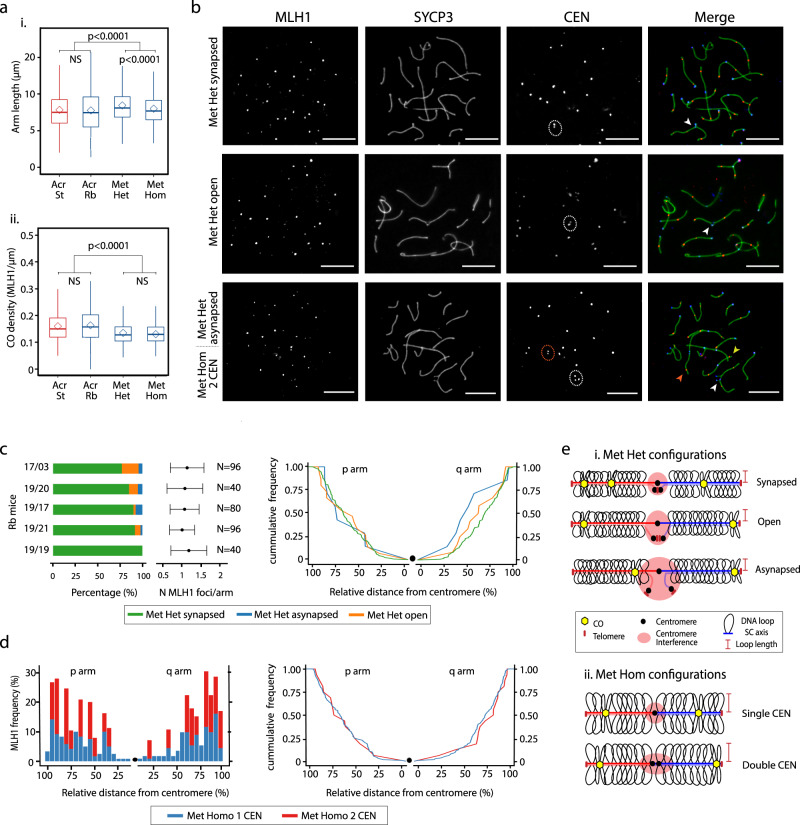
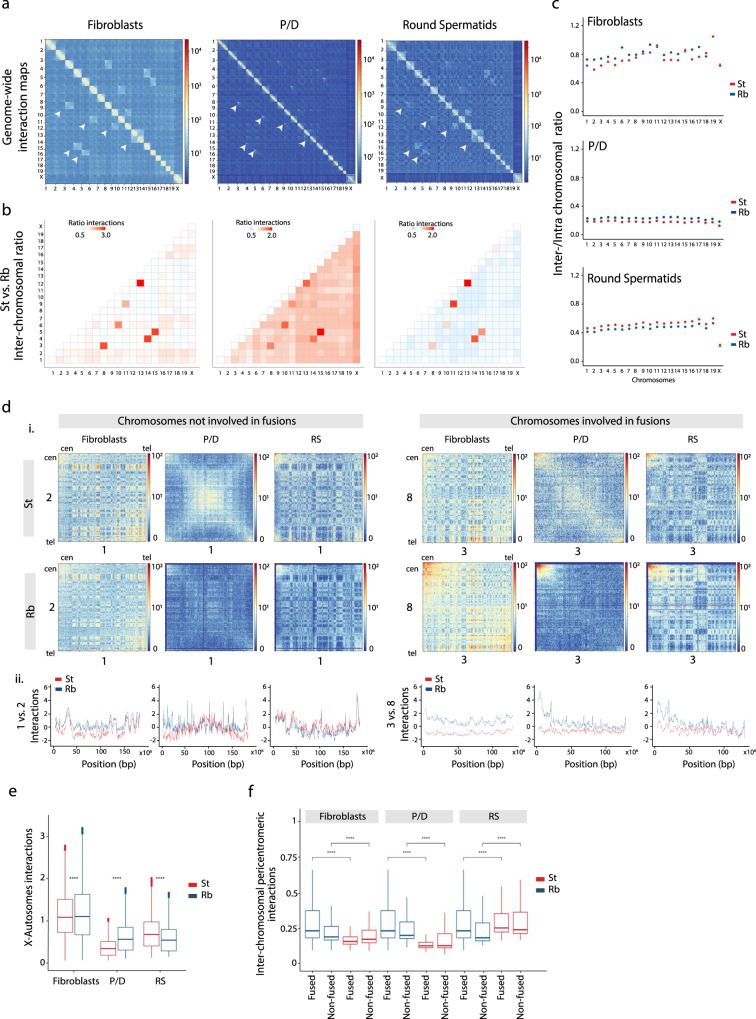
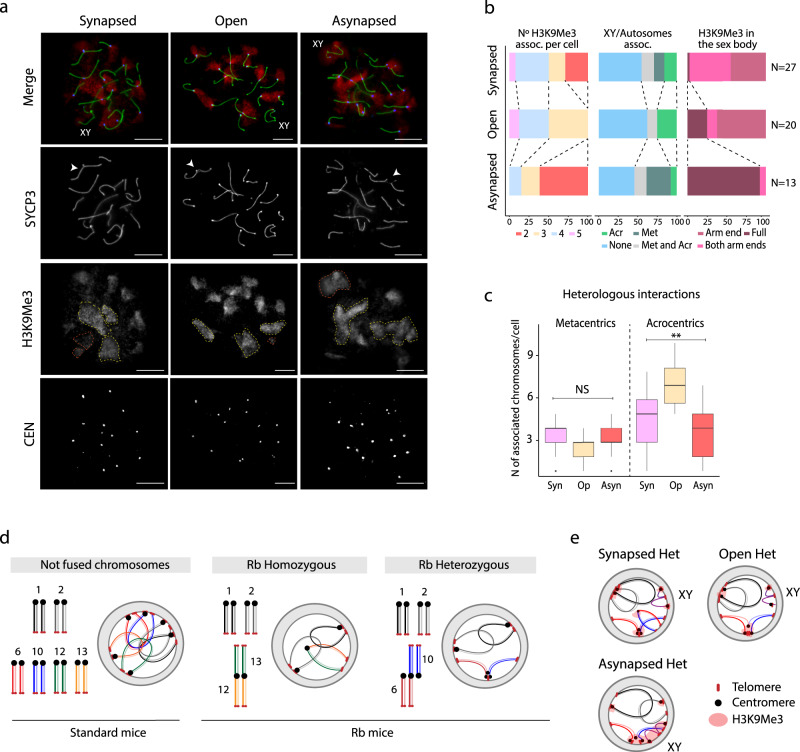
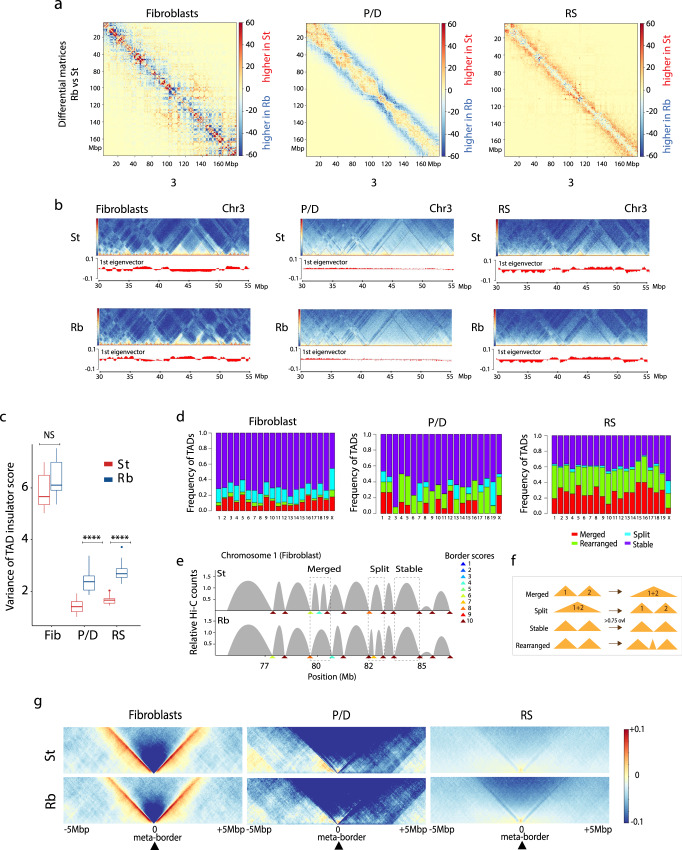
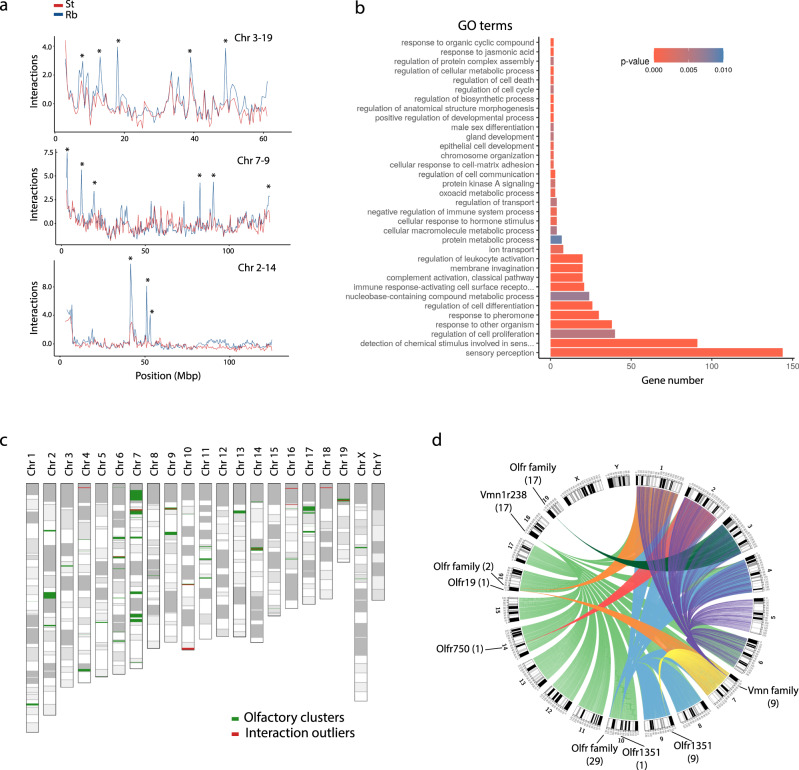
The spatial folding of chromosomes inside the nucleus has regulatory effects on gene expression, yet the impact of genome reshuffling on this organization remains unclear. Here, we take advantage of chromosome conformation capture in combination with single-nucleotide polymorphism (SNP) genotyping and analysis of crossover events to study how the higher-order chromatin organization and recombination landscapes are affected by chromosomal fusions in the mammalian germ line. We demonstrate that chromosomal fusions alter the nuclear architecture during meiosis, including an increased rate of heterologous interactions in primary spermatocytes, and alterations in both chromosome synapsis and axis length. These disturbances in topology were associated with changes in genomic landscapes of recombination, resulting in detectable genomic footprints. Overall, we show that chromosomal fusions impact the dynamic genome topology of germ cells in two ways: (i) altering chromosomal nuclear occupancy and synapsis, and (ii) reshaping landscapes of recombination.


Conflict of interest statement

The authors declare no competing interests.

Figures

Fig. 1
Fig. 1. Genomic landscapes of recombination.
a BRbS populations sampled. See Supplementary Table 1 for the population’s number assignment. The diagram represents different types of chromosomal fusions. Chromosome type legend: Acr, all-acrocentric chromosomes of standard mice; Met Het, Rb chromosomes in heterozygous state of Rb mice; Met Hom, Rb chromosomes in homozygous state of Rb mice. b Immunofluorescence of a spermatocyte at pachytene stage from a Rb mouse (2n = 32): SYCP3 (green), centromeres (red), and DNA (DAPI, blue). Asterisks indicate Rb chromosomal fusions. Sex chromosomes (XY) are indicated. Scale bar = 10 µm. Immunofluorescence replicates, n = 3. c Immunofluorescence of a spermatocyte at pachytene stage: SYCP3 (green), MLH1 (red), and centromeres (blue). Asterisks indicate Rb chromosomal fusions. Sex chromosomes (XY) are indicated. Scale bar = 10 µm. Immunofluorescence replicates, n = 3. d Boxplots depicting the number of MLH1 foci/cell per specimen represented (i) individually (colors correspond to panel a) and (ii) per population. Boxplots are presented as mean values ± SD; center line, median; center diamond, mean. (i) Three laboratory mice (BL6) are included for comparison. Boxplots indicating mean values and standard deviations are shown for each individual. BRbS populations: CAS Castelldefels, BOI Castellfollit del Boix, MON Caldes de Montbuí, SS Sant Sadurní d’Anoia, VIL Viladecans. The diploid number of each mouse specimen is indicated on top of each boxplot. Source data are provided as a Source Data file. (ii) Mean numbers of MLH1 foci/cell in laboratory mice (BL6) and wild-caught standard (St) and Rb mice represented per population. P values (Wilcoxon’s rank-sum test followed by Dunn’s tests (two-sided) adjusted by Bonferroni, *P < 0.05) represent differences between populations (BL6, laboratory mice (n = 55 cells); CAS (n = 296 cells), BOI (n = 174 cells), MON (n = 174 cells), SS (n = 206 cells), VIL (n = 605 cells)). Source data are provided as a Source Data file. e Percentage of chromosomal arms showing the different number (0, 1, 2, or 3) of MLH1 foci per-chromosome (χ2 test, one-sided, *P < 0.05). The number of chromosome arms analyzed per arm type: n = 1046 for Acr BL6; n = 1140 for Acr St (MON); n = 2233 for Acr Rb (VIL); n = 483 for Met Het (VIL); n = 1517 for Met Hom. Source data are provided as a Source Data file. f Distribution of MLH1 foci along individual chromosomal arms with one (left panel) or two (right panel) MLH1 foci from panel e. The X axis represents the relative positions on the chromosomal axes from the centromere (0%) to the distal telomere (100%) (χ2 test, one-sided, P < 0.05). The Y axis indicates the frequency of MLH1 foci in each interval of chromosome arm length. Chromosome type legend: Acr St, all-acrocentric chromosomes of standard mice from MON population (n = 1014 chromosomal arms with 1 CO; n = 120 chromosomal arms with 2 COs); Acr Rb, acrocentric chromosomes of Rb mice from VIL population (n = 1232 chromosomal arms with 1 CO; n = 271 chromosomal arms with 2 COs); Met, arms of metacentric chromosomes of Rb mice from VIL population (n = 1272 chromosomal arms with 1 CO; n = 112 chromosomal arms with 2 COs). Source data are provided as a Source Data file.
Fig. 2
Fig. 2. Effect of Rb fusions on recombination and synaptonemal complex length.
a (i) Axis length (expressed as μm) analysis in standard (St) and Robertsonian (Rb) mice from BRbS (see text and Supplementary Table 1 for further details) according to chromosome types (Dunn’s test, two-sided; P < 0.001; NS nonsignificant). Boxplots are presented as mean values ± SD; center line, median; center diamond, mean. Source data are provided as a Source Data file. (ii) Analysis of CO density in the different chromosome types (Mann–Whitney test, two-sided; P < 0.0001). Boxplots are presented as mean values ± SD; center line, median; center diamond, mean. Source data are provided as a Source Data file. Chromosome type legend for panels (i) and (ii): Acr, all-acrocentric chromosomes of standard mice (n = 1140 chromosomal arms); Acr, Rb all-acrocentric chromosomes of Rb mice (n = 1711 chromosomal arms) Met Het, Rb chromosomes in heterozygous state of Rb mice (n = 396 chromosomal arms); Met Hom, Rb chromosomes in homozygous state of Rb mice (n = 1294 chromosomal arms). b Immunofluorescence of primary spermatocytes of Rb mice at the pachynema stage, labeling the synaptonemal complex with SYCP3 (green), the centromeres with CEN (blue), and MLH1 (red). Immunofluorescence replicates, n = 3. White dashed circles: centromeric signals in heterozygous fusions. Red dashed: double-centromere signals in homozygous fusions. White arrowheads: Met Het chromosomes. Red arrowhead: Met Hom with double-centromeric signals. Yellow arrowhead: Met Hom with a single centromeric signal. Scale bar = 10 µm. c Synapsis and recombination patterns found in mice with Rb fusions a heterozygous state (see Supplementary Table 1 for mouse codes). Left panel: Percentage of heterozygous chromosomes according to synapsis pattern (synapsed, asynapsed, and open) for each of the Rb mice analyzed. Numbers on the left refer to mouse ID (see Supplementary Table 1). Middle panel: Representation of the mean number of MLH1 per arm corresponding to the mice analyzed. N = number of cells analyzed per individual. Right panel: Cumulative frequencies of MLH1 distributions in heterozygous metacentrics according to synapsis pattern (synapsed, asynapsed, and open). Source data are provided as a Source Data file. d Double-centromeric signals and recombination. Left panel: Distribution of MLH1 foci along individual chromosomal arms in homozygous metacentrics (Met Hom) with a single (1 CEN, blue) or double (2 CEN, red) centromeric signal. The X axis represents the positions on the chromosomal axes from the centromeric end (black dot) to the distal telomere. The Y axis indicates the frequency of MLH1 foci for each 10% interval of chromosomal length. Right panel: Cumulative frequencies of MLH1 distributions in homozygous metacentrics with a single- or a double-centromeric signal. Source data are provided as a Source Data file. e Diagram depicting chromosomal axis (SC) length, DNA loops, and crossovers (COs) observed in fused chromosomes at pachytene in Rb mice. Heterozygous metacentrics (Met Het) chromosomes can occur in three states: synapsed, open, and asynapsed. COs are closer to the centromere in asynapsed chromosomes. Open chromosomes have distal COs, whereas synapsed chromosomes can have more than two COs per arm and in interstitial-to-distal positions. Regardless of the synapsis state, heterozygous metacentrics (Met Het) chromosomes have longer axes than homozygous metacentrics (Met Hom) chromosomes. Conversely, DNA loop lengths in Met Het chromosomes are shorter than in Met Hom chromosomes.
Fig. 3
Fig. 3. Effect of Rb fusions on the higher-order chromatin structure.
a Genome-wide ICE-corrected heatmaps (500 kbp) for the cell types analyzed (fibroblasts, pachynema/diplonema—P/D, and round spermatids—RS) in Rb mice. Chromosomes involved in Rb fusions emerge as regions with high interchromosomal interaction in all cell types (arrowheads). Rb fusions are the following: 3.8, 4.14, 5.15, 6.10, 9.11, and 12.13. b Heatmaps depicting genome-wide interchromosomal interaction ratio between standard (St) and Rb mice. Chromosomes in red indicate higher interactions in Rb than in standard mice, whereas chromosomes in blue indicate higher interactions in standard than in Rb mice. As expected, all chromosomes involved in fusions show high interaction ratios in all the three cell types analyzed. Source data are provided as a Source Data file. c Inter-/intrachromosome interaction ratio for the cell types analyzed (fibroblasts, P/D, and RS) in St and Rb mice. In fibroblasts (upper panel), values are the same for chromosome 19 in both St and Rb mice. Source data are provided as a Source Data file. d Examples of interaction patterns between chromosomes involved and not involved in fusions. (i) Interaction heatmaps representing chromosomes 1 and 2 (not involved in fusions) and chromosomes 3 and 8 (fused in a heterozygous state) in both St and Rb mice. In chromosomes 3 and 8, the fusion becomes evident in interaction maps from Rb mice, with high interaction in the pericentromeric region of the chromosomes (0–3 Mbp from the centromere). The observed scaling is consistent across all chromosomes. Source data are provided as a Source Data file. (ii) Interaction plots for fibroblasts, P/D, and RS for chromosomes not involved (1 and 2) and involved in fusions (3 and 8). The observed scaling is consistent across all chromosomes. Source data are provided as a Source Data file. e Boxplot showing the number of genome-wide interactions between the X chromosome and autosomes detected in St and Rb mice per each cell type (Mann–Whitney test, ****P < 0.0001, two-sided). Boxplots are presented as mean values (center line) ± SD. Source data are provided as a Source Data file. f Boxplots depicting genome-wide interchromosomal interactions per million at pericentromeric regions (from the centromere up to 3.5 Mbp) between St and Rb mice (Mann–Whitney test, ****P < 0.0001, two-sided). Boxplots are presented as mean values (center line) ± SD. For each cell type, two groups of chromosomes were compared: chromosomes involved in Rb fusions (3.8, 4.14, 5.15, 6.10, 9.11, and 12.13) and chromosomes not fused (1, 2, 7, 16, 17, 18, 19, and X). Source data are provided as a Source Data file.
Fig. 4
Fig. 4. Interchromosomal associations.
a Examples of immunofluorescence on primary spermatocytes at pachytene stage, labeling the synaptonemal complex with SYCP3 (green), the centromeres (CEN, blue), and H3K9Me3 (red). Immunofluorescence replicates, n = 3. SYCP3 staining allowed for the detection of the different heterozygous Rb fusion according to synapsis pattern: synapsed, open, and asynapsed (white arrows). H3K9Me3 shows associations between different chromosomes (yellow dashed lines) and differential distribution in the XY sex body (orange dashed lines): in both arms (as shown in the synapsed example), in one arm end (as shown in the open example), or fully around the sex body (as shown in the asynapsed example). The sex body is indicated as XY. Scale bar = 10 µm. b Analysis of H3K9Me3 associations according to synapsis states (synapsed, open, and asynapsed) of heterozygous metacentrics (left panel), sex chromosome/autosome associations (central panel), and the sex body on its own (right panel). Acr acrocentric chromosomes, Met metacentric chromosomes, assoc. association. N = number of cells analyzed. Source data are provided as a Source Data file. c Number of associated chromosomes (metacentrics (n = 60)) or acrocentrics (n = 60)) detected per cell depending on the synapsis state of heterozygous metacentrics (Kruskal–Wallis, **P ≤ 0.005, one-sided). Boxplots are presented as mean values (center line) ± SD. syn synapsed, op open, asyn asynapsed, ns nonsignificant. Source data are provided as a Source Data file. d Schematic representation of chromosome organization in P/D according to the presence of Rb fusions. In standard mice, all chromosomes are acrocentric and are attached to the nuclear lamina. When Rb fusions are present, chromosome organization is disrupted, affecting chromosome disposition inside the nucleus, either in a homozygous or a heterozygous state. e Schematic representation of the centromeric associations detected with the H3K9Me3 signal in addition to the XY disposition according to synapsis pattern of heterozygous Rb fusions (i.e., synapsed, asynapsed, or open). het heterozygous metacentric.
Fig. 5
Fig. 5. Variance in fine-scale compartmentalization.
a Differential Hi-C matrices (log2 of fold change using Rb mice as a reference when compared with standards) for chromosome 3 in cell types analyzed (fibroblasts, pachynema/diplonema—P/D, and round spermatids—RS), at a 500-kbp resolution. The observed scaling is consistent across all chromosomes. Red indicates higher number of interactions in standard (St) mice when compared to Rb mice, whereas blue represents higher number of interactions in Rb mice. b Chromosome (Chr) 3 region-specific ICE-corrected heatmaps at 50 kbp (from 30 to 55 Mbp), depicting compartment signal (1st eigenvector) for all cell types. Source data are provided as a Source Data file. c Variance of TAD insulator score between St and Rb mice in all cell types (Mann–Whitney test, ****P < = 0.0001, ns P > 0.05, two-sided). Boxplots are presented as mean values (center line) ± SD. ns nonsignificant. d Frequency of TAD reorganizations between standard and Rb for fibroblasts, P/D, and RS. Source data are provided as a Source Data file. e Example of TAD border alignments along chromosome 1 of fibroblasts (from 75 to 86 Mbp). Examples of merged, split, and stable TADs are indicated. TAD border scores are also shown, informing of the TAD boundary strength. Source data are provided as a Source Data file. f Schematic representation of TAD reorganization. Merged TADs are the result of fusing two different TADs. Split TADs are those in which one TAD is divided into two TADs. TADs are considered stable when there is an overlap above 75%. When TADs are found in a different organizations, they are considered rearranged. g Metaplots for all TAD boundaries detected in Rb mice: fibroblasts (n = 2378), P/D (n = 288), and RS (n = 3798). Data on standard mice were extracted from Vara and colleagues.
Fig. 6
Fig. 6. Interchromosomal interaction and olfactory receptors.
a Interaction profiles of pairs of chromosomes (3 and 19, 7 and 9, and 2 and 14) in primary spermatocytes (pachynema/diplonema, P/D) of Rb mice. In all three examples, interchromosomal interactions are depicted by asterisks. St standard mice, Rb Rb mice, chr chromosome. Source data are provided as a Source Data file. b Gene Ontology Enrichment Analysis (GOEA) of genes in newly detected interchromosomal interactions in pachynema/diplonema of Rb mice. Only significant gene ontology (GO) terms with an adjusted P value below 0.01 are shown. The X axis represents the number of genes associated to each GO term. Source data are provided as a Source Data file. c Mouse ideogram showing the localization of olfactory clusters (green) described in literature, and the interchromosomal interactions detected in this work (red). d Circus plot representing the interchromosomal interactions in the mouse genome related with sensory perception, which are mostly genes from the olfactory (Olfr) and vomeronasal (Vmn) receptor family. The number of genes found in each region and the gene family are shown in parenthesis. Source data are provided as a Source Data file.

Similar articles

Cited by

References

    1. Dixon JR, et al. Topological domains in mammalian genomes identified by analysis of chromatin interactions. Nature. 2012;485:376–380. doi: 10.1038/nature11082. - DOI - PMC - PubMed
    1. Lieberman-Aiden E, et al. Comprehensive mapping of long-range interactions reveals folding principles of the human genome. Science. 2009;326:289–293. doi: 10.1126/science.1181369. - DOI - PMC - PubMed
    1. Rao SSP, et al. A 3D map of the human genome at kilobase resolution reveals principles of chromatin looping. Cell. 2014;159:1665–1680. doi: 10.1016/j.cell.2014.11.021. - DOI - PMC - PubMed
    1. Kraft K, et al. Serial genomic inversions induce tissue-specific architectural stripes, gene misexpression and congenital malformations. Nat. Cell Biol. 2019;21:305–310. doi: 10.1038/s41556-019-0273-x. - DOI - PubMed
    1. Deakin JE, et al. Chromosomics: Bridging the gap between genomes and chromosomes. Genes. 2019;10:627. doi: 10.3390/genes10080627. - DOI - PMC - PubMed

Publication types

MeSH terms