. 2021 May 20;12(1):2991.
doi: 10.1038/s41467-021-23234-5.

Multiscale influenza forecasting

Affiliations

Multiscale influenza forecasting

Dave Osthus et al. Nat Commun. .

Abstract

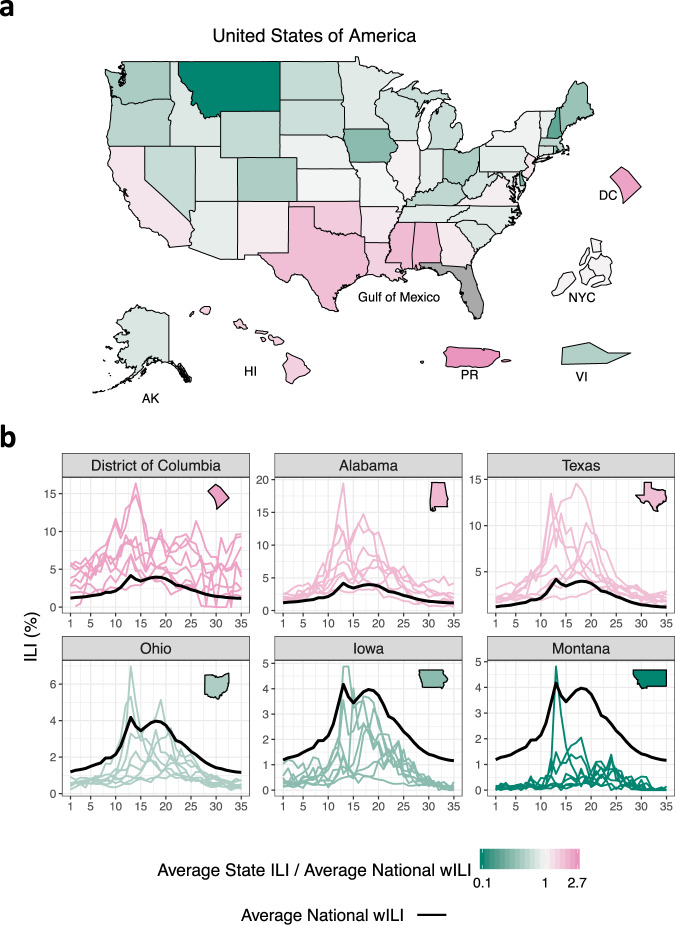
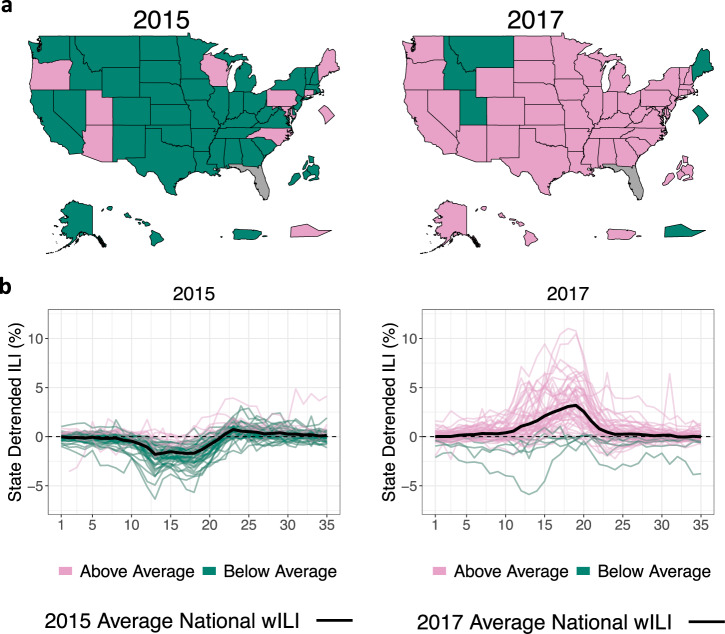
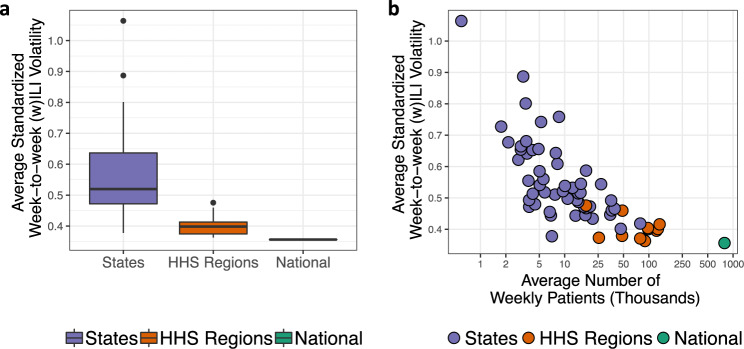
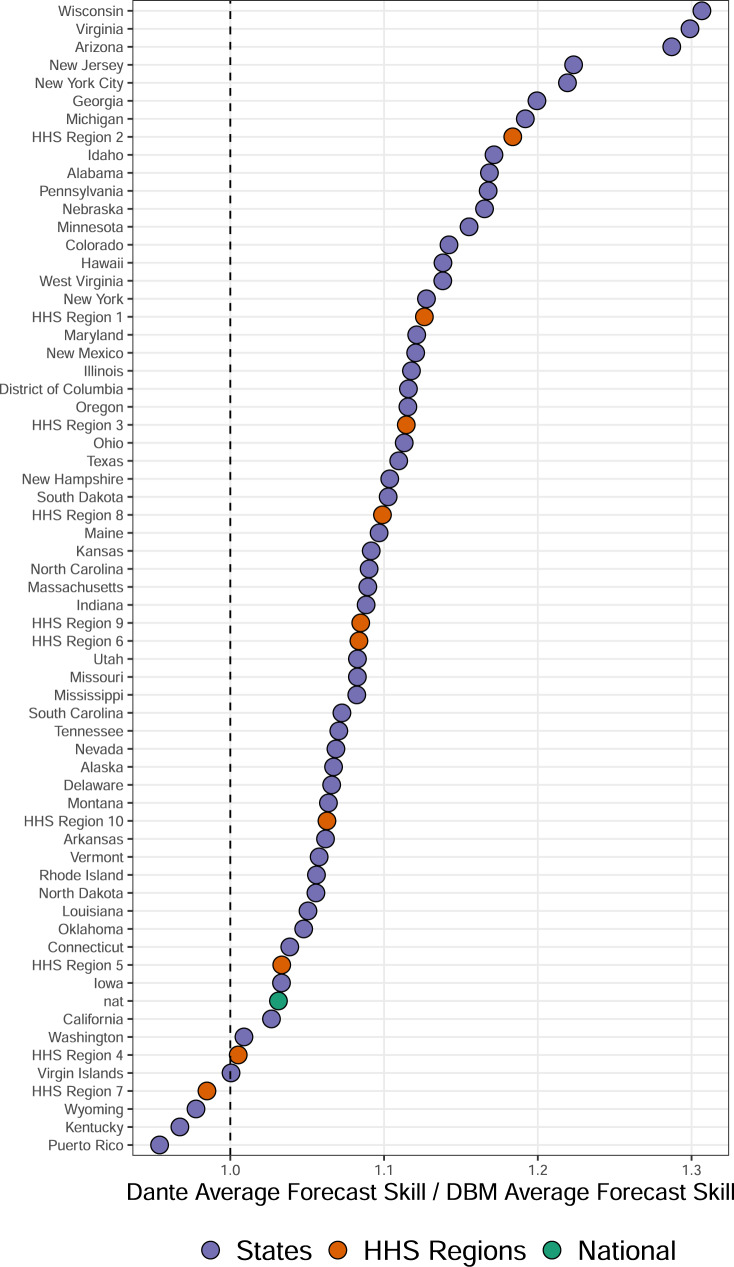
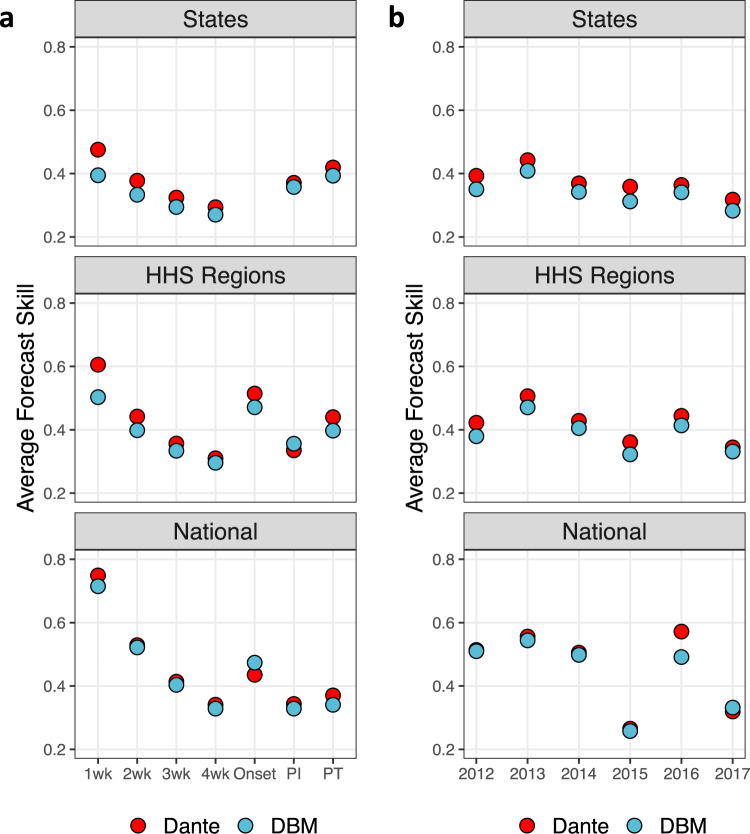
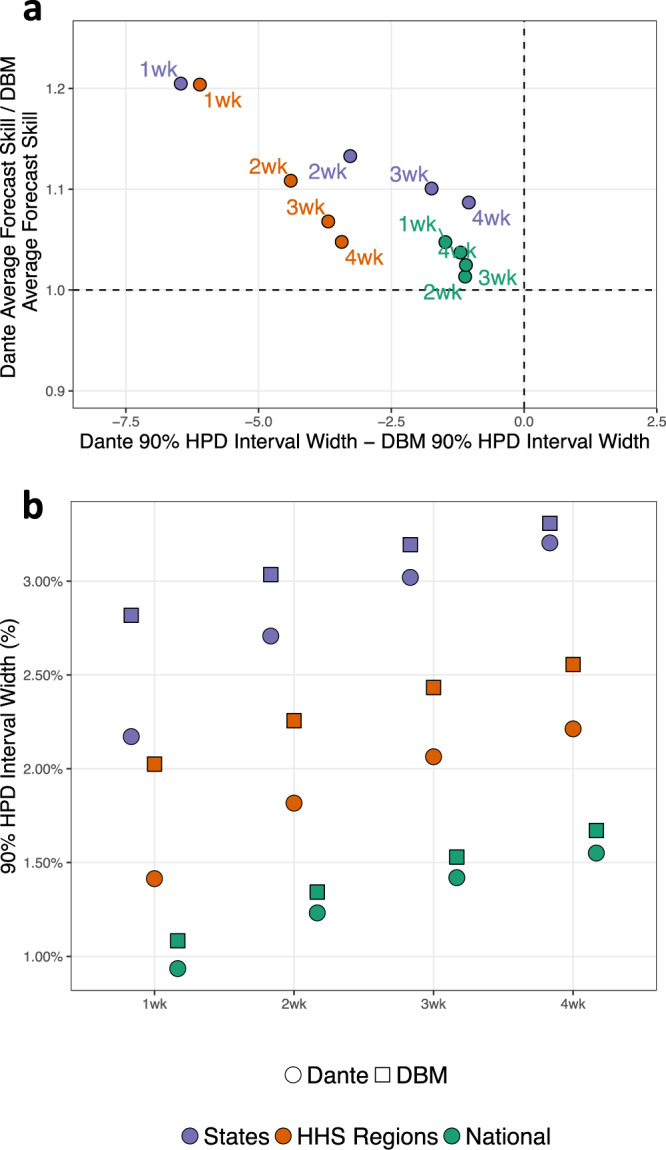
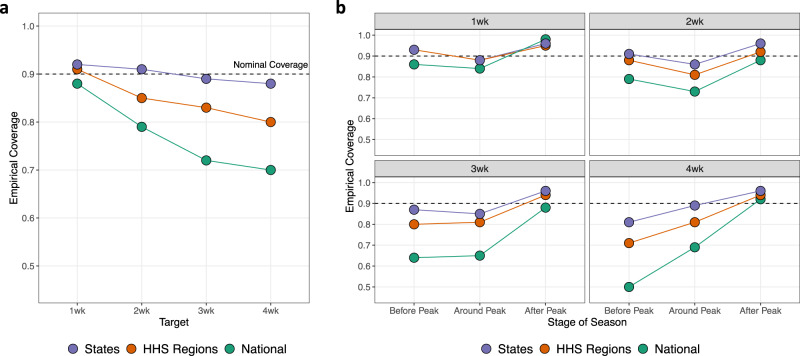
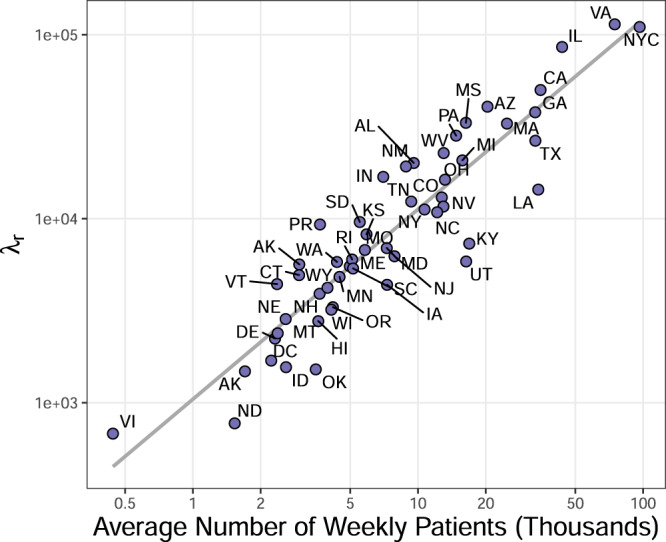
Influenza forecasting in the United States (US) is complex and challenging due to spatial and temporal variability, nested geographic scales of interest, and heterogeneous surveillance participation. Here we present Dante, a multiscale influenza forecasting model that learns rather than prescribes spatial, temporal, and surveillance data structure and generates coherent forecasts across state, regional, and national scales. We retrospectively compare Dante's short-term and seasonal forecasts for previous flu seasons to the Dynamic Bayesian Model (DBM), a leading competitor. Dante outperformed DBM for nearly all spatial units, flu seasons, geographic scales, and forecasting targets. Dante's sharper and more accurate forecasts also suggest greater public health utility. Dante placed 1st in the Centers for Disease Control and Prevention's prospective 2018/19 FluSight challenge in both the national and regional competition and the state competition. The methodology underpinning Dante can be used in other seasonal disease forecasting contexts having nested geographic scales of interest.


Conflict of interest statement

The authors declare no competing interests.

Figures

Fig. 1
Fig. 1. State-to-state influenza-like illness variability.
a Average state influenza-like illness (ILI) relative to average national weighted ILI (wILI). States bordering the Gulf of Mexico tend to have higher ILI than the national average. The geographical sizes of Alaska (AK), Hawaii (HI), Puerto Rico (PR), the US Virgin Islands (VI), New York City (NYC), and the District of Columbia (DC) are not to scale. Data for Florida is unavailable. Averages are based on 2010 through 2017 data. b ILI by season (colored lines) for select states. Black line is national average wILI for reference. Appreciable season-to-season and state-to-state ILI variability exists.
Fig. 2
Fig. 2. Seasonal influenza-like illness variability.
a Dark green states denote states with ILI less than their state-specific averages while pink states are states with ILI above their state-specific averages. 2015 was a mild flu season for the majority of states relative to their state-specific average ILI, while 2017 was an intense flu season for the majority of states, indicating that season-to-season effects can affect most of the country. Data unavailable for Florida. States displayed outside of the contiguous US are geographically not to scale. b State detrended ILI for the 2015 and 2017 flu seasons, where state detrended ILI is ILI for a state/season minus ILI for that state averaged over all seasons. Positive/negative state detrended ILI means ILI for that season was above/below the state-specific average, respectively. Black line is season-specific national average wILI for reference.
Fig. 3
Fig. 3. Standardized volatility by geographic scale.
a Average standardized week-to-week influenza-like illness (ILI—states) and weighted ILI (wILI—HHS regions and nationally) volatility for three geographic scales. Volatility decreases as the scales coarsen. Boxplots present median (center line), interquartile range (boxes), 1.5 times the interquartile range (whiskers), and outliers (points) based on n = 53, 10, and 1 observations for states, HHS regions, and the nation respectively. b Average standardized week-to-week (w)ILI volatility versus the average number of weekly patients on a log scale for each state, HHS region, and nationally. Volatility decreases as the number of weekly patients seen increases, suggesting that volatility is in part a product of ILINet participation.
Fig. 4
Fig. 4. Dante’s forecast skill relative to DBM’s by geographic region.
Ratio of forecast skill of Dante to that of DBM, for all states, regions, and nationally. Dante had higher forecast skill for all geographic regions except for HHS Region 7, Kentucky, Wyoming, and Puerto Rico.
Fig. 5
Fig. 5. Dante’s and DBM’s forecast skill by target and season.
a Average forecast skill by scales and targets. PI and PT stand for peak intensity and peak timing, respectively. Dante outperformed DBM for all scales and targets, except for onset nationally and for PI regionally. b Average forecast skill by scales and flu seasons. Dante outperformed DBM for all scales and targets, except for 2017 nationally.
Fig. 6
Fig. 6. Dante’s and DBM’s short-term forecast skill and sharpness by geographic scale.
a Ratio of average forecast skills versus difference in 90% highest posterior density (HPD) interval widths for short-term forecasting targets. For all short-term forecasting targets and geographic scales, Dante produced sharper (i.e., smaller 90% HPD interval widths) and higher scoring forecasts than DBM. b Average 90% highest posterior density (HPD) interval widths for the short-term forecasting targets. Both Dante and DBM produce sharper (i.e., smaller 90% HPD interval widths) forecasts for coarser geographic resolutions. For all short-term forecasting targets and geographic scales, Dante produced sharper forecasts than DBM.
Fig. 7
Fig. 7. Dante’s empirical coverage.
Dante’s 90% empirical coverages for short-term targets, broken down by geographic scales. b Empirical coverages by target averaged over all seasons, geographic units within scale, and stages of flu season. a Empirical coverages broken out by stages of flu season. The “Around Peak” stage is defined as the peak week, plus/minus 2 weeks inclusively. Generally, empirical coverages degrade as the forecast window increases, as geographic scales coarsen, and as we get earlier in the flu season. The disagreement between empirical and nominal coverage for Dante represents an opportunity for iteration and improvement.
Fig. 8
Fig. 8. Dante’s posterior means for λr.
The posterior mean for λr versus the average number of patients seen weekly by each state. Both axes are on a log scale. A clear linear relationship is observed. Dante learns this relationship, as it has no explicit knowledge of the average number of patients.
Fig. 9
Fig. 9. Posterior summaries of Dante’s process model.
Posterior summaries for select components, seasons, and states of Dante, fit to seasons 2010 through 2017. Rows, from top to bottom, correspond to Alabama in 2015, Iowa in 2015, Alabama in 2017, and Iowa in 2017. Columns, from left to right, correspond to μall, μstate, μseason, μinteraction, π (all from Equation (5)), and θ (Equation (4)). The π column is the sum of the μall, μstate, μseason, and μinteraction columns, accounting for posterior covariances. The θ column is the inverse logit of the π column and is back on the scale of the data. The μall component is the most structured component, as it is common for all states and seasons (i.e., the same for all rows). The components μstate and μseason are the next most structured components. They describe the state-specific and season-specific deviations from μall, respectively, and are common for all seasons within a state (μstate) and all states within a season (μseason). The component μinteraction is the least structured component of Dante, as it is specific to each season/state (i.e., it is different for each row). Solid lines are posterior means. Ribbons are 95% posterior intervals. In the θ column, points are data, y.

References

    1. Disease Burden of Influenza. The Centers for Disease Control and Prevention, 2019. https://www.cdc.gov/flu/about/burden/index.html. Accessed on 6-13-2019.
    1. Biggerstaff M, et al. Results from the centers for disease control and prevention’s predict the 2013–2014 influenza season challenge. BMC Infec. Dis. 2016;16:357. doi: 10.1186/s12879-016-1669-x. - DOI - PMC - PubMed
    1. Biggerstaff M, et al. Results from the second year of a collaborative effort to forecast influenza seasons in the United States. Epidemics. 2018;24:26–33. doi: 10.1016/j.epidem.2018.02.003. - DOI - PMC - PubMed
    1. McGowan CJ, et al. Collaborative efforts to forecast seasonal influenza in the United States, 2015–2016. Sci. Rep. 2019;9:683. doi: 10.1038/s41598-018-36361-9. - DOI - PMC - PubMed
    1. Pei S, Kandula S, Yang W, Shaman J. Forecasting the spatial transmission of influenza in the United States. Proc. Natl Acad. Sci. USA. 2018;115:2752–2757. doi: 10.1073/pnas.1708856115. - DOI - PMC - PubMed

Publication types