

Genetic architecture and lifetime dynamics of inbreeding depression in a wild mammal
- PMID: 34016997
- PMCID: PMC8138023
- DOI: 10.1038/s41467-021-23222-9
Genetic architecture and lifetime dynamics of inbreeding depression in a wild mammal
Abstract
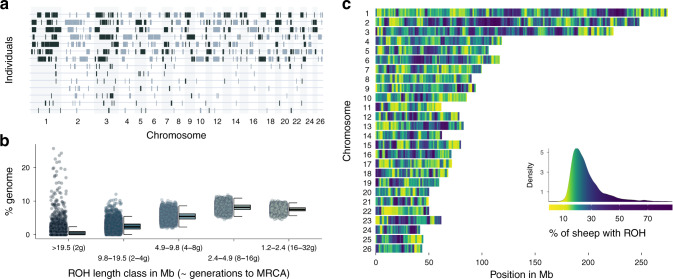
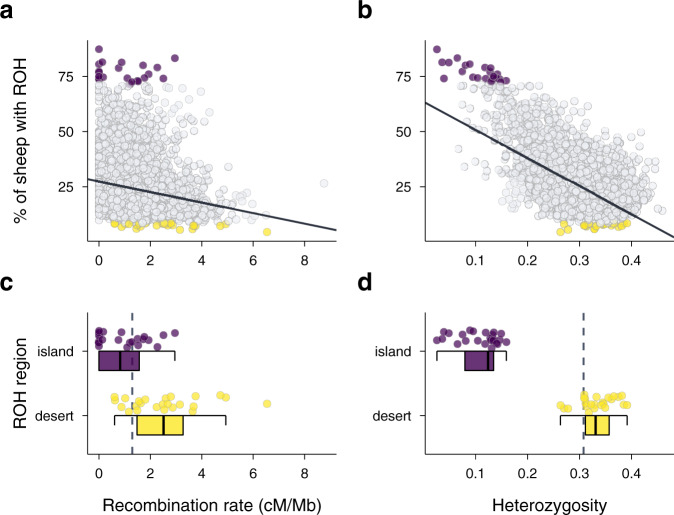
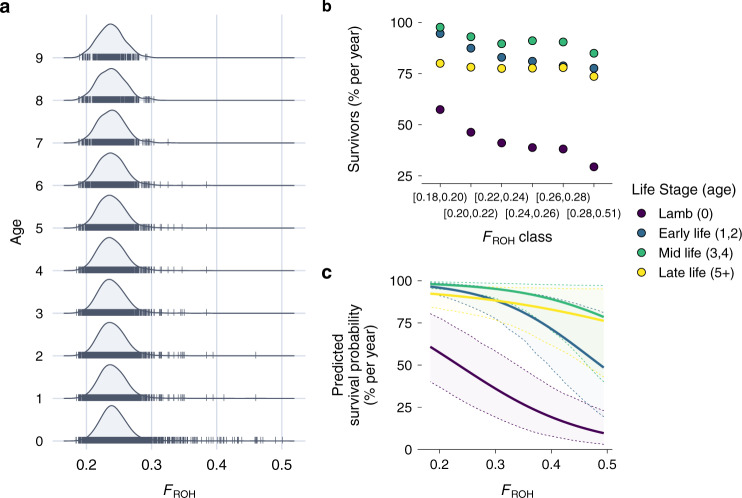
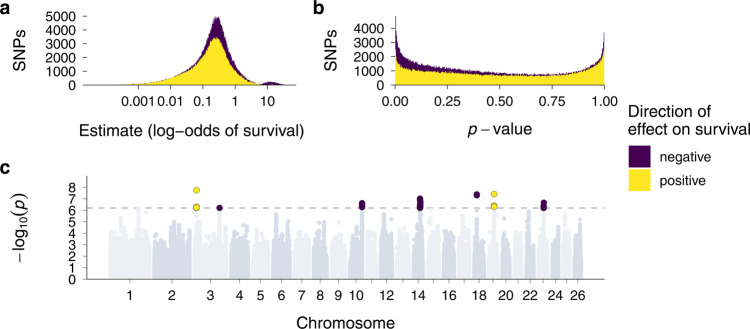
Inbreeding depression is ubiquitous, but we still know little about its genetic architecture and precise effects in wild populations. Here, we combine long-term life-history data with 417 K imputed SNP genotypes for 5952 wild Soay sheep to explore inbreeding depression on a key fitness component, annual survival. Inbreeding manifests in long runs of homozygosity (ROH), which make up nearly half of the genome in the most inbred individuals. The ROH landscape varies widely across the genome, with islands where up to 87% and deserts where only 4% of individuals have ROH. The fitness consequences of inbreeding are severe; a 10% increase in individual inbreeding FROH is associated with a 60% reduction in the odds of survival in lambs, though inbreeding depression decreases with age. Finally, a genome-wide association scan on ROH shows that many loci with small effects and five loci with larger effects contribute to inbreeding depression in survival.
Conflict of interest statement
The authors declare no competing interests.
Figures
Similar articles
-
Genetic architecture of inbreeding depression may explain its persistence in a population of wild red deer.Mol Ecol. 2024 May;33(9):e17335. doi: 10.1111/mec.17335. Epub 2024 Mar 28. Mol Ecol. 2024. PMID: 38549143
-
Runs of homozygosity analysis of South African sheep breeds from various production systems investigated using OvineSNP50k data.BMC Genomics. 2021 Jan 6;22(1):7. doi: 10.1186/s12864-020-07314-2. BMC Genomics. 2021. PMID: 33407115 Free PMC article.
-
Inbreeding depression across the genome of Dutch Holstein Friesian dairy cattle.Genet Sel Evol. 2020 Oct 28;52(1):64. doi: 10.1186/s12711-020-00583-1. Genet Sel Evol. 2020. PMID: 33115403 Free PMC article.
-
Runs of homozygosity: current knowledge and applications in livestock.Anim Genet. 2017 Jun;48(3):255-271. doi: 10.1111/age.12526. Epub 2016 Dec 1. Anim Genet. 2017. PMID: 27910110 Review.
-
[Runs of homozygosity and its application on livestock genome study].Yi Chuan. 2019 Apr 20;41(4):304-317. doi: 10.16288/j.yczz.18-287. Yi Chuan. 2019. PMID: 30992252 Review. Chinese.
Cited by
-
Little evidence of inbreeding depression for birth mass, survival and growth in Antarctic fur seal pups.Sci Rep. 2024 Jun 1;14(1):12610. doi: 10.1038/s41598-024-62290-x. Sci Rep. 2024. PMID: 38824161 Free PMC article.
-
Genomic and fitness consequences of a near-extinction event in the northern elephant seal.Nat Ecol Evol. 2024 Dec;8(12):2309-2324. doi: 10.1038/s41559-024-02533-2. Epub 2024 Sep 27. Nat Ecol Evol. 2024. PMID: 39333394 Free PMC article.
-
Strongly deleterious mutations influence reproductive output and longevity in an endangered population.Nat Commun. 2024 Sep 27;15(1):8378. doi: 10.1038/s41467-024-52741-4. Nat Commun. 2024. PMID: 39333094 Free PMC article.
-
Severe inbreeding, increased mutation load and gene loss-of-function in the critically endangered Devils Hole pupfish.Proc Biol Sci. 2022 Nov 9;289(1986):20221561. doi: 10.1098/rspb.2022.1561. Epub 2022 Nov 2. Proc Biol Sci. 2022. PMID: 36321496 Free PMC article.
-
Quantitative evaluation of nonlinear methods for population structure visualization and inference.G3 (Bethesda). 2022 Aug 25;12(9):jkac191. doi: 10.1093/g3journal/jkac191. G3 (Bethesda). 2022. PMID: 35900169 Free PMC article.
References
-
- Darwin, C. The Effect of Cross and Self Fertilization in the Vegetable Kingdom (John Murray, 1876).
-
- Angeloni F, Ouborg NJ, Leimu R. Meta-analysis on the association of population size and life history with inbreeding depression in plants. Biol. Conserv. 2011;144:35–43. doi: 10.1016/j.biocon.2010.08.016. - DOI
Publication types
MeSH terms
Grants and funding
LinkOut - more resources
Full Text Sources
Other Literature Sources
