Meta-Analysis
. 2021 May 20;12(1):2965.
doi: 10.1038/s41467-021-23324-4.

Interpretation of T cell states from single-cell transcriptomics data using reference atlases

Affiliations
Meta-Analysis

Interpretation of T cell states from single-cell transcriptomics data using reference atlases

Massimo Andreatta et al. Nat Commun. .

Abstract

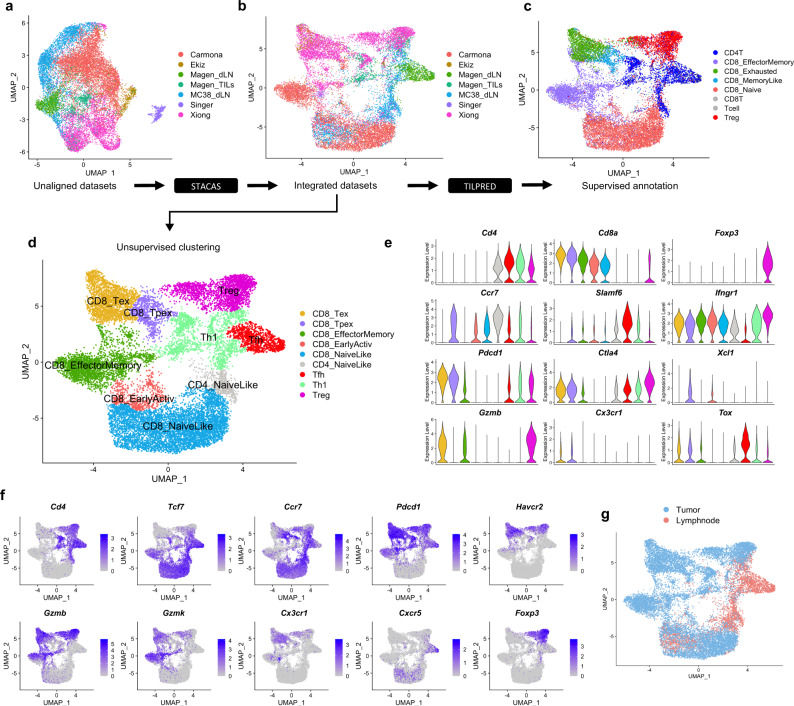
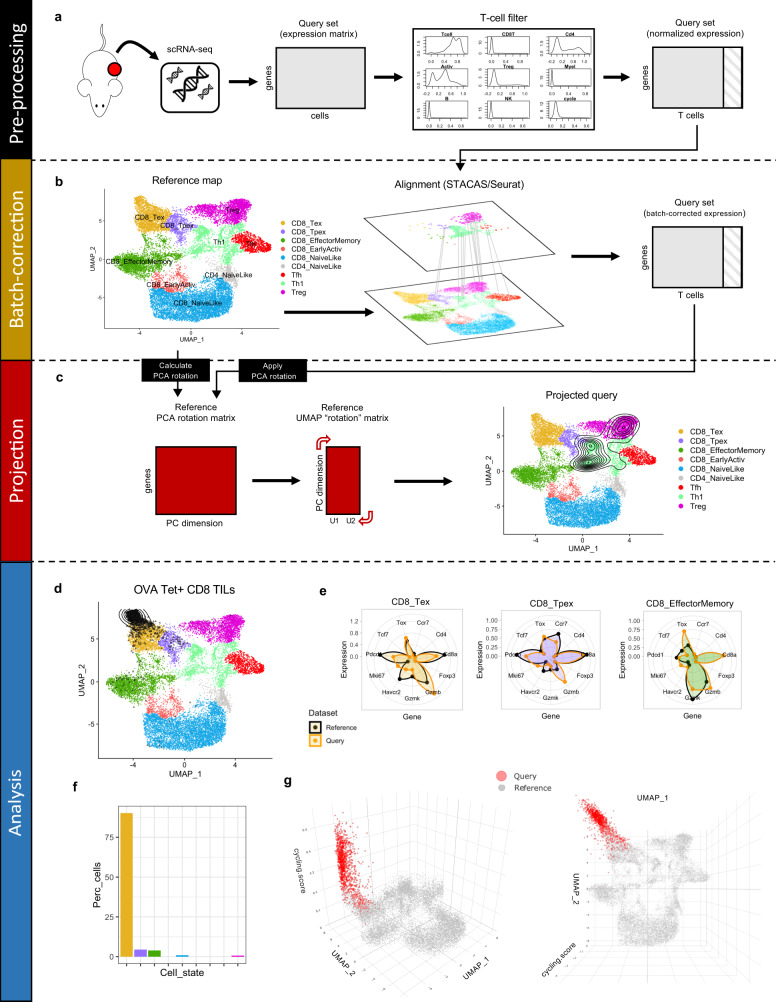
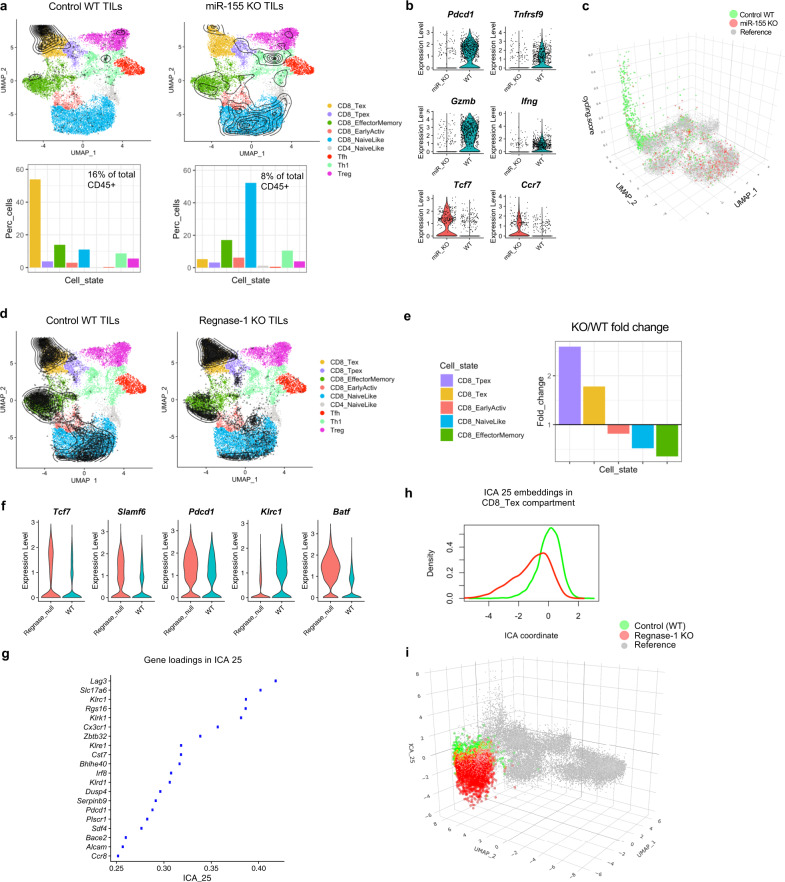
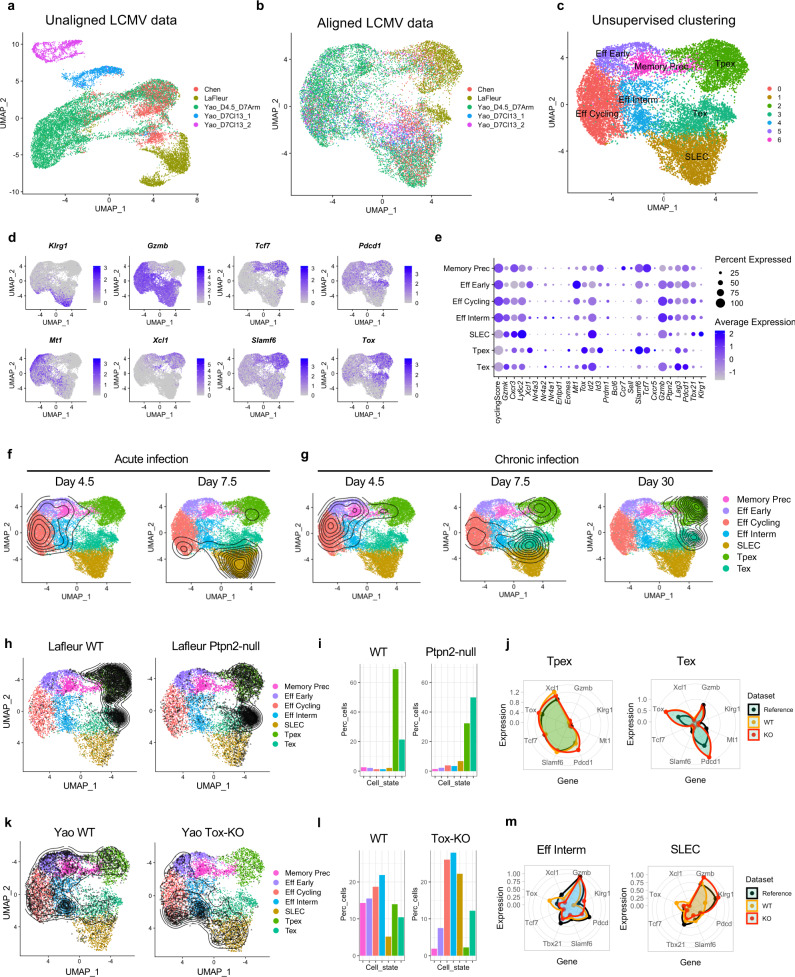
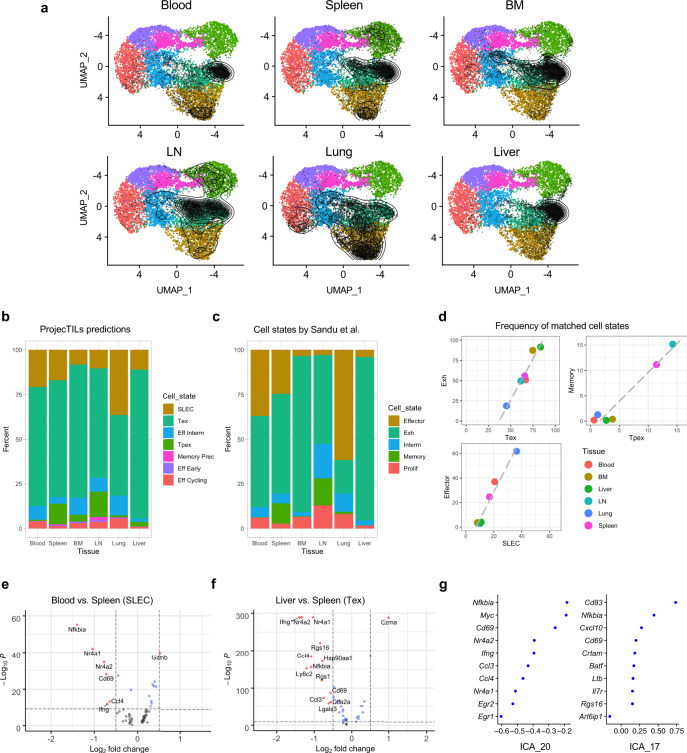
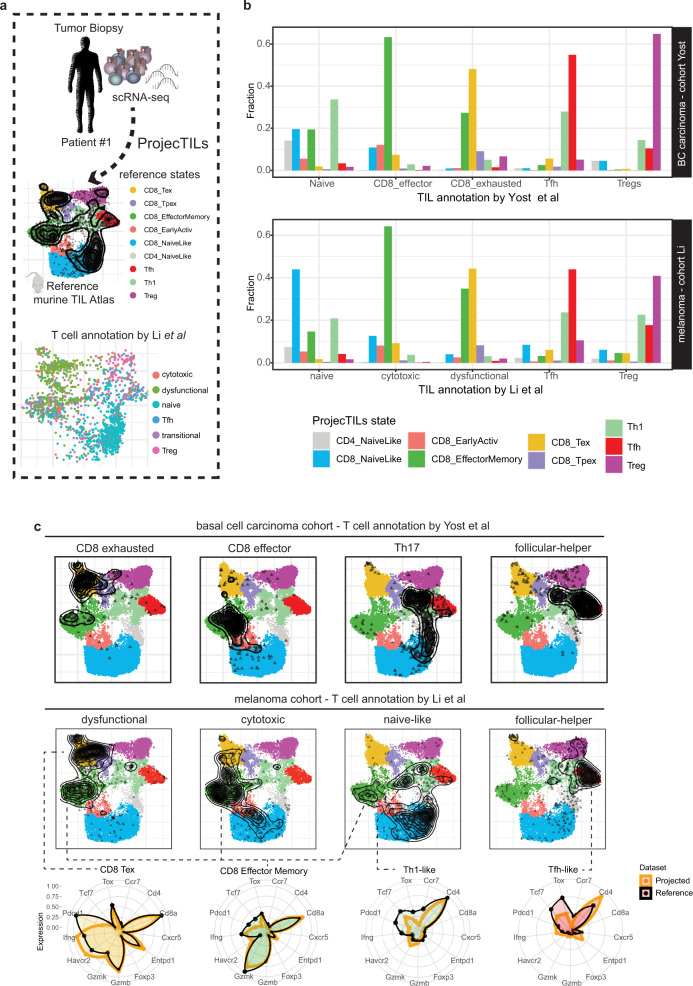
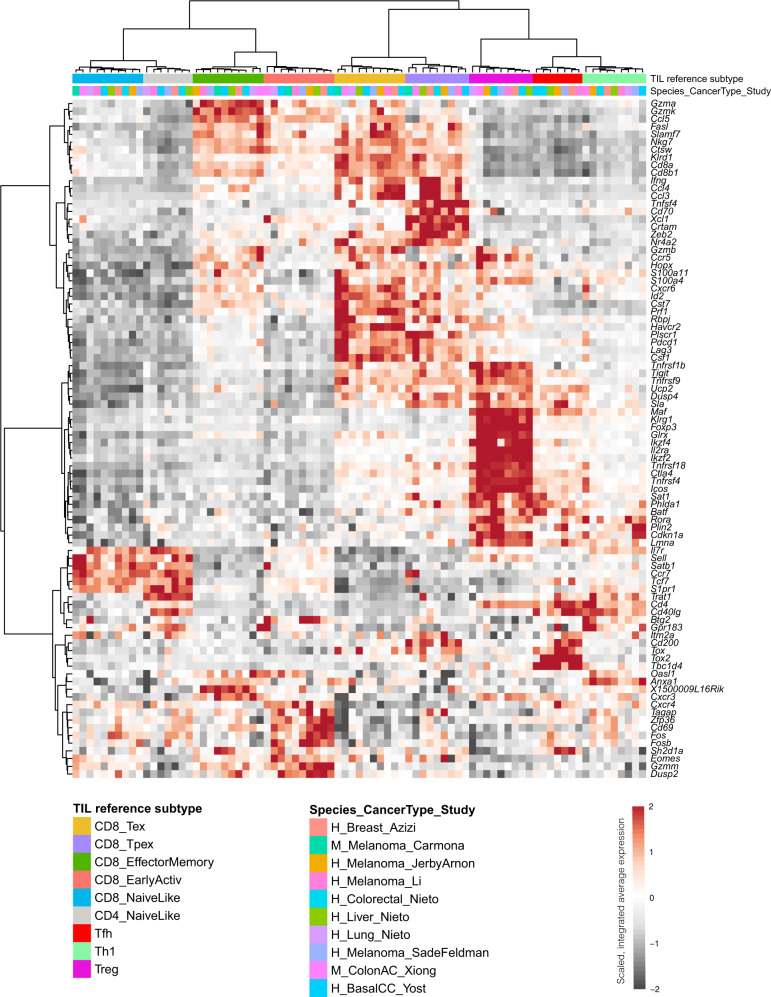
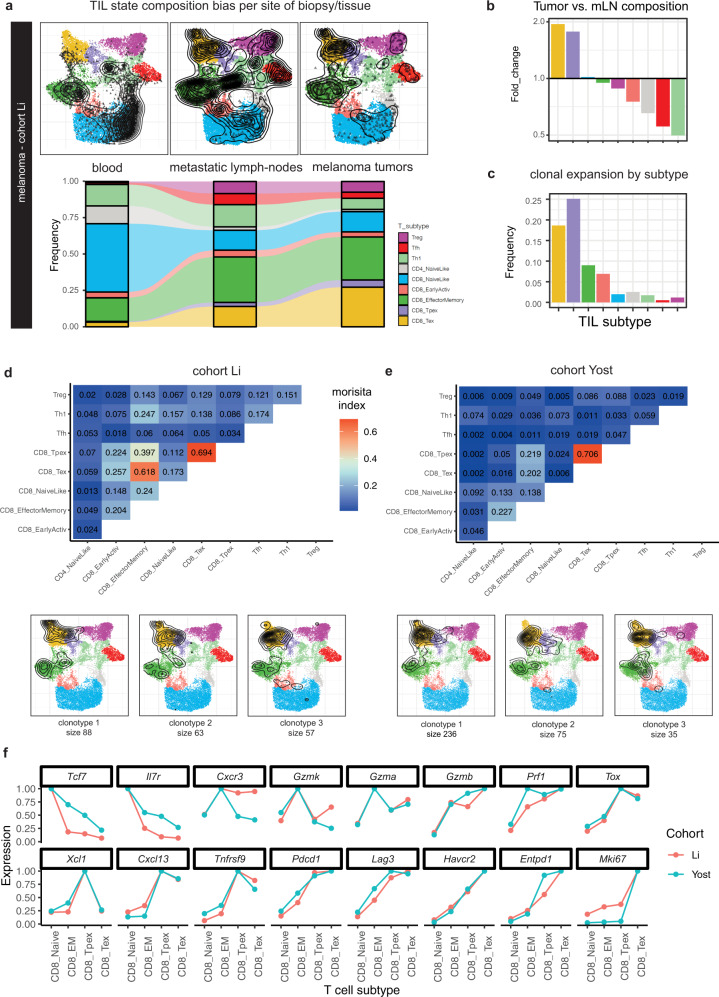
Single-cell RNA sequencing (scRNA-seq) has revealed an unprecedented degree of immune cell diversity. However, consistent definition of cell subtypes and cell states across studies and diseases remains a major challenge. Here we generate reference T cell atlases for cancer and viral infection by multi-study integration, and develop ProjecTILs, an algorithm for reference atlas projection. In contrast to other methods, ProjecTILs allows not only accurate embedding of new scRNA-seq data into a reference without altering its structure, but also characterizing previously unknown cell states that "deviate" from the reference. ProjecTILs accurately predicts the effects of cell perturbations and identifies gene programs that are altered in different conditions and tissues. A meta-analysis of tumor-infiltrating T cells from several cohorts reveals a strong conservation of T cell subtypes between human and mouse, providing a consistent basis to describe T cell heterogeneity across studies, diseases, and species.


Conflict of interest statement

MA, JCO, SJC declare no competing interests. GC has received grants, research support or is coinvestigator in clinical trials by BMS, Celgene, Boehringer Ingelheim, Roche, Iovance, and Kite; has received honoraria for consultations or presentations by Roche, Genentech, BMS, AstraZeneca, Sanofi-Aventis, Nextcure, and GeneosTx; he has patents in the domain of antibodies and vaccines targeting the tumor vasculature as well as technologies related to T-cell expansion and engineering for T-cell therapy; and he receives royalties from the University of Pennsylvania for CAR-T technologies licensed to Novartis. SM and RC are employees of Genentech, Inc, a member of the Roche family and receive salary and stock from Roche.

Figures

Fig. 1
Fig. 1. Building a reference map of TIL transcriptomic states.
a Uniform Manifold Approximation and Projection (UMAP) plots of single-cell transcriptomic profiles from different studies, before batch-effect correction (i.e., unaligned datasets); (b) Same plot for integrated datasets after STACAS alignment: successful dataset integration mitigates batch effects while preserving biological differences between T cell subtypes; (c) Supervised T cell subtype classification by TILPRED shows that, after alignment, cells cluster mainly by cell subtype rather than by dataset of origin; (d) Unsupervised clusters were annotated as nine functional states based on TILPRED prediction, as well as by (e) average expression of marker genes in each cluster and by (f) single-cell expression of key marker genes over the UMAP representation of the map; (g) Reference atlas colored by tissue of origin (tumor and draining lymph node). An interactive reference TIL atlas can be explored online at http://tilatlas.unil.ch.
Fig. 2
Fig. 2. The ProjecTILs analysis workflow.
a The essential input to ProjecTILs is a query dataset in the form of a gene expression matrix. Pre-processing steps include data normalization and filtering of non-T cells. b The normalized, filtered gene expression matrix is aligned to the reference map using STACAS, to bring the query data into the same scale as the reference map. c The PCA rotation matrix and UMAP transformation calculated on the reference map are applied to the query set, effectively embedding it into the same space of the reference map, and allowing their direct comparison and joint visualization. dg Projection of tumor-specific tetramer+ CD8+ TIL single-cell data from Miller et al. d Predicted coordinates of the projected query in UMAP space as density contours. e Gene expression signature of query cells (orange) and reference cells (black) for the three most represented T cell subtypes; average gene expression for the reference is normalized between 0 and 1. f Percentage of cells predicted by the algorithm for the nine cell states of the reference atlas; over 90% of total cells are predicted to be CD8+ terminally exhausted cells (CD8_Tex). g UMAP plot augmented with cell cycling score on the z axis (side and top view); CD8_Tex cells for the query dataset are shown in red.
Fig. 3
Fig. 3. ProjecTILs reveals the effect of genetic perturbations on T cell transcriptomes and phenotypes.
a–c ProjecTILs analysis of the tumor CD45+ scRNA-seq data by Ekiz et al.: a WT and miR-155 KO TILs projected on the reference atlas (black points and density contours) and barplots depicting percentage of cells projected in each T cell subtype for the two conditions. T cells constituted 16% and 8% of the CD45+ cells for the WT and miR-155 KO samples, respectively; (b) Violin plots showing expression of activation and cytotoxicity (Pdcd1, Tnfsf9/4-1BB, Gzmb, Ifng) and naive/memory (Tcf7, Ccr7) markers; (c) Cell cycling score represented on the z axis of the UMAP for the reference map of WT cells and miR-155 KO cells. di ProjecTILs analysis of the scRNA-seq data by Wei et al.: d Single-cell projection on the reference TIL atlas (similar to A); (e) Fold-change in the Regnase-1 KO compared to WT for each TIL subtype containing at least 50 cells; (f) Global expression level for selected genes in the Regnase-1 KO versus the WT; (g) Top 20 driver genes in terms of gene loadings for the transcriptional program captured in ICA (Independent Component Analysis) component 25, the most discriminant dimension between the WT and the Regnase-1 KO; (h) Distribution of ICA 25 component for cells in the WT (green) versus Regnase-1 KO (red) samples, as can be also visualized (i) by plotting these values on the z axis of the UMAP plot.
Fig. 4
Fig. 4. A reference atlas of virus-specific CD8+ T cells during acute and chronic infection.
a Unaligned datasets of lymphocytic choriomeningitis virus (LCMV)-specific CD8+ T (P14) cells during infection show pronounced batch effects, which (b) can be mitigated by STACAS alignment. c Unsupervised clusters were annotated to seven functional clusters by examining (d) the gradient of expression and (e) the average expression of marker genes by cluster, i.e., Memory Precursors; Early, Cycling, Intermediate, and short-lived (SLEC) effectors; Precursor Exhausted (Tpex) and Terminal exhausted (Tex) CD8+ T cells. f Density of cells across the map at two time points in acute infection and (g) at three different time points in chronic infection. hj Analysis of Ptpn2 KO versus control (WT) using the data by Lafleur et al.: h ProjecTILs projection of WT and Ptpn2 KO cells onto the infection reference map; (i) predicted percentage of cells for each T cell subtype; (j) normalized average expression for selected markers in the reference map, in WT and Ptpn2 KO cells. km Analysis of Tox KO versus control (WT) using the data by Yao et al.: k Projection in UMAP space by ProjecTILs for the WT and Tox KO samples; (l) predicted percentage of cells for each T cell type; (m) normalized average expression for selected markers in the reference map, in WT and Tox KO cells. Batches for integration (panels a, b): Chen: chronic infection day 8; LaFleur: chronic infection day 30; Yao_D4.5_D7Arm: acute and chronic infection day 4.5 + acute infection day 7; Yao_D7_Cl13_1 chronic infection day 7 sample 1; Yao_D7_Cl13_2 chronic infection day 7 sample 2.
Fig. 5
Fig. 5. ProjecTILs resolves tissue-specific T cell heterogeneity in chronic viral infection.
a Projection of single-cell data onto the viral infection CD8+ T cell reference atlas for six different tissues, from the study by Sandu et al. b Distribution of ProjecTILs predicted T cells states for each tissue and (c) distribution of T cell states assigned in the original study by unsupervised analysis. d For three T cell states that could be confidently mapped between the original annotation and the ProjecTILs prediction (Exh ↔ Tex; Memory ↔ Tpex; Effector ↔ SLEC), the panels show the cell state percentage for each of the six tissues, according to the predicted (x axis) and original (y axis) cell annotation. e Volcano plot of differentially expressed genes between blood and spleen for cells predicted to be SLEC, and (f) between liver and spleen for cells assigned to the Tex state. g Two of the most discriminant ICA components (ICA 20 and ICA 17) between spleen and other tissues. BM bone marrow, LN lymph-node. Raw data for panel c courtesy of the authors of the original study.
Fig. 6
Fig. 6. Accurate classification of human TIL states by projecting cancer patient transcriptomes on a reference mouse atlas.
a scRNA-seq data from patients’ biopsies were analyzed using ProjecTILs in human-mouse orthology mode. Below, UMAP projection for TILs from one subject, colored by annotation according to Li et al. Projections for other subjects are available in Supplementary Fig. 9. b Fraction of cells classified in different subtypes by ProjecTILs compared to main original annotations by Yost et al. or Li et al. (complete annotation in Supplementary Fig. 10). c UMAP projections of cell subsets defined according to TIL state annotations by Yost et al. (e.g. exhausted, effector) or Li et al. (e.g. dysfunctional, cytotoxic). Radar plots display representative expression profiles of cells classified in the reference states for T cell marker genes. BC carcinoma basal cell carcinoma.
Fig. 7
Fig. 7. Conservation of T cell subtypes across studies, cancer types, and species.
Columns correspond to reference TIL subtypes for a given study, including all subtype-study combinations represented by at least 50 cells. Rows represent 88 marker genes, identified by concatenating all genes that were differentially expressed for at least one T cell state in at least four studies, limiting the number of genes per state to at most 25 genes. Values correspond to integrated average expression for the given gene and subtype-study combination, scaled and centered by row. Clustering by column shows that subtype-study expression profiles cluster preferentially by TIL subtype rather than by study, cohort or species (top colored bars). Species abbreviations: H human, M mouse.
Fig. 8
Fig. 8. ProjecTILs analysis of human TIL states across tissues and their clonal relatedness.
a ProjecTILs projections and predicted subtype frequencies in biopsies from different tissues: blood, metastatic lymph nodes (mLN) and tumors (data from Li et al. cohort). b Subtype composition bias (fold change) in tumors vs mLN. c Frequency of cells from the top 10 expanded clonotypes over the total number of cells in each subtype. d–e The upper panels (heatmaps) display Morisita similarity indices measuring TCR repertoire overlap for each pair of TIL subtypes in the Li et al. (d) and Yost et al. (e) cohorts. Bottom panels: projection of TIL clones for the top three expanded clonotypes enriched in Tex or Tpex subtypes in each patient cohort. f Average normalized gene expression of human T cells projected in the CD8+ NaiveLike, CD8+ Effector Memory (CD8_EM), CD8+ Tpex and CD8+ Tex subtypes for a panel of key marker genes.
Fig. 9
Fig. 9. A model of intratumoral CD8+ T cell differentiation supported by meta-analysis of human scRNA-seq data using ProjecTILs.
Blood-circulating CXCR3-high EM cells are recruited to the tumor; these include tumor-specific EM cells as well as bystander TILs. Persistent antigen stimulation drives differentiation of tumor-specific EM TILs into XCL1-high Tpex cells which, following interaction with XCR1+ APCs, give rise to highly proliferative Tex CD8+ TILs with capacity to kill cancer cells. An alternative differentiation path from EM directly to Tex is also plausible. EM: CD8+ effector memory/CD8_EM (TOX-low GZMK-high CXCR3-high). Tpex: CD8+ precursor-exhausted (TOX-high TCF7-high GZMB-low). Tex: CD8+ exhausted/dysfunctional (TOX-high, TCF7-low, GZMB-high).

References

    1. Blank, C. U. et al. Defining ‘T cell exhaustion’. Nat. Rev. Immunol. 1–10 (2019) 10.1038/s41577-019-0221-9. - PMC - PubMed
    1. Fridman WH, Pagès F, Sautès-Fridman C, Galon J. The immune contexture in human tumours: impact on clinical outcome. Nat. Rev. Cancer. 2012;12:298–306. doi: 10.1038/nrc3245. - DOI - PubMed
    1. Tumeh PC, et al. PD-1 blockade induces responses by inhibiting adaptive immune resistance. Nature. 2014;515:568–571. doi: 10.1038/nature13954. - DOI - PMC - PubMed
    1. Azizi E, et al. Single-cell map of diverse immune phenotypes in the breast tumor microenvironment. Cell. 2018;174:1293–1308. doi: 10.1016/j.cell.2018.05.060. - DOI - PMC - PubMed
    1. Li H, et al. Dysfunctional CD8 T cells form a proliferative, dynamically regulated compartment within human melanoma. Cell. 2019;176:775–789. doi: 10.1016/j.cell.2018.11.043. - DOI - PMC - PubMed

Publication types

MeSH terms