. 2021 May 20;12(1):2993.
doi: 10.1038/s41467-021-23276-9.

Controlling COVID-19 via test-trace-quarantine

Affiliations

Controlling COVID-19 via test-trace-quarantine

Cliff C Kerr et al. Nat Commun. .

Abstract

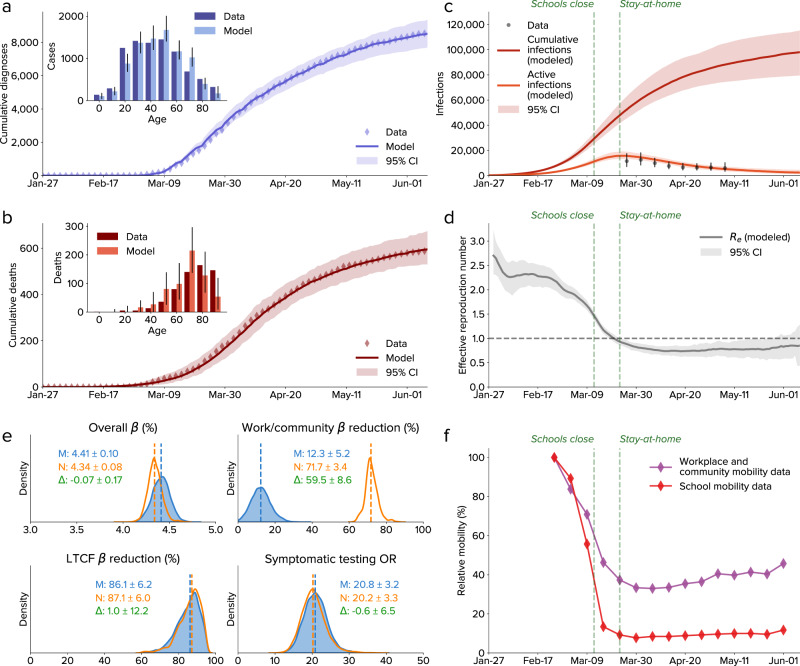
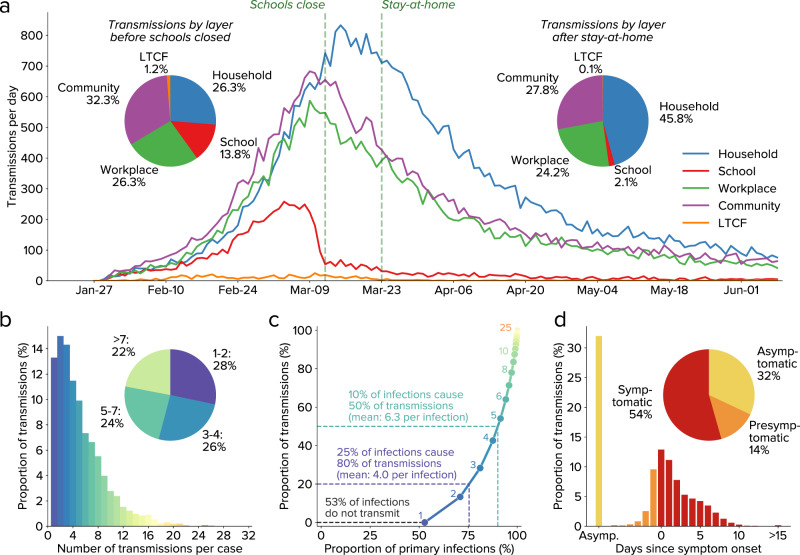
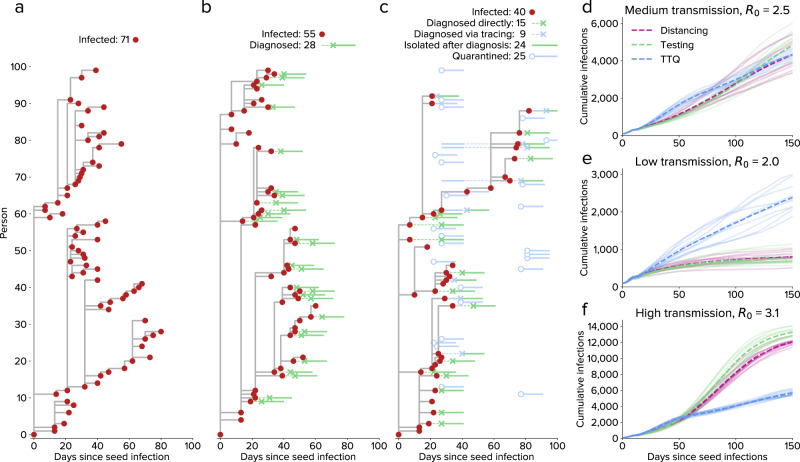
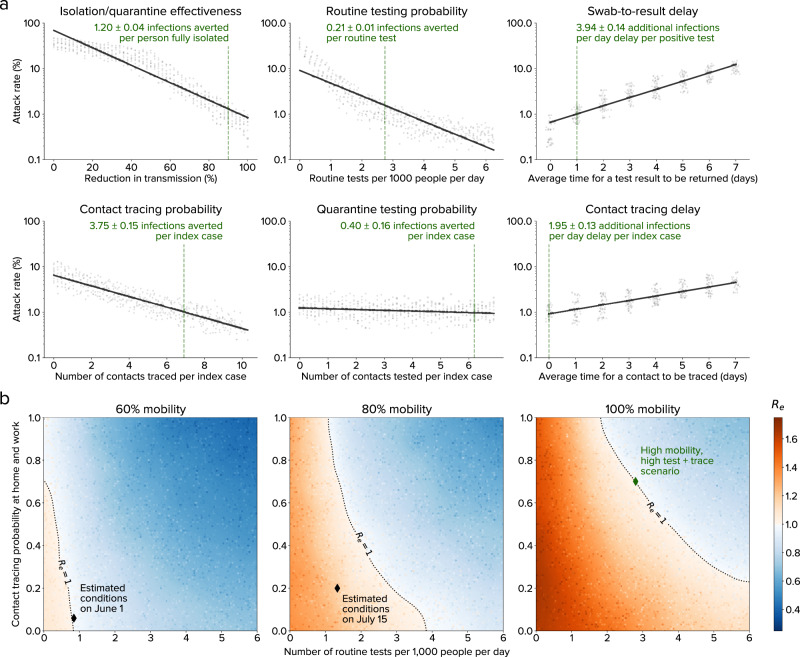
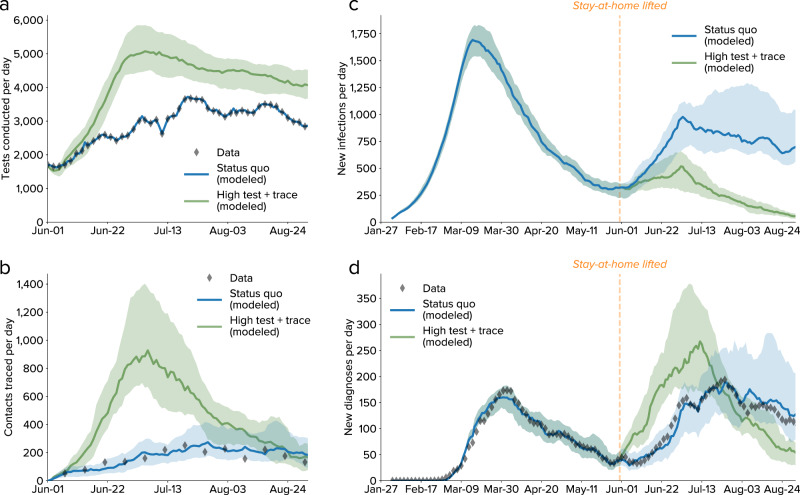
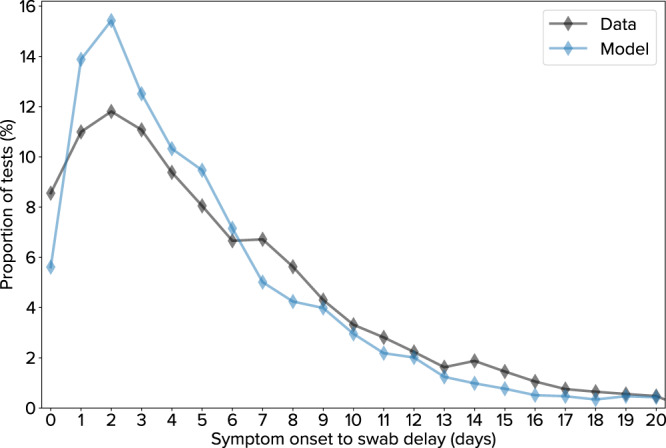
Initial COVID-19 containment in the United States focused on limiting mobility, including school and workplace closures. However, these interventions have had enormous societal and economic costs. Here, we demonstrate the feasibility of an alternative control strategy, test-trace-quarantine: routine testing of primarily symptomatic individuals, tracing and testing their known contacts, and placing their contacts in quarantine. We perform this analysis using Covasim, an open-source agent-based model, which has been calibrated to detailed demographic, mobility, and epidemiological data for the Seattle region from January through June 2020. With current levels of mask use and schools remaining closed, we find that high but achievable levels of testing and tracing are sufficient to maintain epidemic control even under a return to full workplace and community mobility and with low vaccine coverage. The easing of mobility restrictions in June 2020 and subsequent scale-up of testing and tracing programs through September provided real-world validation of our predictions. Although we show that test-trace-quarantine can control the epidemic in both theory and practice, its success is contingent on high testing and tracing rates, high quarantine compliance, relatively short testing and tracing delays, and moderate to high mask use. Thus, in order for test-trace-quarantine to control transmission with a return to high mobility, strong performance in all aspects of the program is required.


Conflict of interest statement

The authors declare no competing interests.

Figures

Fig. 1
Fig. 1. Calibration of the model to data from Seattle-King County, Washington, from 27 January to 9 June 2020.
ab The cumulative number of diagnosed cases and deaths, over time and by age. c Estimated numbers of cumulative and active infections. Dashed lines show policy interventions; data are from the Seattle Coronavirus Assessment Network. d Effective reproduction number, showing a drop consistent with policy interventions. e Parameter distributions for 23,913 simulations calibrated either with SafeGraph mobility data (M, blue) or with no mobility data (N, orange); the difference (Δ, green) is only significant for work/community transmission reduction. f SafeGraph mobility data for workplaces and the community and for schools. CI, confidence interval; β, transmission rate; LTCF, long-term care facility; OR, odds ratio. In all panels, values show medians, and ranges show 95% confidence intervals.
Fig. 2
Fig. 2. Modeled transmission dynamics.
a Infections over time by contact layer. b Overdispersion of infections (up until school closures on 12 March), with roughly equal numbers of infections attributable to individuals who transmit to 1–2 others, 3–4 others, 5–7 others, or more than 7 others. c Due to overdispersion, 53% of all primary infections do not cause any secondary infections, while 10% of primary infections are responsible for 50% of secondary infections. Annotations show the number of transmissions per primary infection, corresponding to each bar of panel b. d Infections as a function of symptom onset, showing that slightly over half of infections are transmitted by symptomatic individuals.
Fig. 3
Fig. 3. Epidemic dynamics differ depending on the intervention.
ac: Transmission trees for a cluster of 100 people under three scenarios: (a) no interventions, (b) testing and isolation only (starting on day 20), and (c) test-trace-quarantine. df Comparison of different levels of baseline transmissibility for social distancing only, testing only, or test-trace-quarantine (TTQ). For medium baseline transmission (d), moderate distancing, high testing, or high tracing each result in Re ≈ 1. For low transmission (e), the same distancing and testing interventions both result in Re < 1, while the same tracing intervention maintains Re ≈ 1. For high transmission (f), the same distancing and testing interventions both result in Re > 1, while the same tracing intervention continues to maintain Re ≈ 1.
Fig. 4
Fig. 4. Impact of testing, tracing, and quarantine.
a Relative importance of different aspects of the TTQ strategy for a scenario of high mobility (full return to baseline workplace and community movement patterns), high testing, and high tracing in Seattle. Each dot shows a simulation, with other parameters held constant (at the values indicated by the dashed green lines). Low levels of isolation/quarantine effectiveness or routine testing probability lead to the highest attack rates, although all parameters have a significant impact on epidemic outcomes. b Countering the effects of increased mobility via testing, tracing, and quarantine. Current interventions (black diamonds) were estimated to keep Re < 1 for 60% of baseline mobility level (left). Subsequently, increased transmission rates exceeded intervention scale-up, temporarily leading to Re > 1 (center). For a return to full mobility (right), high levels of both testing and tracing are required to maintain epidemic control (green diamond, corresponding to the dashed lines in panel a). Dots show individual simulations.
Fig. 5
Fig. 5. Comparison between observed epidemic trends and projected scenarios from 1 June to 31 August 2020.
a Number of tests conducted per day, with modeled values for the status quo (using the data as an input) and a counterfactual scenario with high testing and high tracing. b Number of contacts traced per day. c Estimated number of new infections, with a significant rise in infections observed shortly after the stay-at-home order was lifted. d Number of diagnoses per day, showing consistency between the model and the data both for the calibrated period (27 January–31 May 2020) and the projected period (1 June–31 August 2020). In all panels, lines show medians, and shaded regions show 80% confidence intervals.
Fig. 6
Fig. 6. Delay from COVID-19 symptom onset to nasal swab sample collection.
Comparison of empirical (black) and simulated (blue) distributions of delays.

References

    1. Dong E, Du H, Gardner L. An interactive web-based dashboard to track COVID-19 in real time. Lancet Infect. Dis. 2020;20:533–534. doi: 10.1016/S1473-3099(20)30120-1. - DOI - PMC - PubMed
    1. Maier BF, Brockmann D. Effective containment explains subexponential growth in recent confirmed COVID-19 cases in China. Science. 2020;368:742–746. doi: 10.1126/science.abb4557. - DOI - PMC - PubMed
    1. Coibion, O., Gorodnichenko, Y. & Weber, M. The Cost of the Covid-19 Crisis: Lockdowns, Macroeconomic Expectations, and Consumer Spending. Natl Bureau Econ Res. 10.3386/w27141. (2020).
    1. Kretzschmar ME, et al. Impact of delays on effectiveness of contact tracing strategies for COVID-19: a modelling study. Lancet Public Health. 2020;5:e452–e459. doi: 10.1016/S2468-2667(20)30157-2. - DOI - PMC - PubMed
    1. Kucharski AJ, et al. Effectiveness of isolation, testing, contact tracing, and physical distancing on reducing transmission of SARS-CoV-2 in different settings: a mathematical modelling study. Lancet Infect. Dis. 2020;20:1151–1160. doi: 10.1016/S1473-3099(20)30457-6. - DOI - PMC - PubMed

Publication types