. 2021 May 20;4(1):599.
doi: 10.1038/s42003-021-02127-9.

TRPM7 is an essential regulator for volume-sensitive outwardly rectifying anion channel

Affiliations

TRPM7 is an essential regulator for volume-sensitive outwardly rectifying anion channel

Tomohiro Numata et al. Commun Biol. .

Abstract

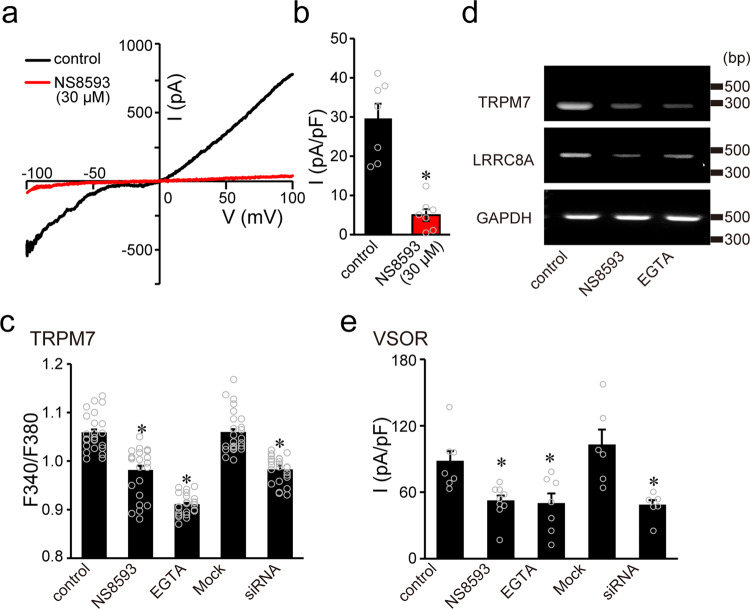
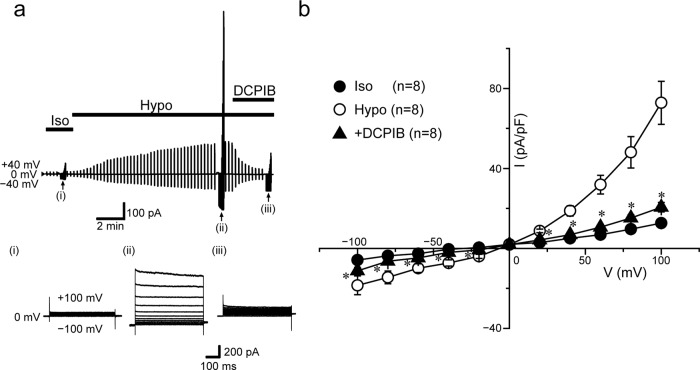
Animal cells can regulate their volume after swelling by the regulatory volume decrease (RVD) mechanism. In epithelial cells, RVD is attained through KCl release mediated via volume-sensitive outwardly rectifying Cl- channels (VSOR) and Ca2+-activated K+ channels. Swelling-induced activation of TRPM7 cation channels leads to Ca2+ influx, thereby stimulating the K+ channels. Here, we examined whether TRPM7 plays any role in VSOR activation. When TRPM7 was knocked down in human HeLa cells or knocked out in chicken DT40 cells, not only TRPM7 activity and RVD efficacy but also VSOR activity were suppressed. Heterologous expression of TRPM7 in TRPM7-deficient DT40 cells rescued both VSOR activity and RVD, accompanied by an increase in the expression of LRRC8A, a core molecule of VSOR. TRPM7 exerts the facilitating action on VSOR activity first by enhancing molecular expression of LRRC8A mRNA through the mediation of steady-state Ca2+ influx and second by stabilizing the plasmalemmal expression of LRRC8A protein through the interaction between LRRC8A and the C-terminal domain of TRPM7. Therefore, TRPM7 functions as an essential regulator of VSOR activity and LRRC8A expression.


Conflict of interest statement

The authors declare no competing interests.

Figures

Fig. 1
Fig. 1. TRPM7 expression is involved in VSOR activity and LRRC8A expression in HeLa cells.
a Representative whole-cell current traces elicited by step pulses in isotonic and hypotonic conditions in Mock-transfected (Mock) and siRNA-TRPM7-treated (siRNA) cells. Arrowheads indicate currents at 0 mV. b Mean current (I)–voltage (V) relationships for swelling-activated whole-cell currents observed in Mock and siRNA cells (n = 12–18). Each data point represents the mean ± SEM (vertical bar) of n samples. *P (=0.00053, 0.00036, 0.00028, 0.00024, 0.00033, 0.0018, 0.000083, 0.000085, 0.000091, 0.00010, and 0.00011 at −100, −80, −60, −40, −20, 0, +20, +40, +60, +80, and +100 mV, respectively) <0.005 compared to the Mock cell data by t-test. c Effects of TRPM7 knockdown on expression of TRPM7 and LRRC8A mRNAs. Left panel shows the PCR products from Mock or siRNA cells for TRPM7, LRRC8A, and the constitutively transcribed control, GAPDH. The nucleotide sequences of the PCR products obtained with TRPM7- and LRRC8A-specific primers were completely identical to the corresponding sequences for TRPM7 (human: NM_017672) and LRRC8A (human: NM_001127244), respectively. Right panels show the bar graph representation of the relative expression values of the optical densities in pixels of the PCR bands of TRPM7 (left bars: 45.3 ± 5.1%) and LRRC8A (right bars: 59.4 ± 3.4%) in siRNA cells compared to those in Mock cells. The values were calculated from five independent PCR amplifications after normalization to the corresponding band of GAPDH control. *P (=0.00013 and 0.00010 for TRPM7 and LRRC8A, respectively) <0.0005 compared to Mock cell data by t-test.
Fig. 2
Fig. 2. TRPM7-mediated steady-state Ca2+ influx regulates the mRNA expression levels of TRPM7 and LRRC8A through the regulation of intracellular Ca2+ concentration in HeLa cells.
a Representative I–V relationships of currents in response to ramp pulses (50 ms duration) from −100 to +100 mV before (control) and after 2-day treatment with 30 µM NS8593 (NS8593). b Mean peak current densities at +100 mV in the absence (black column) and presence of NS8593 (red column) (n = 6). * indicates a P (=0.000058) value of <0.0001 compared to the corresponding control (left column) by t-test. c Cytosolic Ca2+ levels were determined by fura-2 ratio imaging in the cells before (control) and after treatment with 30 µM NS8593 for 2 days (NS8593), 2 mM EGTA for 2 days (EGTA), mock siRNA for 2–3 days (Mock), and TRPM7-siRNA for 2–3 days (siRNA) (n = 24). *P (=0.0000000014, 0.000000000067, and 0.0000000032 for NS8593, EGTA, and siRNA, respectively) <0.0001 compared to the corresponding control data by one-way ANOVA followed by the post hoc Tukey’s test. d Representative PCR products of human TRPM7, LRRC8A, and GAPDH in the cells before (control) and after 2-day treatment with 30 µM NS8593 (NS8593) or 2 mM EGTA (EGTA) from three independent experiments. The expression of TRPM7 and LRRC8A mRNAs was greatly decreased in NS8593- or EGTA-treated cells, while that of GAPDH mRNA stayed almost constant. The nucleotide sequences of the PCR products obtained with TRPM7- and LRRC8A-specific primers were completely identical to the corresponding sequences in TRPM7 (human: NM_017672) and LRRC8A (human: NM_001127244), respectively. e Swelling-induced peak VSOR current densities recorded at +40 mV before (control) and after treatment with NS8593 (NS8593), EGTA (EGTA), negative control siRNA (Mock), and TRPM7-siRNA (siRNA) (n = 6–9). Each column represents the mean ± SEM (vertical bar) of n samples. *P (=0.038, 0.036, and 0.037 for NS8593, EGTA, and siRNA, respectively) <0.05 compared to corresponding control data by one-way ANOVA followed by the post hoc Tukey’s test.
Fig. 3
Fig. 3. Endogenous VSOR activity in DT40 cells.
a Representative recording showing the time course of whole-cell currents before (Iso) and after (Hypo) hypotonic stimulation (86% osmolality) in the absence and presence of DCPIB (10 µM). Currents were elicited by alternating pulses from 0 to ±40 mV. Step pulses from −100 to +100 mV in 20-mV increments were applied at time points indicated by (i), (ii), and (iii). Bars above the recordings indicate the time during applications of hypotonic solution and DCPIB (10 µM). b Mean I–V relationships for isotonic (Iso) and hypotonicity-induced (Hypo) whole-cell currents before and during application of DCPIB (+DCPIB: n = 8). Each data point represents the mean ± SEM (vertical bar) of n samples. *P (=0.048, 0.028, 0.0499, 0.0054, 0.016, 0.0018, 0.00050, 0.00056, 0.0011, and 0.00031 at −100, −80, −60, −40, −20, +20, +40, +60, +80, and +100 mV, respectively) <0.05 compared to corresponding data in Hypo group by t-test.
Fig. 4
Fig. 4. Augmentation of whole-cell TRPM7 currents by hypotonic stimulation in DT40 cells.
a Effects of hypotonic stimulation on whole-cell TRPM7 currents under ramp-clamp (every 5 s at 4 mV/ms) in the cells equilibrated with the ATP-free and low-Cl intracellular (pipette) solution. Representative peak outward and inward currents recorded at +100 and −100 mV, respectively, before (Iso) and after (Hypo) application of hypotonic (86% osmolarity) solution. b Representative I–V relationships of currents in response to ramp pulses (50-ms duration) from −100 to +100 mV before (at i in a) and during (at ii in a) hypotonic stimulation. c Peak current densities at +100 (blank columns) and −100 mV (filled columns) in isotonic (Iso) and hypotonic (Hypo) conditions (n = 8). Each data point represents the mean ± SEM (vertical bar) of n samples. *P (=0.0029 and 0.00017 at +100 and −100 mV, respectively) <0.005 compared to corresponding data in Iso group by t-test.
Fig. 5
Fig. 5. Mg2+ sensitivity of TRPM7 currents in DT40 cells.
a Representative recording showing the time course of whole-cell currents recorded at +100 and −100 mV during hypotonic stimulation in the cells before and after extracellular application of 1 mM Mg2+ (Mg2+). Currents were elicited by ramp-clamp (every 5 s at 4 mV/ms). Bars above the recording indicate the time during applications of hypotonic solution (Hypo) and Mg2+. b Representative I–V relationships of currents in response to ramp pulses from −100 to +100 mV before (at i in a) and during application of Mg2+ (at ii in a). c Peak current densities at +100 (blank columns) and –100 mV (filled columns) before (0Mg2+) and after application of 1 mM Mg2+ (1Mg2+) (n = 13). Each data point represents the mean ± SEM (vertical bar) of n samples. *P (=0.048 and 0.021 at +100 and −100 mV, respectively) <0.05 compared to corresponding data in 0Mg2+ group by t-test.
Fig. 6
Fig. 6. Real-time simultaneous recordings of TRPM7 and VSOR activity after hypotonic stimulation in DT40 cells.
a Whole-cell current response to hypotonic stimulation. Upper left panel shows representative recording exhibiting the time courses of whole-cell currents observed at +30 mV (open circles) and –30 mV (filled circles), which correspond to the equilibrium potentials for cations and anions, respectively, under the ionic conditions employed for this recording. Lower left panel shows the reversal potentials (Erev: open triangles) after application of hypotonic solution (Hypo) in WT DT40 cells. Currents were elicited by ramp-clamp (every 10 s at 4 mV/ms). The value of Erev was evaluated by analyzing the measured reversal potentials of the all current traces in response to ramp pulses. Right panels show representative I–V relationships of currents in response to ramp pulses from –100 to +100 mV applied at (i), at (ii), and at (iii) in the left panel. Insets represent I–V curves expanded in the y-axis direction. b, c Relationships between the mean peak current densities recorded at +30 mV (VSOR activity) and those at –30 mV (M7 activity) (n = 7) in WT DT40 cells (b) and in gTRPM7-deficient DT40 cells complemented with hTRPM7 (c).
Fig. 7
Fig. 7. Effects of gTRPM7 knockout and complementary expression of hTRPM7 on gLRRC8A expression and RVD efficacy in DT40 cells.
a PCR products of human or chicken TRPM7, chicken LRRC8A, and the constitutively transcribed control, chicken beta-actin (ACTB) in control, gTRPM7-KO DT40 cells (KO) and hTRPM7-expressing KO cells (+hM7). The expression of chicken LRRC8A mRNA was greatly decreased in KO cells and increased in +hM7 cells, while that of ACTB stayed almost constant. The nucleotide sequences of the PCR products obtained with TRPM7- and LRRC8A-specific primers were completely identical to the corresponding sequences in TRPM7 (human: NM_017672; chicken: NM_001177555) and LRRC8A (chicken: XM_015279569.2), respectively. b The bar graphs represent the relative expression values of the optical densities in pixels of the PCR bands of gLRRC8A compared to the corresponding band of ACTB control. These values were calculated from six independent PCR amplifications. *P (=0.039 and 0.0000021 for KO and +hM7, respectively) <0.05 compared to control data by one-way ANOVA followed by the post hoc Tukey’s test. c, d Time courses of changes in the mean cell volume of WT DT40 cells after a hypotonic challenge (Hypo: 78% osmolarily). The RVD event was inhibited by DCPIB (10 µM) (c) and gTRPM7-KO (KO), whereas it was facilitated in hTRPM7-expressing KO cells (+hM7) (d). e Summarized data showing the percent volume recovery (RVD) at 30 min after application of hypotonic solution (n = 6–20). Each data point represents the mean ± SEM (vertical bar) of n samples. *P (=0.00035, 0.011, and 0.000070 for +DCPIB, KO, and +hM7, respectively) <0.05 compared to corresponding data in control data by one-way ANOVA followed by the post hoc Tukey’s test.
Fig. 8
Fig. 8. Effects of gTRPM7 knockout and complementary expression with hTRPM7 or its mutant on the protein expression monitored by immunohistochemistry as well as on VSOR and TRPM7 currents recorded by whole-cell patch-clamp in DT40 cells.
a Representative fluorescence micrographs of gTRPM7-KO DT40 cells immunostained with anti-HA antibody before (KO) and after complementary expression with WT hTRPM7 or its mutant (Alexa-488: green) as well as their bright field micrographs. Scale bar, 5 μm. b The percentage of TRPM7 localization to the plasma membrane is significantly lower in the C-terminal defects (+Δ-kinase: *P (=1.1 × 10−233) <0.0001 compared to +WT data by χ2 test). Observations and analyses were performed from 53–110 individual cells. c Western blot analyses of α-tubulin, HA-tagged hTRPM7 from KO, +WT, +Δ-kinase, and +K1648R DT40 cells. The data are representative of three independent experiments. d Representative whole-cell VSOR currents elicited by step pulses in isotonic conditions (Iso) and in hypotonic conditions (Hypo) in gTRPM7-knockout (KO) DT40 cells and those complemented with hTRPM7 (+WT), hTRPM7-Δ-kinase (+Δ-kinase), and hTRPM7-K1648R (+K1648R). e Peak VSOR current densities recorded at +100 mV (n = 8–26). Each column represents the mean ± SEM (vertical bar) of n samples. *P (=0.000000000069 and 0.0000000029 for KO and +Δ-kinase, respectively) <0.0001 compared to corresponding +WT data by one-way ANOVA followed by the post hoc Tukey’s test. f Representative I–V relationships of whole-cell TRPM7 currents in KO, +WT, +Δ-kinase, and +K1648R DT40 cells exposed to hypotonic (86% osmolarity) solution. The I–V curves were recorded under ramp-clamp (50-ms duration applied every 5 s at 4 mV/ms) from −100 to +100 mV in the absence (i, iii, v, vii) and presence (ii, iv, vi, viii) of 1-mM Mg2+. g Peak current densities recorded at +100 mV (blank columns) and –100 mV (filled columns) in hypotonic conditions (n = 6–19). Each column represents the mean ± SEM (vertical bar) of n samples. *P (=0.0000029 and 0.0012 at –100 mV and 0.00000000020 and 0.0000015 at +100 mV for KO and +Δ-kinase, respectively) <0.005 compared to corresponding data in +WT cells by one-way ANOVA followed by the post hoc Tukey’s test.
Fig. 9
Fig. 9. Subcellular co-localization and molecular interactions of TRPM7-WT, -Δ-kinase, and -K1648R mutants with LRRC8A after exposure to hypotonic solution.
a Confocal images of DAPI-stained HeLa cells before (DAPI) and after immunostaining with anti-GFP antibody for WT hTRPM7 or its mutant (TRPM7-EGFP: green), and those with anti-mCherry antibody for LRRC8A (LRRC8A-mCherry: red) during exposure to hypotonic solution (78% osmolarily). Scale bar, 5 μm. b The percentage of LRRC8A localization to the plasma membrane (PM) is significantly lower for the TRPM7 C-terminal defect (+Δ-kinase, hypo: *P (=0.00060) <0.001 compared to corresponding WT data by χ2 test). Observations and analyses were performed from 14 to 121 individual cells. c Co-immunoprecipitation of hTRPM7-EGFP (WT), -Δ-kinase-EGFP, or -K1648R-EGFP with LRRC8A-mCherry in HEK293T cells co-transfected with hLRRC8A-mCherry and EGFP-tagged hTRPM7 or its mutant. Immunoprecipitations (IP) with a GFP-specific antibody were subjected to western blot with an antibody to mCherry. For input, aliquots of sample are loaded on a separate gel. The data are representative of three independent experiments.

References

    1. Okada Y. Ion channels and transporters involved in cell volume regulation and sensor mechanisms. Cell Biochem. Biophys. 2004;41:233–258. doi: 10.1385/CBB:41:2:233. - DOI - PubMed
    1. Hoffmann EK, Lambert IH, Pedersen SF. Physiology of cell volume regulation in vertebrates. Physiol. Rev. 2009;89:193–277. doi: 10.1152/physrev.00037.2007. - DOI - PubMed
    1. Hazama A, Okada Y. Ca2+ sensitivity of volume-regulatory K+ and Cl− channels in cultured human epithelial cells. J. Physiol. 1988;402:687–702. doi: 10.1113/jphysiol.1988.sp017229. - DOI - PMC - PubMed
    1. Banderali U, Roy G. Activation of K+ and Cl− channels in MDCK cells during volume regulation in hypotonic media. J. Membr. Biol. 1992;126:219–234. doi: 10.1007/BF00232319. - DOI - PubMed
    1. Fatherazi S, Izutsu KT, Wellner RB, Belton CM. Hypotonically activated chloride current in HSG cells. J. Membr. Biol. 1994;142:181–193. doi: 10.1007/BF00234940. - DOI - PubMed

Publication types

LinkOut - more resources