Observational Study
. 2021 Jul;27(7):1280-1289.
doi: 10.1038/s41591-021-01386-7. Epub 2021 May 20.

CD8+ T cells contribute to survival in patients with COVID-19 and hematologic cancer

Erin M Bange #  1   2 Nicholas A Han #  1   3 Paul Wileyto  2   4 Justin Y Kim  1   3 Sigrid Gouma  5 James Robinson  2 Allison R Greenplate  3   6 Madeline A Hwee  7 Florence Porterfield  1 Olutosin Owoyemi  1 Karan Naik  1 Cathy Zheng  2 Michael Galantino  2 Ariel R Weisman  8 Caroline A G Ittner  8 Emily M Kugler  1 Amy E Baxter  3   6 Olutwatosin Oniyide  9 Roseline S Agyekum  9 Thomas G Dunn  9 Tiffanie K Jones  9 Heather M Giannini  8 Madison E Weirick  5 Christopher M McAllister  5 N Esther Babady  10   11 Anita Kumar  10 Adam J Widman  10 Susan DeWolf  10 Sawsan R Boutemine  10 Charlotte Roberts  2 Krista R Budzik  2 Susan Tollett  2 Carla Wright  2 Tara Perloff  2   12 Lova Sun  1   2 Divij Mathew  3   6 Josephine R Giles  3   6   13 Derek A Oldridge  3   14 Jennifer E Wu  3   6   13 Cécile Alanio  3   6   13 Sharon Adamski  3   6 Alfred L Garfall  1   2 Laura A Vella  15 Samuel J Kerr  2   16 Justine V Cohen  2   12 Randall A Oyer  2   16 Ryan Massa  1   2   9 Ivan P Maillard  1   2 Kara N Maxwell  1   2 John P Reilly  8 Peter G Maslak  10   11 Robert H Vonderheide  2   3   13 Jedd D Wolchok  7   10   13 Scott E Hensley  3   5 E John Wherry  3   6   13 Nuala J Meyer  3   8 Angela M DeMichele  1   2 Santosha A Vardhana  17   18   19 Ronac Mamtani  20   21 Alexander C Huang  22   23   24   25
Affiliations
Observational Study

CD8+ T cells contribute to survival in patients with COVID-19 and hematologic cancer

Erin M Bange et al. Nat Med. 2021 Jul.

Abstract

Patients with cancer have high mortality from coronavirus disease 2019 (COVID-19), and the immune parameters that dictate clinical outcomes remain unknown. In a cohort of 100 patients with cancer who were hospitalized for COVID-19, patients with hematologic cancer had higher mortality relative to patients with solid cancer. In two additional cohorts, flow cytometric and serologic analyses demonstrated that patients with solid cancer and patients without cancer had a similar immune phenotype during acute COVID-19, whereas patients with hematologic cancer had impairment of B cells and severe acute respiratory syndrome coronavirus 2 (SARS-CoV-2)-specific antibody responses. Despite the impaired humoral immunity and high mortality in patients with hematologic cancer who also have COVID-19, those with a greater number of CD8 T cells had improved survival, including those treated with anti-CD20 therapy. Furthermore, 77% of patients with hematologic cancer had detectable SARS-CoV-2-specific T cell responses. Thus, CD8 T cells might influence recovery from COVID-19 when humoral immunity is deficient. These observations suggest that CD8 T cell responses to vaccination might provide protection in patients with hematologic cancer even in the setting of limited humoral responses.


Figures

Extended Data Fig. 1 |
Extended Data Fig. 1 |. Inflammatory markers, blood cell counts, and viral load in cancer patients with COVID-19.
Clinical laboratory values for (a) inflammatory markers and (b) cell counts in solid (n=62) and hematologic (n=21) cancer patients. Repeat SARS-CoV-2 RT-PCR testing results (c) from first positive test to last performed test and (d) from first positive test to last positive test. (All) Significance determined by two-sided Mann Whitney test.
Extended Data Fig. 2 |
Extended Data Fig. 2 |. SARS-CoV-2 antibody levels in cancer patients with COVID-19.
(a) Relative levels of SARS-CoV-2 IgG (p=0.02) and IgM (p=0.0008) in non-cancer (n=108) and cancer (n=21) patients. (b) Relative IgG levels in cancer patients. Each dot represents a cancer patient (Heme: Red; Solid: Yellow). (All) Significance determined by two-sided Mann Whitney test: *p<0.05, ***p<0.001. Median and 95% CI shown.
Extended Data Fig. 3 |
Extended Data Fig. 3 |. Dimensionality reduction and EMD clustering of MESSI cohort.
(a) UMAP projections of lymphocytes with indicated protein expression. (b) Frequencies of CD19+, CD3+, CD3+CD8+, and CD3+CD4+ cells of patients in each EMD cluster (Cluster 1 n=7; Cluster 2 n=16; Cluster 3 n=6; Cluster 4 n=10; Cluster 5 n=5). (All) Median and 95% CI shown.
Extended Data Fig. 4 |
Extended Data Fig. 4 |. Cellular phenotyping of COVID-19 patients with cancer.
(a) Frequencies of circulating T follicular helper cells (cTfh), plasmablasts (No Cancer vs. Heme, p=0.0001; Solid vs. Heme, p=0.006), and CD138 expression on plasmablasts (HD n=33; non-cancer n=108; solid cancer n=7; heme cancer n=3). (b) UMAP projection of non-naïve CD8 T cells with indicated protein expression. (c) Heatmap showing expression patterns of various markers, stratified by FlowSOM clusters. Heat scale calculated as column z-score of MFI. (d) Frequencies of CD8 subsets: naive (CD45RA+CD27+CCR7+), central memory (CD45RACD27+CCR7+), transition memory (CD45RA-CD27+CCR7-) (p<0.0001), effector memory (CD45RA-CD27-CCR7-), and TEMRA (CD45RA+CD27-CCR7-) (p=0.002) (HD n=33; non-cancer n=108; cancer n=9). (e) (Left) HLA-DR and CD38 co-expression in concatenated activated clusters (3, 4, and 5) and associated UMAP localization. (Right) Frequency of clusters 3 (p=0.03) and 5 (HD n=30; non-cancer n=110; solid-cancer n=8). (All) Significance determined by two-sided Mann Whitney test: *p<0.05, **p<0.01, ***p<0.001, and ****p<0.0001. Median and 95% CI shown.
Extended Data Fig. 5 |
Extended Data Fig. 5 |. Cellular, serologic, and clinical features in solid and hematologic cancer patients with COVID-19.
(a) Absolute counts of CD4 (Remission vs. Heme, p=0.01; Remission vs. Solid, p=0.02), CD8 (p=0.02), and CD19 (Remission vs. Heme, p=0.008; Solid vs. Heme, p=0.0003) expression in remission (n=11), solid cancer (n=23), and hematologic cancer (n=41) patients. (b) Relative levels of SARS-CoV-2 IgG (p=0.003) and IgM (p=0.0007) in solid (n=11) and hematologic cancer (n=14) patients. (c) Severity (NIH ordinal scale for COVID-19 clinical severity) and RT-PCR cycle threshold (remission n=9; solid n=25; heme n=28) (Lower Ct: Higher viral load). (d) NIH ordinal scale for COVID-19 clinical severity. (All) Significance determined by two-sided Mann Whitney test: *p<0.05, **p<0.01, ***p<0.001. Median and 95% CI shown.
Extended Data Fig. 6 |
Extended Data Fig. 6 |. Dimensionality reduction and EMD clustering of MSKCC cohort.
(a) UMAP projections of lymphocytes with indicated protein expression. (b) Absolute counts of CD19+, CD3+, CD3+CD8+, and CD3+CD4+ cells of patients in each EMD cluster (Cluster 1 n=18; Cluster 2 n=6; Cluster 4 n=26; Cluster 5 n=7). (All) Median and 95% CI shown.
Extended Data Fig. 7 |
Extended Data Fig. 7 |. EMD Cluster 4 drives differences in mortality between hematologic and solid cancer patients.
(a) EMD cluster distributions of heme and solid cancer patients. (b) Number of patients with hematologic, solid, and remission cancer status within each EMD cluster. (c) Mortality of patients within each EMD cluster for hematologic and solid cancers. (d) RT-PCR cycle threshold of solid and heme cancer patients in EMD cluster 4 (solid n=11; heme n=11) (p=0.02). (e) Absolute CD8 and CD4 T cell counts for subjects in EMD cluster 4 stratified by solid (n=11) and heme (n=13) cancer. (f) Global UMAP projections of lymphocytes for subjects in EMD cluster 4: (Left) Hematologic cancer; (Middle) Solid cancer. (Right) Absolute B cell counts for subjects in EMD cluster 4 stratified by solid (n=11) and heme (n=13) cancer (p=0.004). (All) Significance determined by two-sided Mann Whitney test: *p<0.05, **p<0.01. Median and 95% CI shown.
Extended Data Fig. 8 |
Extended Data Fig. 8 |. Effect of cancer treatment on T cell differentiation in COVID-19.
(a) Absolute counts of CD4, CD8, and CD19 expressing cells. Frequencies of (b) CD4 and (c) CD8 T cell subsets in cancer patients treated with immune checkpoint blockade therapies, chemotherapies, and B cell depleting therapies. Frequencies of (d) CD4 and (e) CD8 T cell subsets in heme cancer patients with and without COVID-19, and with and without αCD20. Naive (CD45RA+CCR7+), CM (CD45RA-CCR7+), EM (CD45RA-CCR7-), TEMRA (CD45RA+CCR7-). (All) Remission n=11, obs n=12, chemo only n=9, solid ICB n=7, heme αCD20 n=10, non-COVID heme no tx n=5, and non-COVID heme αCD20 n=5. Significance determined by two-sided Mann Whitney test. Median and 95% CI shown.
Extended Data Fig. 9 |
Extended Data Fig. 9 |. Association of mortality with cell counts and viral load.
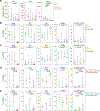
(a) Mortality, severity, and RT-PCR cycle threshold stratified by cancer treatment (remission n=9; solid obs n=6; solid tx n=19; heme obs n=5; heme chemo n=4; heme αCD20 n=10). Severity assessed with NIH ordinal scale for COVID-19 clinical severity. (b) Recent cancer treatment of patients in each EMD cluster. (c) Mortality of patients treated with B cell depleting therapy in EMD cluster 1 (red) and EMD cluster 4 (blue). (d) RT-PCR cycle threshold of patients treated with αCD20 therapy (alive n=7; dead n=3). (e) Absolute counts of CD8, CD4, and CD19 (p=0.004) cells in solid cancer patients (alive n=16; dead n=7). (All) Significance determined by two-sided Mann Whitney test: **p<0.01. Median and 95% CI shown.
Extended Data Fig. 10 |
Extended Data Fig. 10 |. EBV and SARS-CoV-2 ELISpot in COVID-19 cancer patients.
ELISpot was performed after stimulation of PBMC with no peptide, EBV, and SARS-CoV-2 peptide pools. (a) IFN-γ (No Peptide vs. COVID, p=0.003) and IL-2 (No Peptide vs. COVID, p=0.03; EBV vs. COVID, p=0.02) spot forming units (SFU) per million PBMC in heme cancer patients (n=13). Significance determined by Wilcoxon test. (b) IFN-γ SFU per million PBMC in heme cancer patients treated with (n=8) and without (n=5) αCD20 with no-peptide background condition subtracted. (c) IFN-γ and IL-2 SFU between solid (n=10) and heme (n=13) cancer patients. Simple linear regression between IFN-γ SFU per million cells and percent activated CD4 (d) and CD8 (e) T cells in alive (n=8) and dead (n=5) heme cancer patients. (All) Significance determined by two-sided Mann Whitney test. *p<0.05, **p<0.01. Median and 95% CI shown.
Fig. 1 |
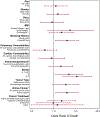
Fig. 1 |. Univariate analysis of potential risk factors in COVID-19 mortality.
Data are presented as odds ratios with 95% CI. (ref) Reference population; +BMI 18.5–24.9; ++BMI<18.5; +++BMI>25; #Exposure to immunosuppressive medications not including cancer treatment; ^Diagnosis or treatment within 6 months; *Single agent immunotherapy, targeted therapy, monoclonal antibodies.
Fig. 2 |
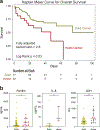
Fig. 2 |. Hematologic cancer is an independent risk factor for COVID-19 related mortality.
(a) Kaplan Meier curve for COVID-19 survival of patients with solid (n=77) and hematologic (n=22) cancer. Cox regression-computed hazard ratio for mortality in hematologic vs solid cancer, adjusted for age, gender, smoking status, active cancer status, and ECOG performance status. (b) Ferritin (p=0.036), IL-6 (p=0.034), and LDH (p=0.001) in solid (n=62) and hematologic (n=15) cancer hospitalized for COVID-19. (All) Significance determined by two-sided Mann Whitney test: *p<0.05, **p<0.01. Median and 95% CI shown.
Fig. 3 |
Fig. 3 |. High dimensional analyses reveal immune phenotypes associated with mortality and distinct phenotypes between solid and hematologic cancers.
(a) Demographic and mortality data for MESSI cohort at Penn. (b) Relative levels of SARS-CoV-2 IgG (No Cancer vs. Heme, p=0.001; Solid vs. Heme, p=0.007) and IgM (No Cancer vs. Heme, p=0.003; No Cancer vs. Solid, p=0.03); solid (n=14) and hematologic (n=7) cancer patients and non-cancer patients (n=108). (c) (Left) Global UMAP projection of lymphocyte populations for all 45 patients pooled. (Right) Hierarchical clustering of Earth Mover’s Distance (EMD) using Pearson correlation, calculated pairwise for lymphocyte populations. (d) UMAP projection of concatenated lymphocyte populations for each EMD cluster. (Yellow: High Density; Black: Low Density) (e) Heatmap showing expression patterns of various markers, stratified by EMD cluster. Heat scale calculated as column z-score of MFI. (f) Mortality (p=0.02), disease severity, and SARS-CoV-2 antibody data, stratified by EMD cluster (Cluster 5 n=5; Cluster 1,2,3,4 n=40). Mortality significance determined by Pearson Chi Square test. Severity assessed with NIH ordinal scale for COVID-19 clinical severity (1: Death; 8: Normal Activity). (g) UMAP projections of concatenated lymphocyte populations for solid cancer, hematologic cancer, and non-cancer patients. (h) CD8, CD4 (No Cancer vs. Heme, p=0.003; Solid vs. Heme, p=0.01) and B cell (No Cancer vs. Heme, p=0.008; No Cancer vs. Solid, p=0.03; Solid vs. Heme, p=0.02) frequencies in healthy donors (n=33), non-cancer (n=108), solid cancer (n=7), and heme cancer (n=4). (i) UMAP projection of non-naive CD8 T cell clusters identified by FlowSOM. (j) (Top) UMAP projections of non-naïve CD8 T cells for non-cancer and cancer patients. (Bottom) UMAP projections indicating HLA-DR and CD38 protein expression on non-naive CD8 T cells for all patients pooled. (k) Frequency of activated FlowSOM clusters in HD (n=30), non-cancer (n=110), and cancer patients (n=8) (p=0.03). (l) Representative flow plots and frequency of HLA-DR and CD38 co-expression in HD (n=30), non-cancer (n=110), solid cancer (n=7), and hematologic cancer (n=3) patients (gated on non-naïve CD8) (No Cancer vs. Heme, p<0.0001; Solid vs. Heme, p=0.02). (All) Significance determined by two-sided Mann Whitney test: *p<0.05, **p<0.01, ***p<0.001, and ****p<0.0001. Median and 95% CI shown.
Fig. 4 |
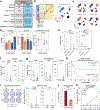
Fig. 4 |. CD8 T cell counts associated with survival in hematologic cancer patients with COVID-19.
(a) Demographic and mortality data of MSKCC cohort. (b) (Left) Hierarchical clustering of Earth Mover’s Distance (EMD) using Pearson correlation, calculated pairwise for lymphocyte populations. (Right) Global UMAP projection of lymphocyte populations pooled. (c) UMAP projection of concatenated lymphocyte populations for each EMD cluster. (Yellow: High Density; Black: Low Density) (d) Mortality (Cluster 5 n=7; Cluster 1,2,4 n=50), severity, and RT-PCR cycle threshold (Cluster 1 n=14; Cluster 2 n=5; Cluster 4 n=24; Cluster 5 n=6) (Lower Ct: Higher viral load) stratified by EMD cluster. Mortality significance determined by Pearson Chi Square test. (e) Relative levels of SARS-CoV-2 IgG and IgM of patients with recent cancer treatments (solid tx n=9; heme aCD20 n=7; heme other tx n=5). (f) Absolute CD8 and CD4 T cell counts in patients treated with B cell depleting therapy (alive n=7; dead n=4). (g) Absolute CD8 (p=0.01) and CD4 T cell counts and B cell (p=0.003) counts in hematologic cancer patients (alive n=17; dead n=18). (h) Kaplan-Meier curve for survival in hematologic cancer patients stratified by CD8 T cell counts (threshold = 55.9; log-rank hazard ratio) (>=55.9 n=28; <55.9 n=13). CD8 count threshold determined by Classification and Regression Tree (CART) analysis. (i) (Left) Representative ELISpot plates from two patients after stimulation with no peptide, EBV, and SARS-CoV-2 consensus peptide pools. (Right) IFN-γ and IL-2 (p=0.02) spot forming units (SFU) per million PBMCs in heme cancer patients (n=13). Significance determined by two-sided Wilcoxon test. (j) Proportion of heme cancer patients with detectable IFN-γ SFU, after background subtraction (no peptide). Significance determined by Chi Square test. (k) Simple linear regression between IFN-γ SFU and percent activated CD8 T cells in heme cancer patients that recovered from COVID-19 (n=6). (All) Significance determined by two-sided Mann Whitney test: *p<0.05, **p<0.01, ***p<0.001, and ****p<0.0001. Median and 95% CI shown.

Update of

  • CD8 T cells compensate for impaired humoral immunity in COVID-19 patients with hematologic cancer.
    Bange EM, Han NA, Wileyto P, Kim JY, Gouma S, Robinson J, Greenplate AR, Porterfield F, Owoyemi O, Naik K, Zheng C, Galantino M, Weisman AR, Ittner CAG, Kugler EM, Baxter AE, Oniyide O, Agyekum RS, Dunn TG, Jones TK, Giannini HM, Weirick ME, McAllister CM, Babady NE, Kumar A, Widman AJ, DeWolf S, Boutemine SR, Roberts C, Budzik KR, Tollett S, Wright C, Perloff T, Sun L, Mathew D, Giles JR, Oldridge DA, Wu JE, Alanio C, Adamski S, Garfall AL, Vella L, Kerr SJ, Cohen JV, Oyer RA, Massa R, Maillard IP; UPenn COVID Processing Unit; Maxwell KN, Reilly JP, Maslak PG, Vonderheide RH, Wolchok JD, Hensley SE, Wherry EJ, Meyer N, DeMichele AM, Vardhana SA, Mamtani R, Huang AC. Bange EM, et al. Res Sq [Preprint]. 2021 Feb 2:rs.3.rs-162289. doi: 10.21203/rs.3.rs-162289/v1. Res Sq. 2021. Update in: Nat Med. 2021 Jul;27(7):1280-1289. doi: 10.1038/s41591-021-01386-7. PMID: 33564756 Free PMC article. Updated. Preprint.

References

    1. Blanco-Melo D et al. Imbalanced Host Response to SARS-CoV-2 Drives Development of COVID-19. Cell 181, 1036–1045.e9 (2020). - PMC - PubMed
    1. Hadjadj J et al. Impaired type I interferon activity and inflammatory responses in severe COVID-19 patients. Science 369, 718–724 (2020). - PMC - PubMed
    1. Arunachalam PS et al. Systems biological assessment of immunity to mild versus severe COVID-19 infection in humans. Science 369, 1210–1220 (2020). - PMC - PubMed
    1. Yale IMPACT Team et al. Longitudinal analyses reveal immunological misfiring in severe COVID-19. Nature 584, 463–469 (2020). - PMC - PubMed
    1. Lee JS et al. Immunophenotyping of COVID-19 and influenza highlights the role of type I interferons in development of severe COVID-19. Sci. Immunol. 5, (2020). - PMC - PubMed

Publication types

MeSH terms

Substances