. 2021 May 4:12:641692.
doi: 10.3389/fimmu.2021.641692. eCollection 2021.

Continuous MYD88 Activation Is Associated With Expansion and Then Transformation of IgM Differentiating Plasma Cells

Affiliations

Continuous MYD88 Activation Is Associated With Expansion and Then Transformation of IgM Differentiating Plasma Cells

Catherine Ouk et al. Front Immunol. .

Abstract

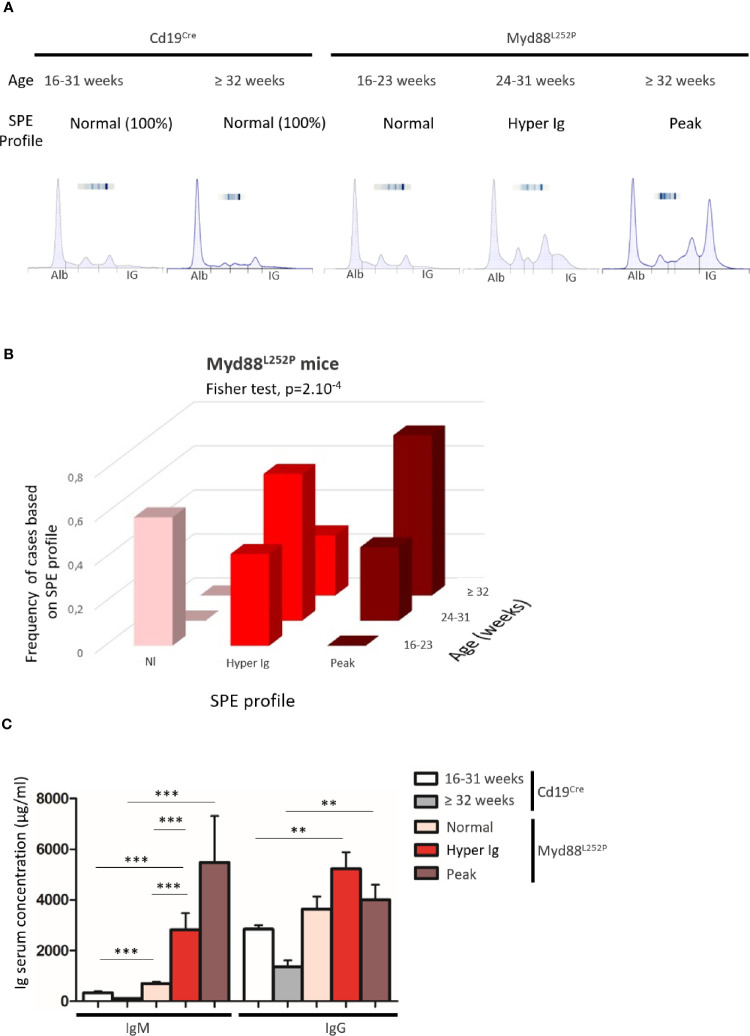
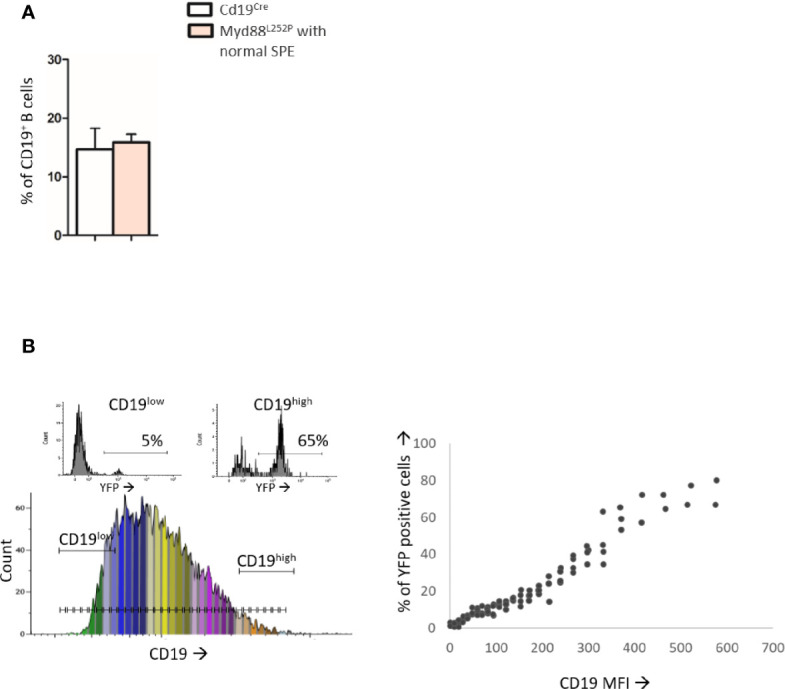
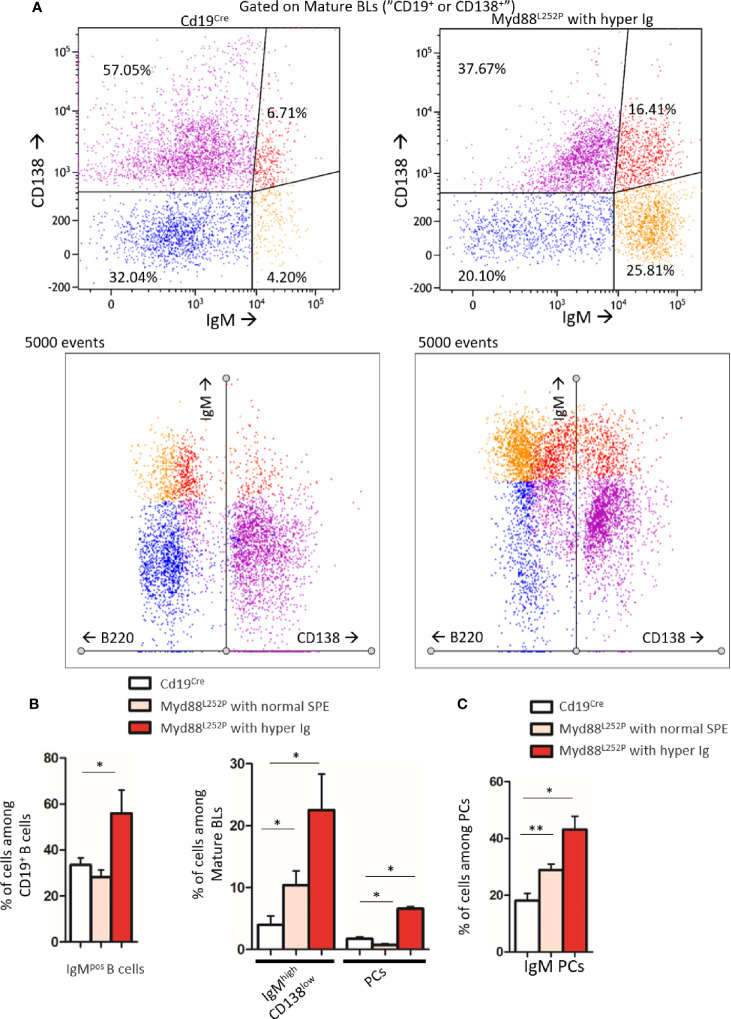
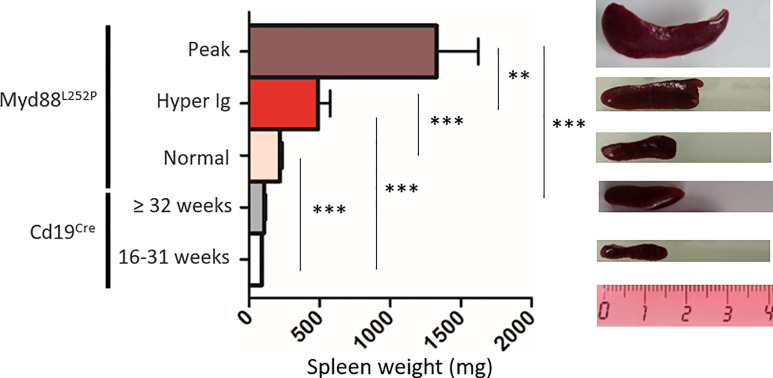
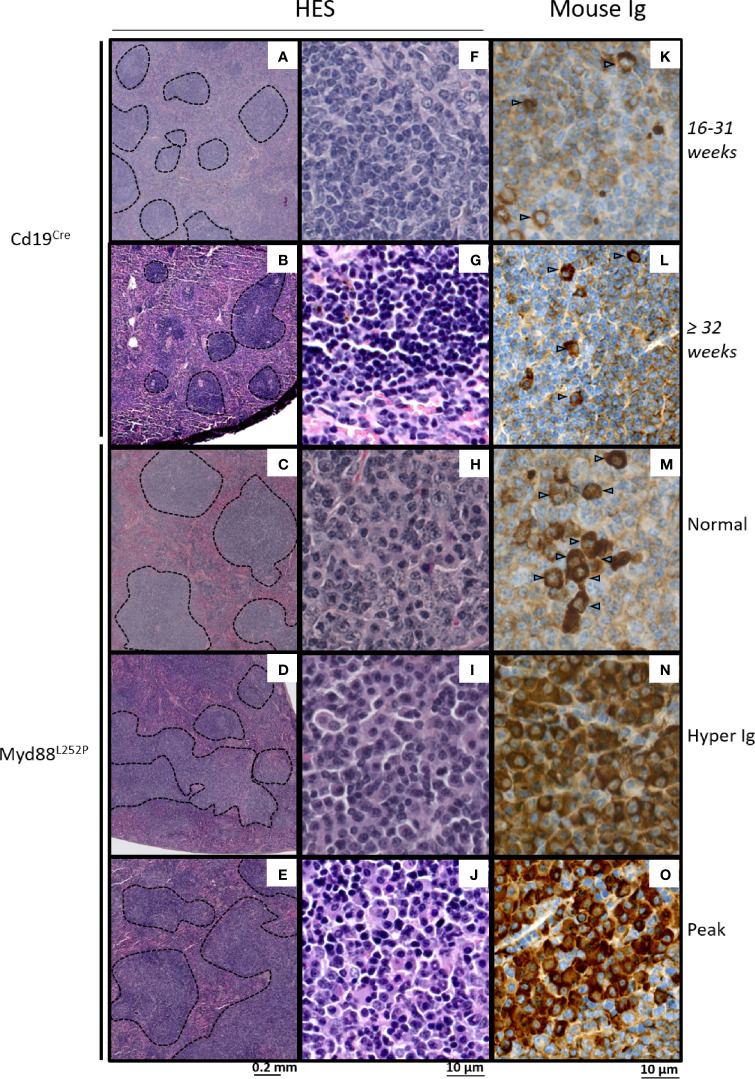
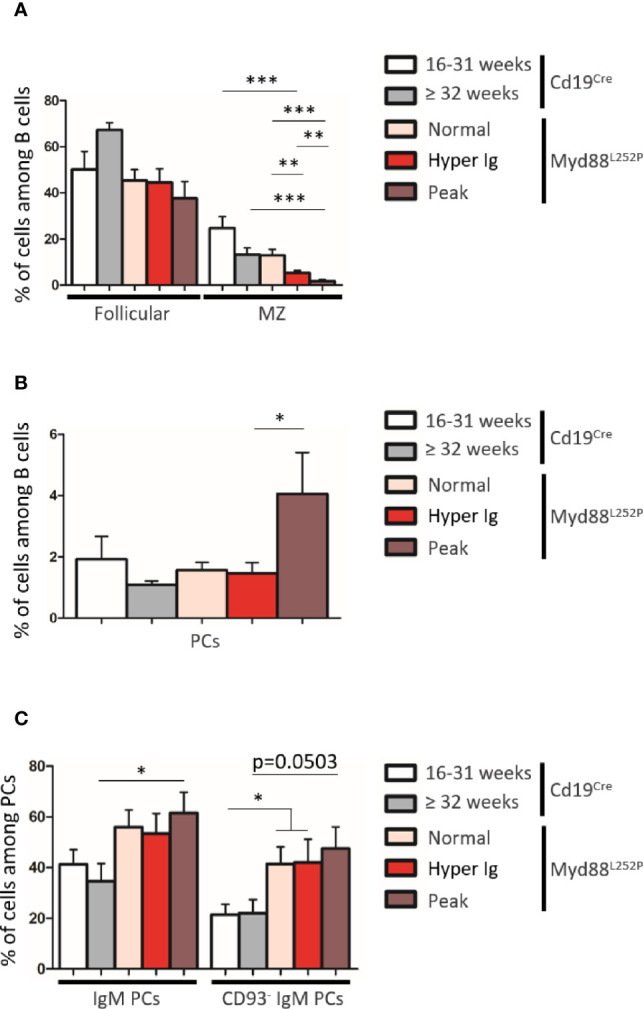
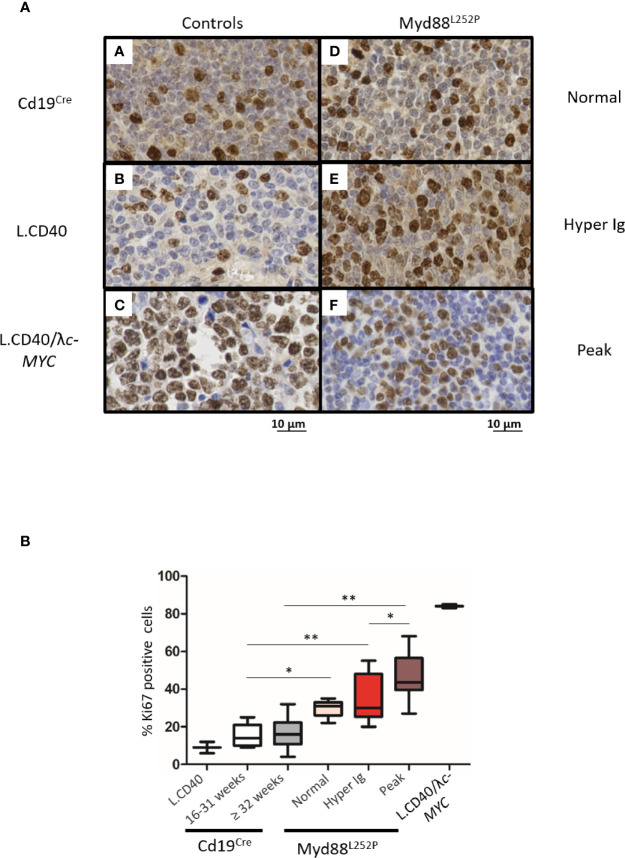
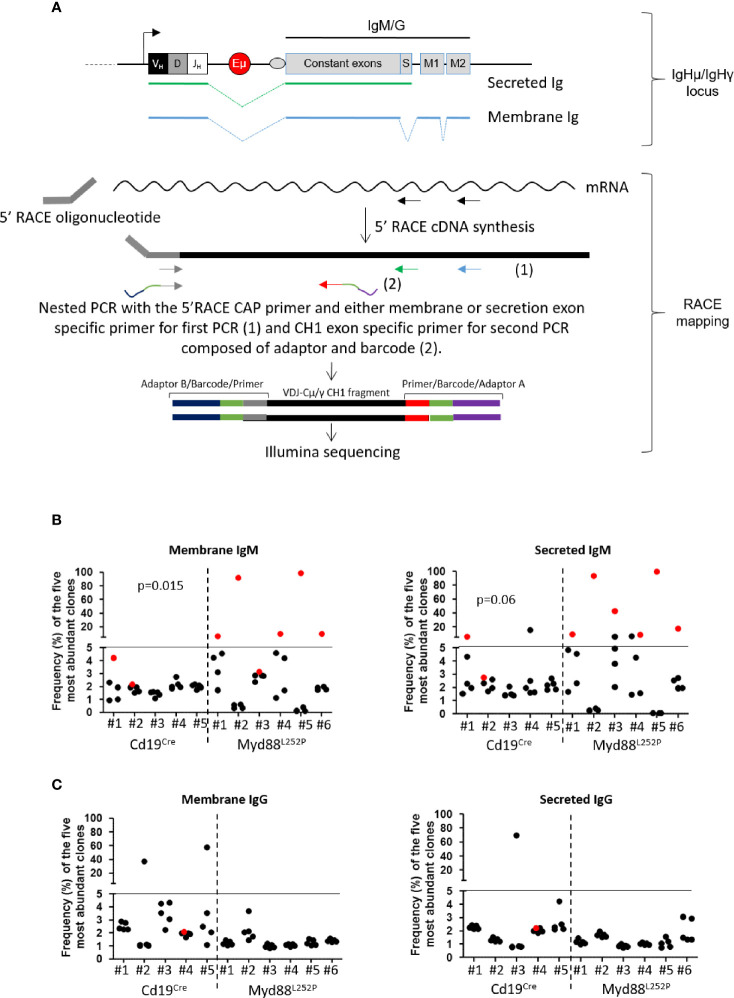
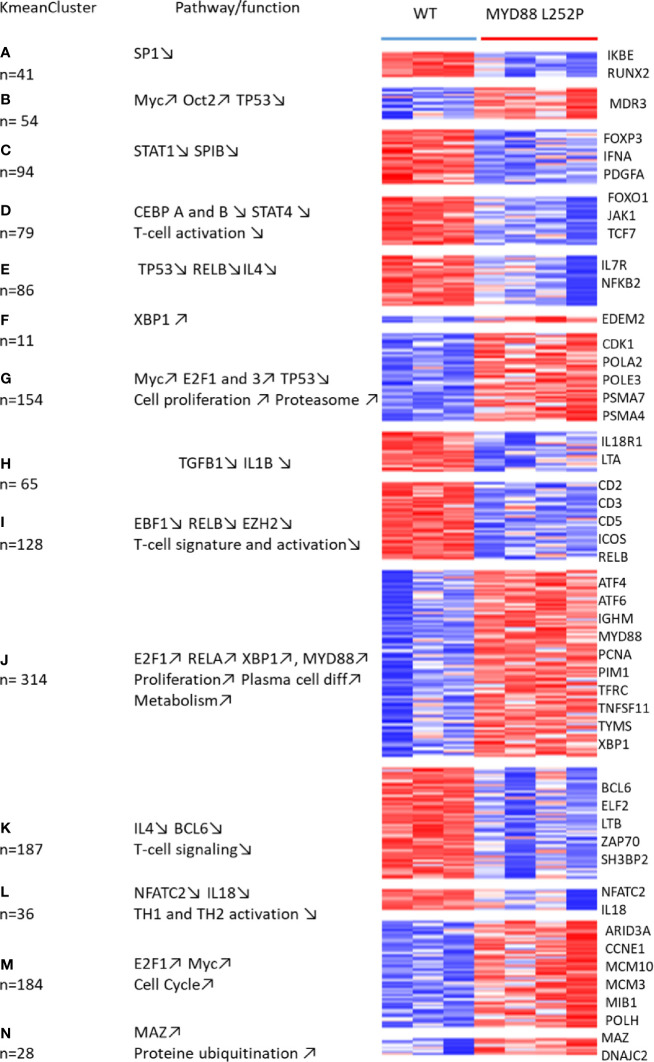
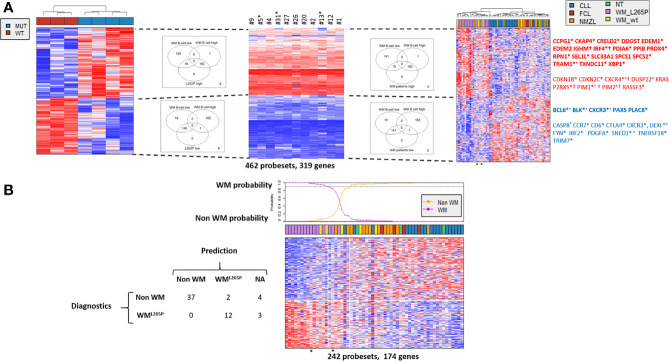
Activating mutations of MYD88 (MYD88L265P being the far most frequent) are found in most cases of Waldenström macroglobulinemia (WM) as well as in various aggressive B-cell lymphoma entities with features of plasma cell (PC) differentiation, such as activated B-cell type diffuse large B-cell lymphoma (DLBCL). To understand how MYD88 activation exerts its transformation potential, we developed a new mouse model in which the MYD88L252P protein, the murine ortholog of human MYD88L265P, is continuously expressed in CD19 positive B-cells together with the Yellow Fluorescent Protein (Myd88L252P mice). In bone marrow, IgM B and plasma cells were expanded with a CD138 expression continuum from IgMhigh CD138low to IgMlow CD138high cells and the progressive loss of the B220 marker. Serum protein electrophoresis (SPE) longitudinal analysis of 40 Myd88L252P mice (16 to 56 weeks old) demonstrated that ageing was first associated with serum polyclonal hyper gammaglobulinemia (hyper Ig) and followed by a monoclonal immunoglobulin (Ig) peak related to a progressive increase in IgM serum levels. All Myd88L252P mice exhibited spleen enlargement which was directly correlated with the SPE profile and was maximal for monoclonal Ig peaks. Myd88L252P mice exhibited very early increased IgM PC differentiation. Most likely due to an early increase in the Ki67 proliferation index, IgM lymphoplasmacytic (LP) and plasma cells continuously expanded with age being first associated with hyper Ig and then with monoclonal Ig peak. This peak was consistently associated with a spleen LP-like B-cell lymphoma. Clonal expression of both membrane and secreted µ chain isoforms was demonstrated at the mRNA level by high throughput sequencing. The Myd88L252P tumor transcriptomic signature identified both proliferation and canonical NF-κB p65/RelA activation. Comparison with MYD88L265P WM showed that Myd88L252P tumors also shared the typical lymphoplasmacytic transcriptomic signature of WM bone marrow purified tumor B-cells. Altogether these results demonstrate for the first time that continuous MYD88 activation is specifically associated with clonal transformation of differentiating IgM B-cells. Since MYD88L252P targets the IgM PC differentiation continuum, it provides an interesting preclinical model for development of new therapeutic approaches to both WM and aggressive MYD88 associated DLBCLs.

Keywords: B-cell lymphoma; IgM secretion; MYD88 L265P mutation; lymphoplasmacytic lymphoma/Waldenstrom’s macroglobulinemia; monoclonal Ig peak; plasma cell.


Conflict of interest statement

The authors declare that the research was conducted in the absence of any commercial or financial relationships that could be construed as a potential conflict of interest.

Figures

Figure 1
Figure 1
Myd88L252P transgenic mice exhibited serum IgM hypergammaglobulinemia and then monoclonal IgM peaks when ageing. (A) Examples of serum protein electrophoresis of Cd19Cre mice (respectively 16 and 36 weeks-old) and three Myd88L252P mice (16, 24 and 36 week-old) with normal, polyclonal hypergammaglobulinemia (hyper Ig) and monoclonal Ig peaks respectively. (B) Frequencies of cases according to SPE profile and age for Myd88L252P mice (n = 40). (C) IgM and IgG serum levels in Cd19Cre and Myd88L252P mice. For Cd19Cre (n = 15), Myd88L252P (n = 36). Results are expressed as the mean ± SEM. Mann Whitney test p-value < 0.01 and < 0.001 are symbolized by ** and *** respectively.
Figure 2
Figure 2
Analysis of B-cell differentiation in bone marrow from 16 week-old Cd19Cre and Myd88L252P mice. (A): Percentage of CD19pos and/or B220pos B-cells in bone marrow from 16 week-old Cd19Cre (n =9) and Myd88L252P mice (n = 9). Results are expressed as the mean ± SEM. (B): Flow cytometry analysis of the transgene expression according to CD19 expression levels (n=9). Left panel: CD19 monoparametric histogram sliced according to CD19 MFI intervals. For each CD19 MFI interval, the percentage of bone marrow B220pos YFP positive cells was noted. Two examples of YFP monoparametric histograms are presented in the upper part, one for CD19low B220pos B-cells and one for CD19high B220pos B-cells with their respective percentages of YFPpos cells Right panel: percentage of YFPpos B220pos B-cells (Y axis) according to CD19 MFI (X axis).
Figure 3
Figure 3
Increase in the IgM PC compartment in bone marrow from Myd88L252P transgenic mice. (A) Example of bi and triple parametric flow cytometry histograms gated on mature B or plasma cells for expression of IgM, B220 and CD138 for Cd19Cre and Myd88L252P mice (left and right panels respectively). Upper panels: IgMlow or neg CD138neg, IgMhigh CD138low, IgMhigh CD138high and IgMlow CD138high cells are colored in blue, orange, red and purple respectively using a hinged quadstat of the Kaluza software and an IgM/CD138 2-dimensional plot. The hinged quadstat was set-up for one Cd19Cre mouse. Lower panels: triple parametric histograms using the radar function of the Kaluza software. Note the CD138 expression continuum on Myd88L252P bone marrow B-cells that correlated with a progressive decrease in B220 expression. This CD138 expression continuum was virtually absent in Cd19Cre mice. (B) Percentages of total IgMpos B cells and IgMhigh CD138low pre PCs and B220low CD138high PCs in bone marrow from 16-24 week-old Cd19Cre (n =6) and Myd88L252P mice with normal SPE or hyper Ig (n = 6 and n = 3 respectively). Results are shown as the mean ± SEM. Mann Whitney test p-value < 0.05 is symbolized by *. (C) Percentages of IgMpos CD138high PCs among total PCs in bone marrow from 16-31 week-old Cd19Cre (n =6) and Myd88L252P mice with normal SPE or hyper Ig (n = 6 and n = 3 respectively). Results are shown as the mean ± SEM. Mann Whitney test p-value < 0.05 and < 0.01 are symbolized by * and ** respectively.
Figure 4
Figure 4
Myd88L252P mice exhibited a progressively increasing splenomegaly consistently related to the SPE profile. Spleen size of Cd19Cre and Myd88L252P age-paired mice. Myd88L252P mice were sacrificed together with at least one Cd19Cre mouse of the same age. Left panel: distribution of spleen weights; right panel: examples of spleen macroscopy (Cd19Cre n = 9 for 16-31 weeks-old and n = 16 for ≥ 32 weeks; Myd88L252P with normal SPE: n = 9; with hyper Ig: n = 13; with Ig peak: n = 19). Results are given as the mean ± SEM. Mann Whitney test p-value < 0.01 and p-value < 0.001 are symbolized by ** and *** respectively.
Figure 5
Figure 5
Morphological and immunophenotypic plasma cell engagement of Myd88L252P tumors. Hematein eosin morphological aspect (A–J) and intracytoplasmic Ig labeling (K–O) of Cd19Cre and Myd88L252P spleens: one 16-31 week-old Cd19Cre (A, F, K), one ≥ 32 week-old Cd19Cre (B, G, L) and three Myd88L252P (C, H, M) for Normal group, (D, I, N) for Hyper Ig group and E, J, O for Peak group) mice are shown. Panels (A–E) at low magnification, Myd88L252P tumors often exhibited a nodular pattern (C–E). Panels (F–J): at high magnification, most Myd88L252P tumors had small B-cell aspects with marked lymphoplasmacytic engagement (panels H–J). Panels (K–O) Myd88L252P tumors with a lymphoplasmacytic aspect exhibited marked plasma cell differentiation as revealed by the presence of intracytoplasmic Ig in numerous cells (arrows) with various labeling intensities (M–O).
Figure 6
Figure 6
B-cell differentiation in spleens from Cd19Cre and Myd88L252P mice. (A) Percentage of Follicular B cells (CD21pos CD23high) and marginal zone (MZ) B cells (CD21high CD23pos). (B) Percentage of plasma cells (PCs, B220low CD138high). (C) Percentage of IgM+ PCs and CD93neg IgM PCs. Myd88L252P mice (with normal SPE: n = 7; with hyper Ig: n = 10; with Ig peak: n = 9) were compared to Cd19Cre mice LMCs (16-31 week and ≥ 32 week-old mice; n = 9 for each group) Results are presented as the mean ± SEM. Mann Whitney test p-value < 0.05, p-value < 0.01 and p-value < 0.001 are symbolized by *, ** and ***.
Figure 7
Figure 7
Intermediate increase in Myd88L252P tumor proliferation rate. (A) Examples of Ki67 labeling in spleen sections from three controls (panels A-C) and three Myd88L252P mice (panels D-F, n=28). Controls were Cd19Cre LMCs (panel A, n = 5 for 16-31 week-old mice and n = 8 for ≥ 32 week-old mice), L.CD40 mice (panel B) with indolent splenic lymphomas of marginal zone B-cells (n=2), as well as L.CD40/λc-Myc mice (panel C, n=2) with a ABC-DLBCL lymphomas (24, 28). The three Myd88L252P tumors (panels D-F) are one representative example of each group defined according the SPE profile (normal n = 5, hyper Ig n = 8 and Ig peak n = 15). Here, L.CD40 mice were used as a model of indolent B-cell lymphoma with a low proliferation index while L.CD40/λc-Myc mice were a model of aggressive B-cell lymphoma with a high proliferation index. (B) Quantification of Ki67 labeling. Box plots represent the median and quartile of percentages of Ki67 positive cells. Mann Whitney test p-value < 0.05, p-value < 0.01 are symbolized by * and ** respectively.
Figure 8
Figure 8
µ and γ heavy chain mRNA clonal abundance: (A) RACE PCR technique quantifying clonal mRNA abundance of membrane and secreted forms of mouse µ and γ heavy chains. Ighμ/Ighγ locus (upper panel): Igh locus with variable regions (VDJ), the enhancer Eµ and constant genes (for IgM or IgG). Box “S” represents the secreted exon used for the secreted form of Ig, “M1 and M2” represent the membrane exons for the membrane form of Ig. Green or blue dotted lines show RNA splicing respectively for secreted and membrane Ig. RACE mapping (lower panel): 5’RACE PCR followed by preparation of libraries for Illumina sequencing. First, we amplified cDNA between the primer specific for the membrane or the secreted form (black arrows) and the 5’RACE oligonucleotide. Amplicons for Illumina sequencing were obtained after two nested PCRs; the first with the 5’ Race CAP primer and either membrane (blue arrow) or secretion (green arrow) exon specific primer, and the second with the same 5’ primer and a CH1 exon specific primer (grey arrow). For sequencing, forward (grey) and reverse (red) primers used for the second PCR contained adaptors (blue and purple) and a barcode (orange); each barcode sequence was specific for one sample only. (B, C) Relative frequency of the five most abundant mRNA clones coding for membrane (left) and secreted (right) forms of µ (B) and γ (C) heavy chains for Cd19Cre (n = 5) and Myd88L252P (n = 6) mice. The most abundant clones are highlighted in red when VDJ sequences of the dominant membrane and secreted clones were identical. Myd88L252P mice exhibited IgM but not IgG clonal expansion with expression of both secreted and membrane form of the µ chain. Wilcoxon’s test p-value are given in the figure.
Figure 9
Figure 9
Whole transcriptome analysis of Cd19Cre and Myd88L252P mice: total mRNA was extracted from whole spleen tissues. Gene expression profiles were obtained using the MoGene-2_1-st-v1 Affymetrix chip. mRNA transcripts (3236) were selected to be differentially expressed using the Limma R package. Expressed genes that were too heterogeneous were eliminated, resulting in a final selection of 1515 genes. These genes were segregated into 40 Kmean clusters. The closest Kmean clusters were merged 2 by 2 according to their proximity by principal component analysis of the mean vectors. This was repeated until maximization of the absolute value of Chi2 (29). This resulted in 14 aggregated clusters. Functional annotation of the aggregated Kmean clusters was performed using the Ingenuity Pathway Analysis (IPA) Software. Annotated heatmap of the 1515 genes are segregated into the 14 aggregated clusters. Left: the aggregated Kmean clusters with the corresponding number of genes; middle: main pathways and or function identified with the IPA software; right: some relevant genes.
Figure 10
Figure 10
Comparison of gene expression profile (GEP) of Myd88L252P mice and patients with WM or other indolent B-cell NHL. Affymetrix differential gene expression profiles (GEP) between four Myd88L252P mice (MUT, n=4) and three Cd19Cre mice (WT, n=3) were compared to the Affymetrix GEP of purified bone marrow tumor B-cells from 11 WM patients with the MYD88L265P mutation, resulting in selection of 462 probesets (319 genes). This selection was used on the Affymetrix transcriptome of an independent series of lymph node biopsies from 58 patients: 19 MYD88wt chronic lymphocytic leukemias (CLL), 15 MYD88L265P WM (WM_L265P), 12 MYD88wt nodal marginal zone lymphomas (NMZL), 5 MYD88wt WM with IgM peaks (WM_WT), 4 follicular lymphomas (FCL) and 3 patients with follicular hyperplasia (NT). (A) Hierarchical clustering and heatmap of the 462 selected probesets for mice (left), purified bone marrow MYD88L265P WM B-cells (middle) and lymph nodes (right). Down and up-regulated genes are in blue and red respectively. Branches of down and up regulated genes in Myd88L252P mice, MYD88L265P WM bone marrow B-cells and MYD88L265P WM lymph nodes are delineated by dashed lines. Venn diagrams of the intersections between the branches are shown, highlighting the consistency between branches across the different clustering. Some genes of interest are noted on the right. In bold are those of the plasma cell signature; *: genes in the predictor (see Figure 7B ); +: genes reported by Hunter et al. in WM (30); † : genes of the ABC/GC DLBCL signature (31). (B): Informativeness of MYD88L265P WM diagnosis using the 462 selected probesets defined in Figure 8A . The 462 probesets defined from MYD88L252P mice and bone marrow tumor B-cells from MYD88L265P WM patients were used to predict MYD88L265P WM diagnosis (WML265P versus non WM) from other lymphomas within the series of 58 lymph node biopsies. Probabilities that each sample belongs to WML265P versus non WM group are indicated. The WML265P versus non WM or not attributed (NA) assignment is shown on the left.

References

    1. Preud’homme JL, Seligmann M. Immunoglobulins on the Surface of Lymphoid Cells in Waldenström’s Macroglobulinemia. J Clin Invest (1972) 51(3):701−5. 10.1172/JCI106858 - DOI - PMC - PubMed
    1. Ghobrial IM. Are You Sure This is Waldenstrom Macroglobulinemia? Hematol Am Soc Hematol Educ Prog (2012) 2012:586−94. 10.1182/asheducation.V2012.1.586.3798562 - DOI - PubMed
    1. Treon SP, Xu L, Yang G, Zhou Y, Liu X, Cao Y, et al. . Myd88 L265P Somatic Mutation in Waldenström’s Macroglobulinemia. N Engl J Med (2012) 367(9):826−33. 10.1056/NEJMoa1200710 - DOI - PubMed
    1. Gachard N, Parrens M, Soubeyran I, Petit B, Marfak A, Rizzo D, et al. . IGHV Gene Features and MYD88 L265P Mutation Separate the Three Marginal Zone Lymphoma Entities and Waldenström Macroglobulinemia/Lymphoplasmacytic Lymphomas. Leukemia (2013) 27(1):183−9. 10.1038/leu.2012.257 - DOI - PubMed
    1. Jiménez C, Sebastián E, Chillón MC, Giraldo P, Mariano Hernández J, Escalante F, et al. . Myd88 L265P is a Marker Highly Characteristic of, But Not Restricted to, Waldenström’s Macroglobulinemia. Leukemia (2013) 27(8):1722−8. 10.1038/leu.2013.62 - DOI - PubMed

Publication types

MeSH terms