. 2021 Jun 25;41(6):BSR20204370.
doi: 10.1042/BSR20204370.

Identification of potential diagnostic and prognostic biomarkers for LUAD based on TCGA and GEO databases

Affiliations

Identification of potential diagnostic and prognostic biomarkers for LUAD based on TCGA and GEO databases

Qiangqiang Zheng et al. Biosci Rep. .

Abstract

Accumulating evidence has demonstrated that gene alterations play a crucial role in LUAD development, progression, and prognosis. The present study aimed to identify the hub genes associated with LUAD. In the present study, we used TCGA database to screen the hub genes. Then, we validated the results by GEO datasets. Finally, we used cBioPortal, UALCAN, qRT-PCR, HPA database, TCGA database, and Kaplan-Meier plotter database to estimate the gene mutation, gene transcription, protein expression, clinical features of hub genes in patients with LUAD. A total of 5930 DEGs were screened out in TCGA database. Enrichment analysis revealed that DEGs were involved in the transcriptional misregulation in cancer, viral carcinogenesis, cAMP signaling pathway, calcium signaling pathway, and ECM-receptor interaction. The combining results of MCODE and CytoHubba showed that ADCY8, ADRB2, CALCA, GCG, GNGT1, and NPSR1 were hub genes. Then, we verified the above results by GSE118370, GSE136043, and GSE140797 datasets. Compared with normal lung tissues, the expression levels of ADCY8 and ADRB2 were lower in LUAD tissues, but the expression levels of CALCA, GCG, GNGT1, and NPSR1 were higher. In the prognosis analyses, the low expression of ADCY8 and ADRB2 and the high expression of CALCA, GCG, GNGT1, and NPSR1 were correlated with poor OS and poor PFS. The significant differences in the relationship of the expression of 6 hub genes and clinical features were observed. In conclusion, 6 hub genes will not only contribute to elucidating the pathogenesis of LUAD and may be potential therapeutic targets for LUAD.

Keywords: GEO; LUAD; TCGA; clinical features; hub genes; survival.


Conflict of interest statement

The authors declare that there are no competing interests associated with the manuscript.

Figures

Figure 1
Figure 1. Heatmap and Volcanoplot of the distribution of DEGs between LUAD tissues and normal lung tissues
(A) Heatmap of 600 DEGs between LUAD tissues and normal lung tissues. The up-regulated and down-regulated genes were shown in red and green, respectively. (B) Volcanoplot of 600 DEGs between LUAD tissues and normal lung tissues. The up-regulated and down-regulated genes were shown in red and blue, respectively.
Figure 2
Figure 2. GO and KEGG functional enrichment analyses of 300 up-regulated and 300 down-regulated DEGs in LUAD
(A) GO analysis of 300 up-regulated DEGs, (B) GO analysis of 300 down-regulated DEGs, (C) KEGG functional enrichment analysis of 300 up-regulated DEGs, (D) KEGG functional enrichment analysis of 300 down-regulated DEGs. Circle, triangle, and square represented BP or KEGG functional enrichment, CC, and MF, respectively. The size of the dot represented gene count, and the color of the dot represented the P value.
Figure 3
Figure 3. The 600 DEGs in LUAD were analyzed to identify the hub genes
(A) PPI network of DEGs. The red circle represented up-regulated genes, and the blue triangle represented down-regulated genes. (B) The Venn diagram was used to screen common DEGs calculated using two plugins of Cytoscape (CytoHubba and MCODE). (C) MCODE identification of the most significantly enriched module. The red circle represented up-regulated genes, and the blue triangle represented down-regulated genes. (D) GSEA of the 6 hub genes.
Figure 4
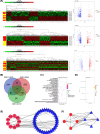
Figure 4. The verification results of GEO database
(A) Heatmaps and Volcanoplots of the distribution of DEGs in GSE118370, GSE136043, and GSE140797 datasets. The up-regulated and down-regulated genes were shown in red and green or blue, respectively. (B) Venn diagram showing number of common genes from GSE118370, GSE136043, and GSE140797 datasets. (C) GO analysis of 77 DEGs. Circle, triangle, and square represented BP, CC, and MF, respectively. the size of the dot represented gene count, and the color of the dot represented the P value. (D) KEGG functional enrichment analysis of 77 DEGs. The size of the dot represented gene count, and the color of the dot represented the P value. (E) PPI network of the identified 77 DEGs. The red circle represented up-regulated genes, and the blue triangle represented down-regulated genes. (F) MCODE identification of the most significantly enriched module. The red circle represented up-regulated genes, and the blue triangle represented down-regulated genes.
Figure 5
Figure 5. The genetic alterations of 6 hub genes in LUAD
(A) The alteration frequency of 6 hub genes. (B) Mutations of every hub gene. Green represented missense mutation, orange represented splice mutation, dark grey represented truncating mutation, violet represented fusion, red represented amplification, and blue represented deep deletion.
Figure 6
Figure 6. Relative expression and the correlation between 6 hub genes in LUAD
(A) The expression of 6 hub genes in LUAD patients (Ualcan database). (B) Correlation between expression of 6 hub genes and tumor stages in LUAD patients (Ualcan database). (C) Expression of 6 hub genes in LUAD based on nodal metastasis status (UALCAN database). (D) Quantitative real-time PCR results for the 6 hub genes. Expression of hub genes were normalized against GAPDH expression. The statistical significance of differences was calculated by the Student’s t-test; *P<0.05, **P<0.01, ***P<0.001.
Figure 7
Figure 7. The IHC - based protein expression of 6 hub genes in LUAD tissues and normal lung tissues
All the IHC staining images were obtained from the HPA database.
Figure 8
Figure 8. The relationship of prognosis and expression level of 6 hub genes in patients with LUAD
The prognostic significance of the 6 hub genes in patients with LUAD, according to the Kaplan–Meier plotter database and TCGA database. The red curve represented the survival curve of LUAD patients with high gene expression, the black curve represented the survival curve of LUAD patients with low gene expression.
Figure 9
Figure 9. ROC curves for the 6 hub genes in LUAD
Red represented sensitive curve, blue indicated identify line. The X axis showed false positive rate, presented as ‘100-Specificity (%)’. The Y axis indicated true positive rate, shown as ‘Sensitivity (%)’.
Figure 10
Figure 10. Forest plots of OR for the association between 6 hub genes expression and clinicopathological features in patients with LUAD
(A) ADCY8, (B) ADRB2, (C) CALCA, (D) GCG, (E) GNGT1, (F) NPSR1.

References

    1. Bray F., Ferlay J., Soerjomataram I., Siegel R.L., Torre L.A. and Jemal A. (2018) Global cancer statistics 2018: GLOBOCAN estimates of incidence and mortality worldwide for 36 cancers in 185 countries. CA Cancer J. Clin. 68, 394–424 10.3322/caac.21492 - DOI - PubMed
    1. Siegel R.L., Miller K.D. and Jemal A. (2020) Cancer statistics, 2020. CA Cancer J. Clin. 70, 7–30 10.3322/caac.21590 - DOI - PubMed
    1. Li X., Shi Y., Yin Z., Xue X. and Zhou B. (2014) An eight-miRNA signature as a potential biomarker for predicting survival in lung adenocarcinoma. J. Transl. Med. 12, 159 10.1186/1479-5876-12-159 - DOI - PMC - PubMed
    1. Müller M.F., Ibrahim A.E. and Arends M.J. (2016) Molecular pathological classification of colorectal cancer. Virchows Arch. 469, 125–134 10.1007/s00428-016-1956-3 - DOI - PMC - PubMed
    1. Bleeker F.E., Felicioni L., Buttitta F., Lamba S., Cardone L., Rodolfo M.et al. . (2008) AKT1 (E17K) in human solid tumours. Oncogene 27, 5648–5650 10.1038/onc.2008.170 - DOI - PubMed

Publication types

MeSH terms