. 2022 Jun;24(2):97-112.
doi: 10.1007/s12017-021-08665-z. Epub 2021 May 21.

Activation of Neuropeptide Y2 Receptor Can Inhibit Global Cerebral Ischemia-Induced Brain Injury

Affiliations

Activation of Neuropeptide Y2 Receptor Can Inhibit Global Cerebral Ischemia-Induced Brain Injury

Reggie Hui-Chao Lee et al. Neuromolecular Med. 2022 Jun.

Abstract

Cardiopulmonary arrest (CA) can greatly impact a patient's life, causing long-term disability and death. Although multi-faceted treatment strategies against CA have improved survival rates, the prognosis of CA remains poor. We previously reported asphyxial cardiac arrest (ACA) can cause excessive activation of the sympathetic nervous system (SNS) in the brain, which contributes to cerebral blood flow (CBF) derangements such as hypoperfusion and, consequently, neurological deficits. Here, we report excessive activation of the SNS can cause enhanced neuropeptide Y levels. In fact, mRNA and protein levels of neuropeptide Y (NPY, a 36-amino acid neuropeptide) in the hippocampus were elevated after ACA-induced SNS activation, resulting in a reduced blood supply to the brain. Post-treatment with peptide YY3-36 (PYY3-36), a pre-synaptic NPY2 receptor agonist, after ACA inhibited NPY release and restored brain circulation. Moreover, PYY3-36 decreased neuroinflammatory cytokines, alleviated mitochondrial dysfunction, and improved neuronal survival and neurological outcomes. Overall, NPY is detrimental during/after ACA, but attenuation of NPY release via PYY3-36 affords neuroprotection. The consequences of PYY3-36 inhibit ACA-induced 1) hypoperfusion, 2) neuroinflammation, 3) mitochondrial dysfunction, 4) neuronal cell death, and 5) neurological deficits. The present study provides novel insights to further our understanding of NPY's role in ischemic brain injury.

Keywords: Cerebral blood flow; Cerebral ischemia; Neurological deficits; Neuronal cell death; Neuropeptide Y.


Conflict of interest statement

Conflicts of interest/Competing interests

No conflicts of interest, financial or otherwise, are declared by the author(s).

Figures

Figure. 1.
Figure. 1.. NPY but not NE levels were enhanced 24 hrs. after ACA, while post-treatment with PYY3–36 decreased NPY levels in the brain.
Blood samples were collected from the femoral artery 10 mins and 24 hrs. after ACA, while total protein from the entire hippocampus was collected 24 hrs. after sham/ACA surgery. NE concentration was measured via ELISA, while mRNA and peptide levels of NPY were measured via reverse transcription real-time PCR and ELISA, respectively. (A) Plasma NE concentration (via ELISA) was significantly increased 10 mins after ACA but returned to normal levels 24 hrs. after ACA. (B) Rats subjected to ACA surgeries had similar NE protein levels in the hippocampus 24 hrs after ACA as compared to control rats. mRNA (C) and peptide (D) levels of NPY in the hippocampus were increased 24 hrs after ACA, while post-treatment with PYY3–36 reduced NPY levels. n indicate the number of animals used per group. Results were expressed as mean ± S.E.M. *P<0.05 indicates significantly different from before and 24hrs after ACA. #<0.05 indicates significantly different from control. &<0.05 indicates significantly different from ACA (1 day), evaluated by one-way ANOVA with Tukey’s post-hoc test.
Figure. 2.
Figure. 2.. Inhibition of NPY via post-treatment with PYY3–36 enhanced CBF after ACA.
Cortical CBF was measured for 5 mins via intra-vital laser speckle contrast imaging in the anesthetized rat 30 mins before and 24 hrs after ACA surgery. Body temperatures were maintained at 37°C during the recording. (A) Representative flux images of cortical vasculature before and after ACA. The dashed ovals indicate the region of interest where cortical blood flow was measured via the cranial window. Changes in CBF were presented as percent change in flow from baseline CBF (30 min before ACA) and summarized in panel B. Results were expressed as mean ± S.E.M. *p<0.05 indicates significantly different from ACA-only rats, evaluated by independent t-test. n indicates number of experiments.
Figure. 3.
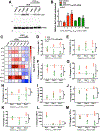
Figure. 3.. Post-treatment with PYY3–36 inhibited microglial activation and neuroinflammation after ACA.
The hippocampus was collected 1, 3, and 7 days after ACA surgery. Relative protein levels of Iba1 in the hippocampus were measured by capillary-based immunoassay. (A) Synthetic bands of Iba1 bands at 17 kDa. Results from the capillary-based immunoassay were summarized in panel B. Relative Iba1 protein levels were normalized to the internal control (β-actin) and expressed as the ratio of Iba1 levels in control animals. Upregulation of Iba1 protein expression (red bars) can be observed in rats treated with ACA, while post-treatment with PYY3–36 (40 μg/kg) reduced Iba1 protein expression (green bars) after ACA. (C) Heatmap of protein expression of the selected cytokines involved in neuroinflammation. Values were normalized with control animals and expressed as log2 (fold change). Relative cytokine levels in the hippocampus were measured via protein chip assay. Results from protein chip assay were summarized in panels D-M. Results were presented as % changes from the baseline (dashed line, control animals). Protein expression of inflammatory cytokines in the hippocampus was enhanced after ACA (red squares), while post-treatment with PYY3–36 (40 μg/kg) significantly reduced inflammatory cytokine levels (green triangles). n indicates number of experiments. Results were expressed as mean ± S.E.M. *p≤0.05 indicates significantly different from control animals. #p≤0.05 indicates significantly different from the respective days after ACA (red squares), &p<0.05 indicates overall significantly different from ACA-treated rats (red squares), evaluated by two-way ANOVA with Tukey’s post hoc test.
Figure. 4.
Figure. 4.. PYY3–36 maintained hippocampal mitochondrial function from ischemia following ACA.
Oxygen consumption rate (OCR) was measured in the hippocampal slices (200 μm, diameter) 7 days after ACA via Seahorse XF analyzer. (A) Changes in mitochondrial respiration were manipulated by injection of 20 μg/ml oligomycin, 1 mM pyruvate and 80 μM carbonyl cyanide 4-(trifluoromethoxy) phenylhydrazone (FCCP), and 20 μM antimycin A. Results were summarized in panels B-H. Although ACA alone (red line and bar) did not affect basal respiration and ATP production, and proton leak in the mitochondria (A), mitochondrial reserve capacity was reduced 7 days after ACA but reversed with post-treatment with PYY3–36 (green line and triangle) (A, F) to suggest that inhibition of NPY via NPY2R is important to maintain mitochondrial function. n indicates number of experiments. Results were expressed as mean ± S.E.M. *p≤0.05 indicates significantly different from control (white circle) and ACA+PYY-treated rats (green triangle), evaluated by one-way ANOVA with Tukey’s post-hoc test.
Figure. 5.
Figure. 5.. Post-treatment with PYY3–36 alleviated neuronal cell death in the CA1 region of the hippocampus 7 days after cerebral ischemia.
Whole animal perfusion and fixation were performed 7 days after ACA for brain histopathology of the hippocampus. Cortical brain sections from control, ACA only, and ACA+PYY3–36-treated rats were stained with H&E (blue/pink) (A), and fluoro-jade C (FJC, green) (B), and DAPI nuclear counterstain (blue). Control (no ACA, no drug administration) group was served as an internal control. Representative images of H&E in panel A indicate that healthy neurons contain a lightly stained nucleus with a dark-stained nucleolus and a red-stained cytoplasm. On the contrary, dead/injured neurons exhibit shrunken cytoplasm and pyknotic nuclei. Representative images of H&E and FJC staining in panel A and B indicate that degenerative neurons can be observed in the CA1 region of the hippocampus 7 days after ACA, while post-treatment with PYY3–36 (40 μg/kg) inhibited neuronal degeneration. Red arrows in panel A indicate neuronal cell death. Red arrowheads in panel B indicate degenerative neurons. In a separate set of experiments, neuronal cell death following 45 mins of OGD was evaluated via propidium iodide (PI) fluorescence. (C) Representative propidium iodide fluorescence images of hippocampal organotypic slices following OGD + Vehicle (ddH2O), OGD+PYY3–36 (500 nM), Vehicle only, and PYY3–36 (500 nM) only treatments. NMDA at 500 μM was utilized to induce maximal neuronal cell death at the end of experiments. Neuronal cell death with/without OGD in the present/absent of PYY3–36 was normalized with NMDA-induced maximum cell death and expressed in the bar graph in panel D. 45 mins of OGD resulted in neuronal cell death in the CA1 region of the hippocampus, while PYY3–36 at 500 nM reduced OGD-induced cell death. n indicates number of animals used per group. Scale bars in panel C indicate 500 μm. Results were expressed as mean ± S.E.M. *p≤0.05 indicates significantly different from vehicle only, PYY3–36 only, and OGD+PYY3–36 groups via one-way ANOVA with Tukey’s post-hoc.
Figure. 6.
Figure. 6.. Post-treatment with PYY336 improved ACA-induced neurocognitive/memory.
3 days after ACA surgery, the Y-maze spontaneous alternation test were utilized to examine the effects of NPY inhibition on hippocampal-related working/short-term memory after ACA. Spontaneous alternation ratio was decreased in rats subjected to ACA only surgery as compared to control, while post-treatment with PYY3–36 at 40 μg/kg increased alternation rate. n indicates number of animals used per group. Results were expressed as mean ± S.E.M. *p<0.05 indicates significantly different from control rats, # p<0.05 indicates significantly different from ACA only group via one-way ANOVA with Tukey’s post-hoc.
Figure. 7.
Figure. 7.. Cartoon illustrating the role of NPY in ACA-induced brain injury.
Excessive NPY release (yellow circles) from perivascular sympathetic nerve terminals following ACA results in (I) persistent hypoperfusion, ultimately causing neuronal cell death and neurological deficits (blue arrows). (II) NPY may directly influence CA1 neurons via independent modulation of vascular perfusion to cause neuronal cell death and learning/memory deficits. The use of PYY336 (blue triangles) to activate presynaptic NPY2 receptors can inhibit NPY release after ACA to provide neuroprotection against ACA-induced hypoperfusion, neuronal cell death, and neurological deficits (green arrows).

References

    1. (2011). In th (Ed.), Guide for the Care and Use of Laboratory Animals (The National Academies Collection: Reports funded by National Institutes of Health; ). Washington (DC).
    1. Abounader R, Villemure JG, & Hamel E. (1995). Characterization of neuropeptide Y (NPY) receptors in human cerebral arteries with selective agonists and the new Y1 antagonist BIBP 3226. Br J Pharmacol, 116(4), 2245–2250, doi:10.1111/j.1476-5381.1995.tb15060.x. - DOI - PMC - PubMed
    1. Back DB, Kwon KJ, Choi DH, Shin CY, Lee J, Han SH, et al. (2017). Chronic cerebral hypoperfusion induces post-stroke dementia following acute ischemic stroke in rats. J Neuroinflammation, 14(1), 216, doi:10.1186/s12974-017-0992-5. - DOI - PMC - PubMed
    1. Bahar AS, Shirvalkar PR, & Shapiro ML (2011). Memory-guided learning: CA1 and CA3 neuronal ensembles differentially encode the commonalities and differences between situations. J Neurosci, 31(34), 12270–12281, doi:10.1523/JNEUROSCI.1671-11.2011. - DOI - PMC - PubMed
    1. Baldock PA, Sainsbury A, Couzens M, Enriquez RF, Thomas GP, Gardiner EM, et al. (2002). Hypothalamic Y2 receptors regulate bone formation. J Clin Invest, 109(7), 915–921, doi:10.1172/JCI14588. - DOI - PMC - PubMed

Publication types