. 2021 Sep;69(9):2215-2234.
doi: 10.1002/glia.24019. Epub 2021 May 21.

Treatment with hypoxia-mimetics protects cultured rat Schwann cells against oxidative stress-induced cell death

Affiliations

Treatment with hypoxia-mimetics protects cultured rat Schwann cells against oxidative stress-induced cell death

Brian T David et al. Glia. 2021 Sep.

Abstract

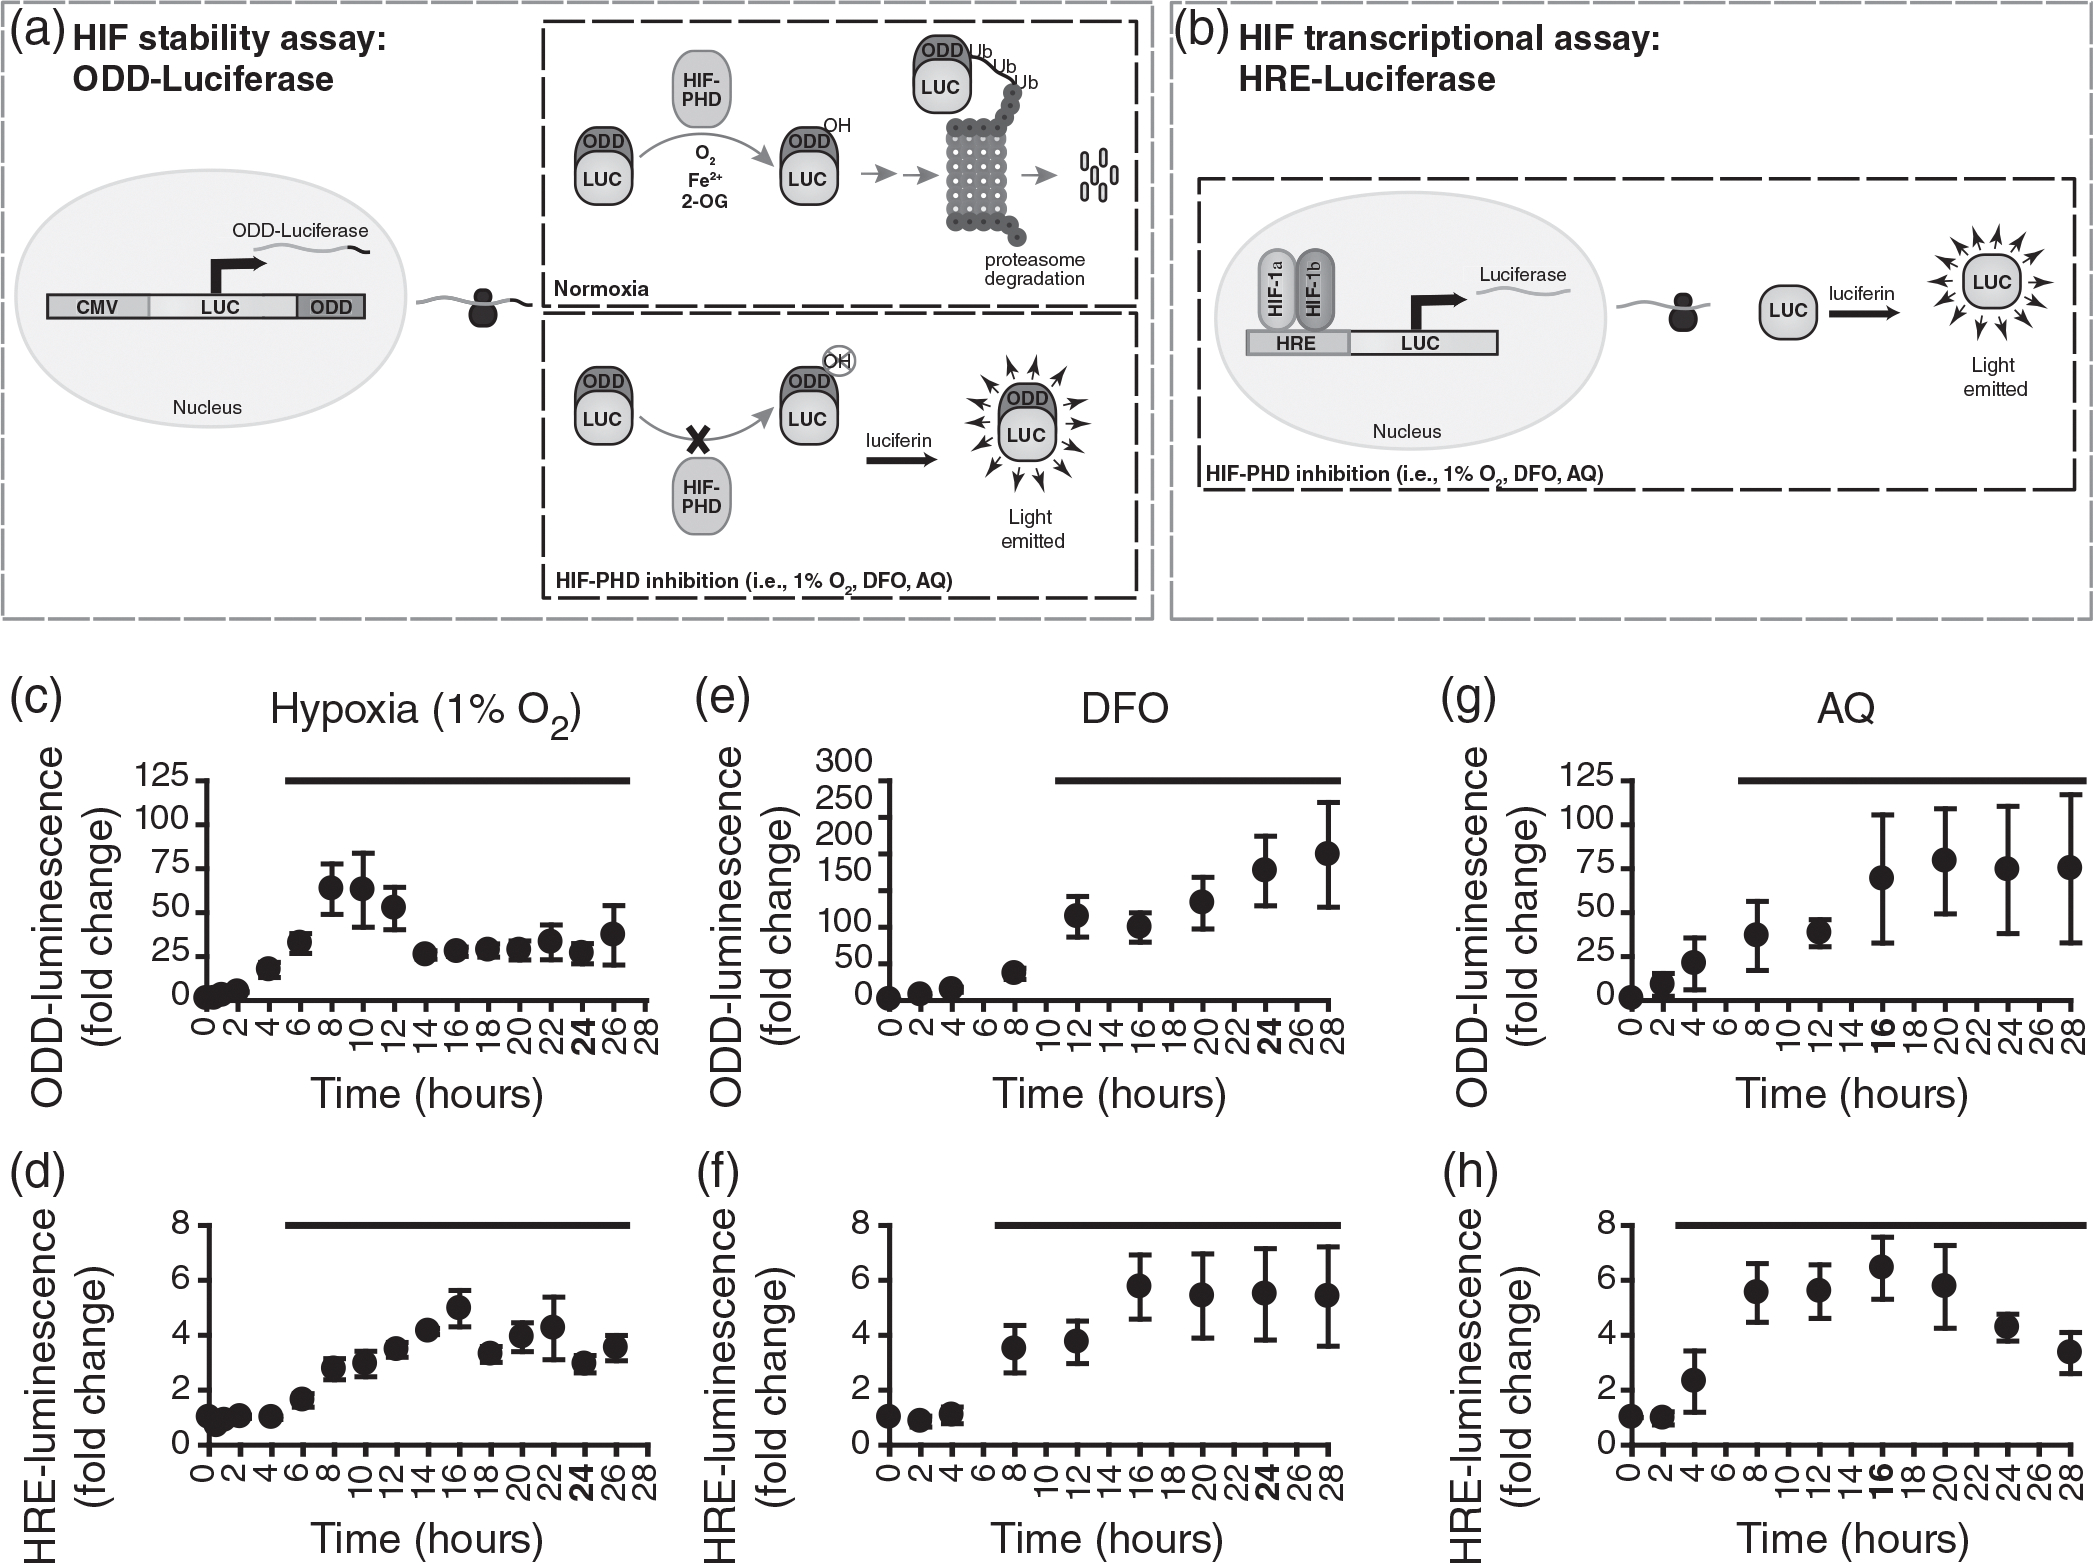
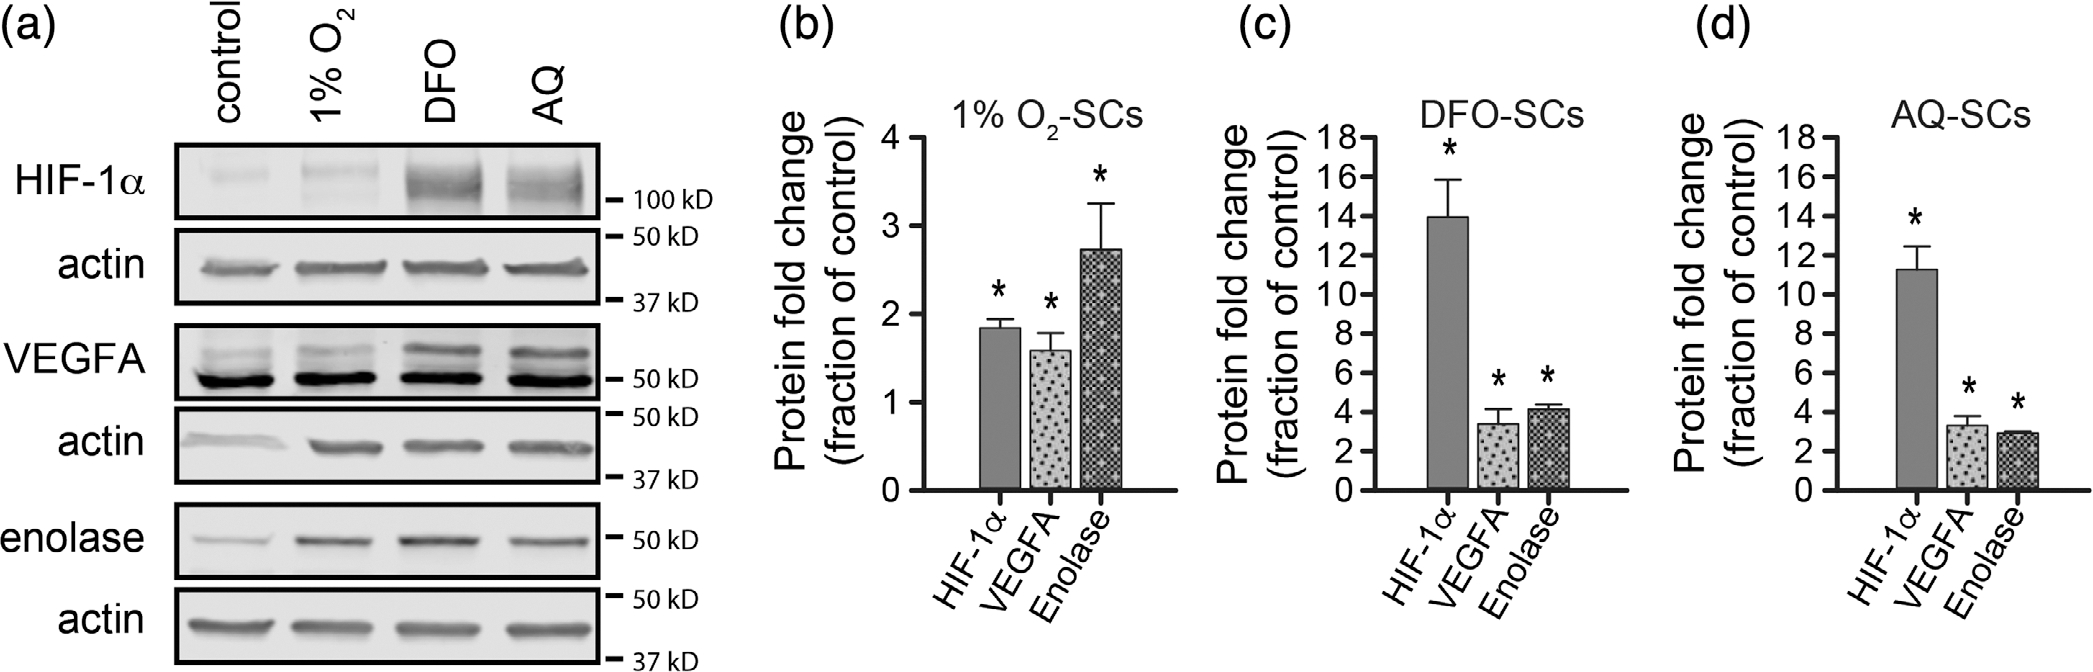
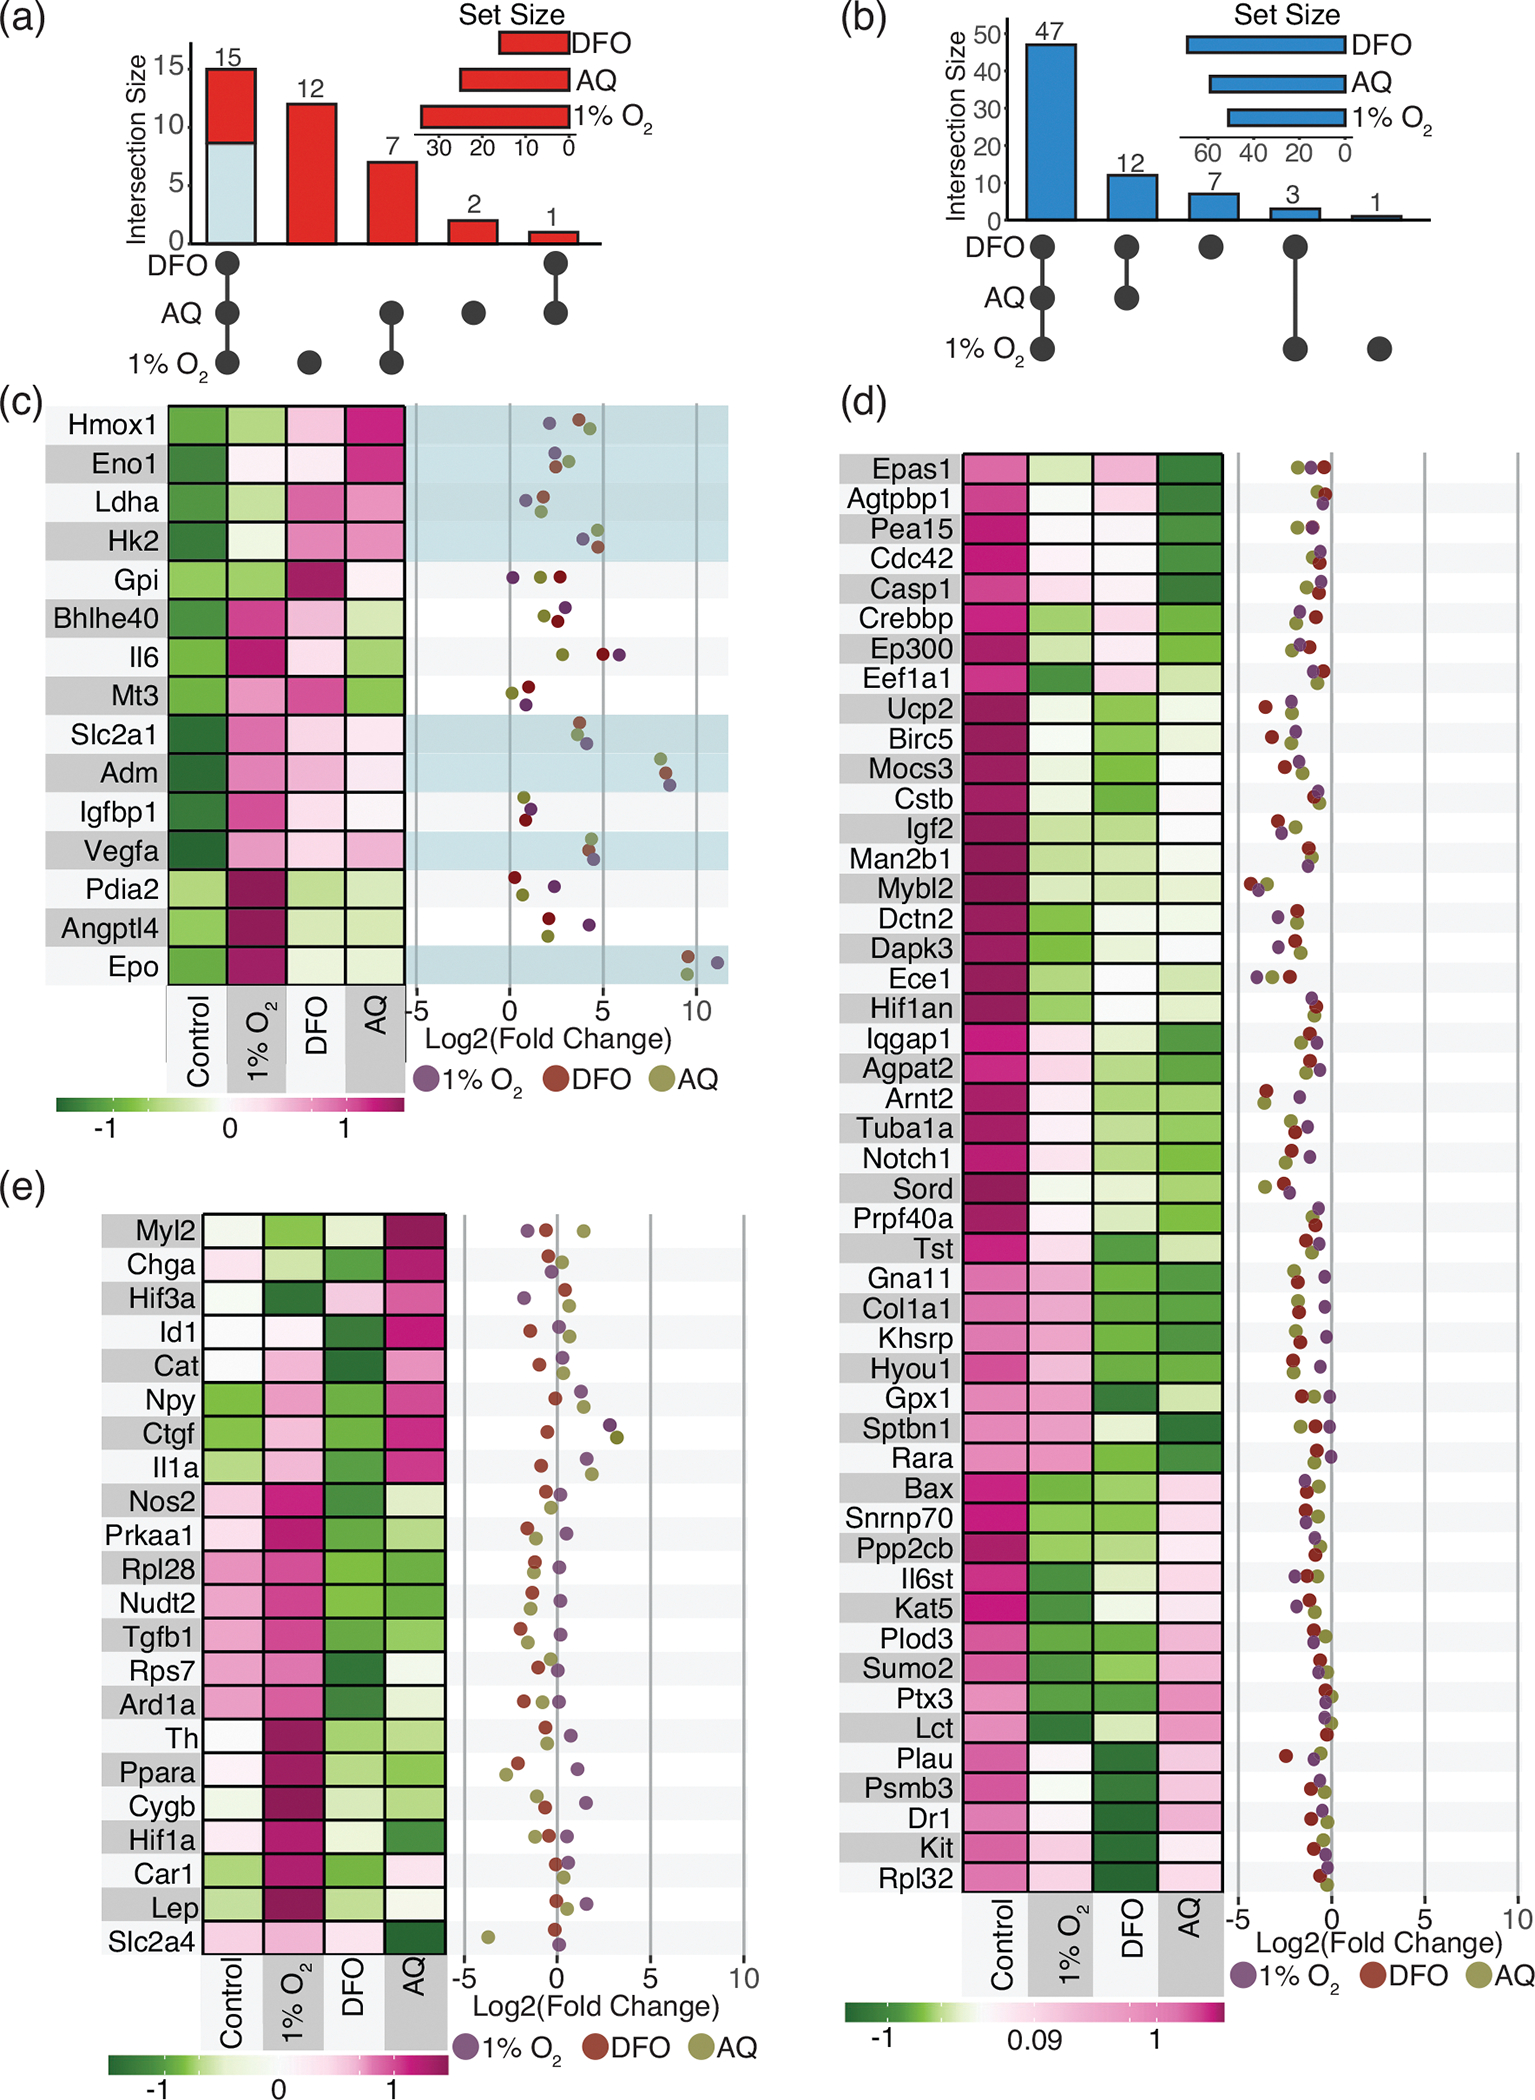
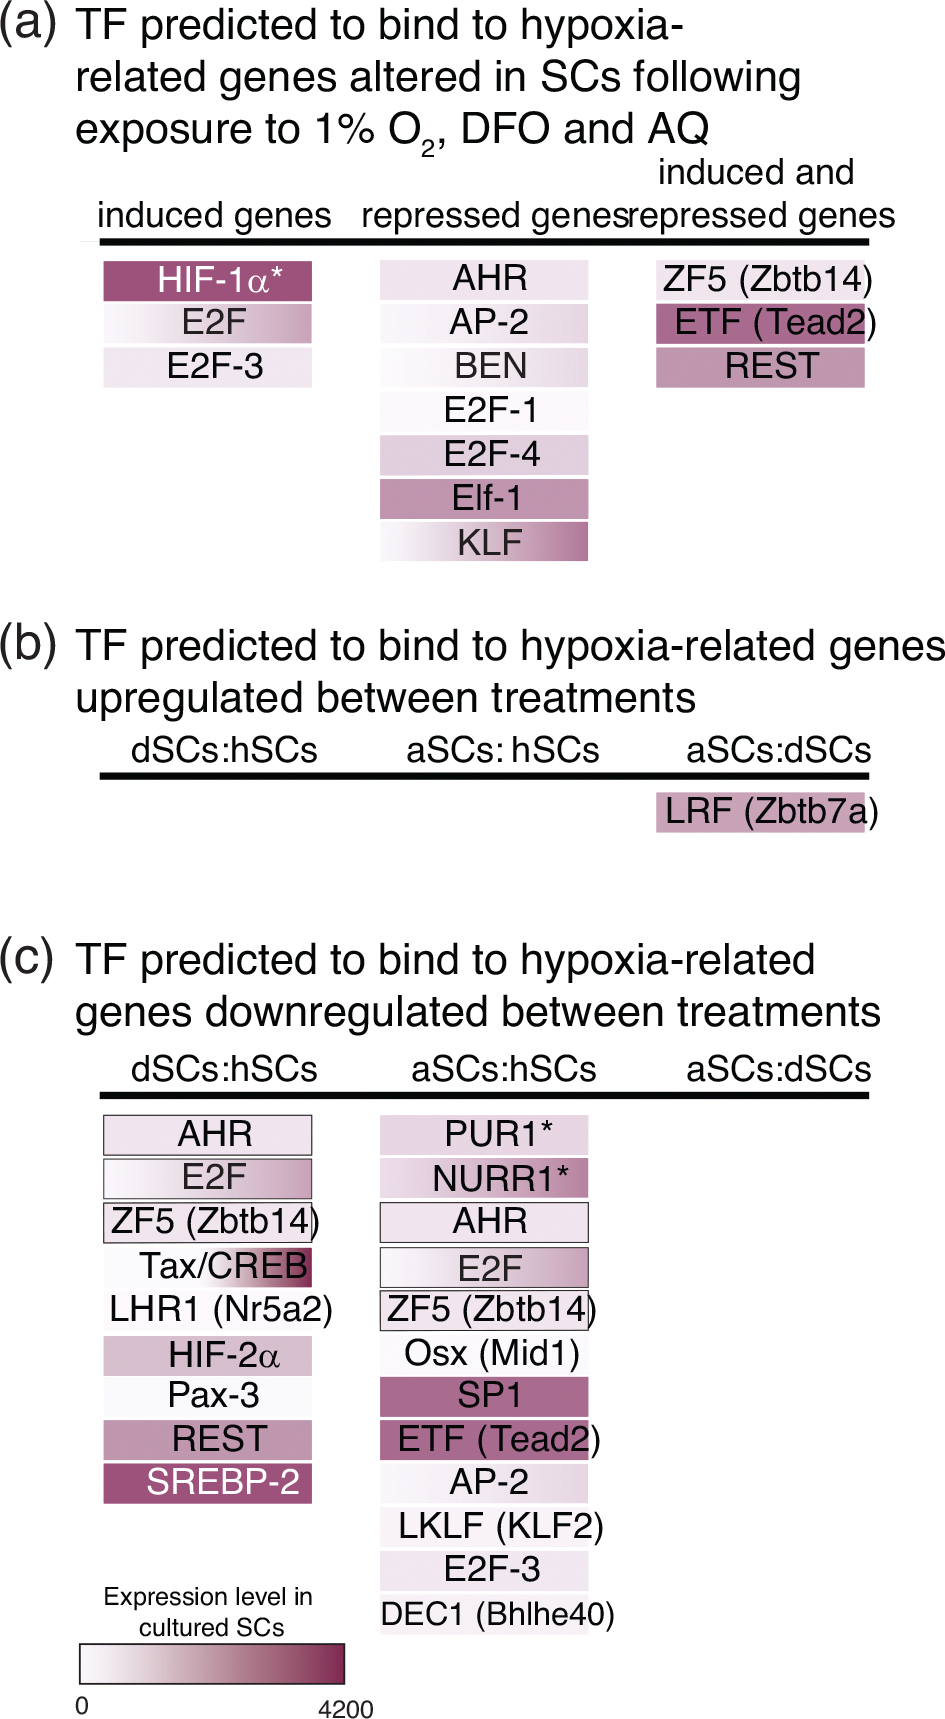
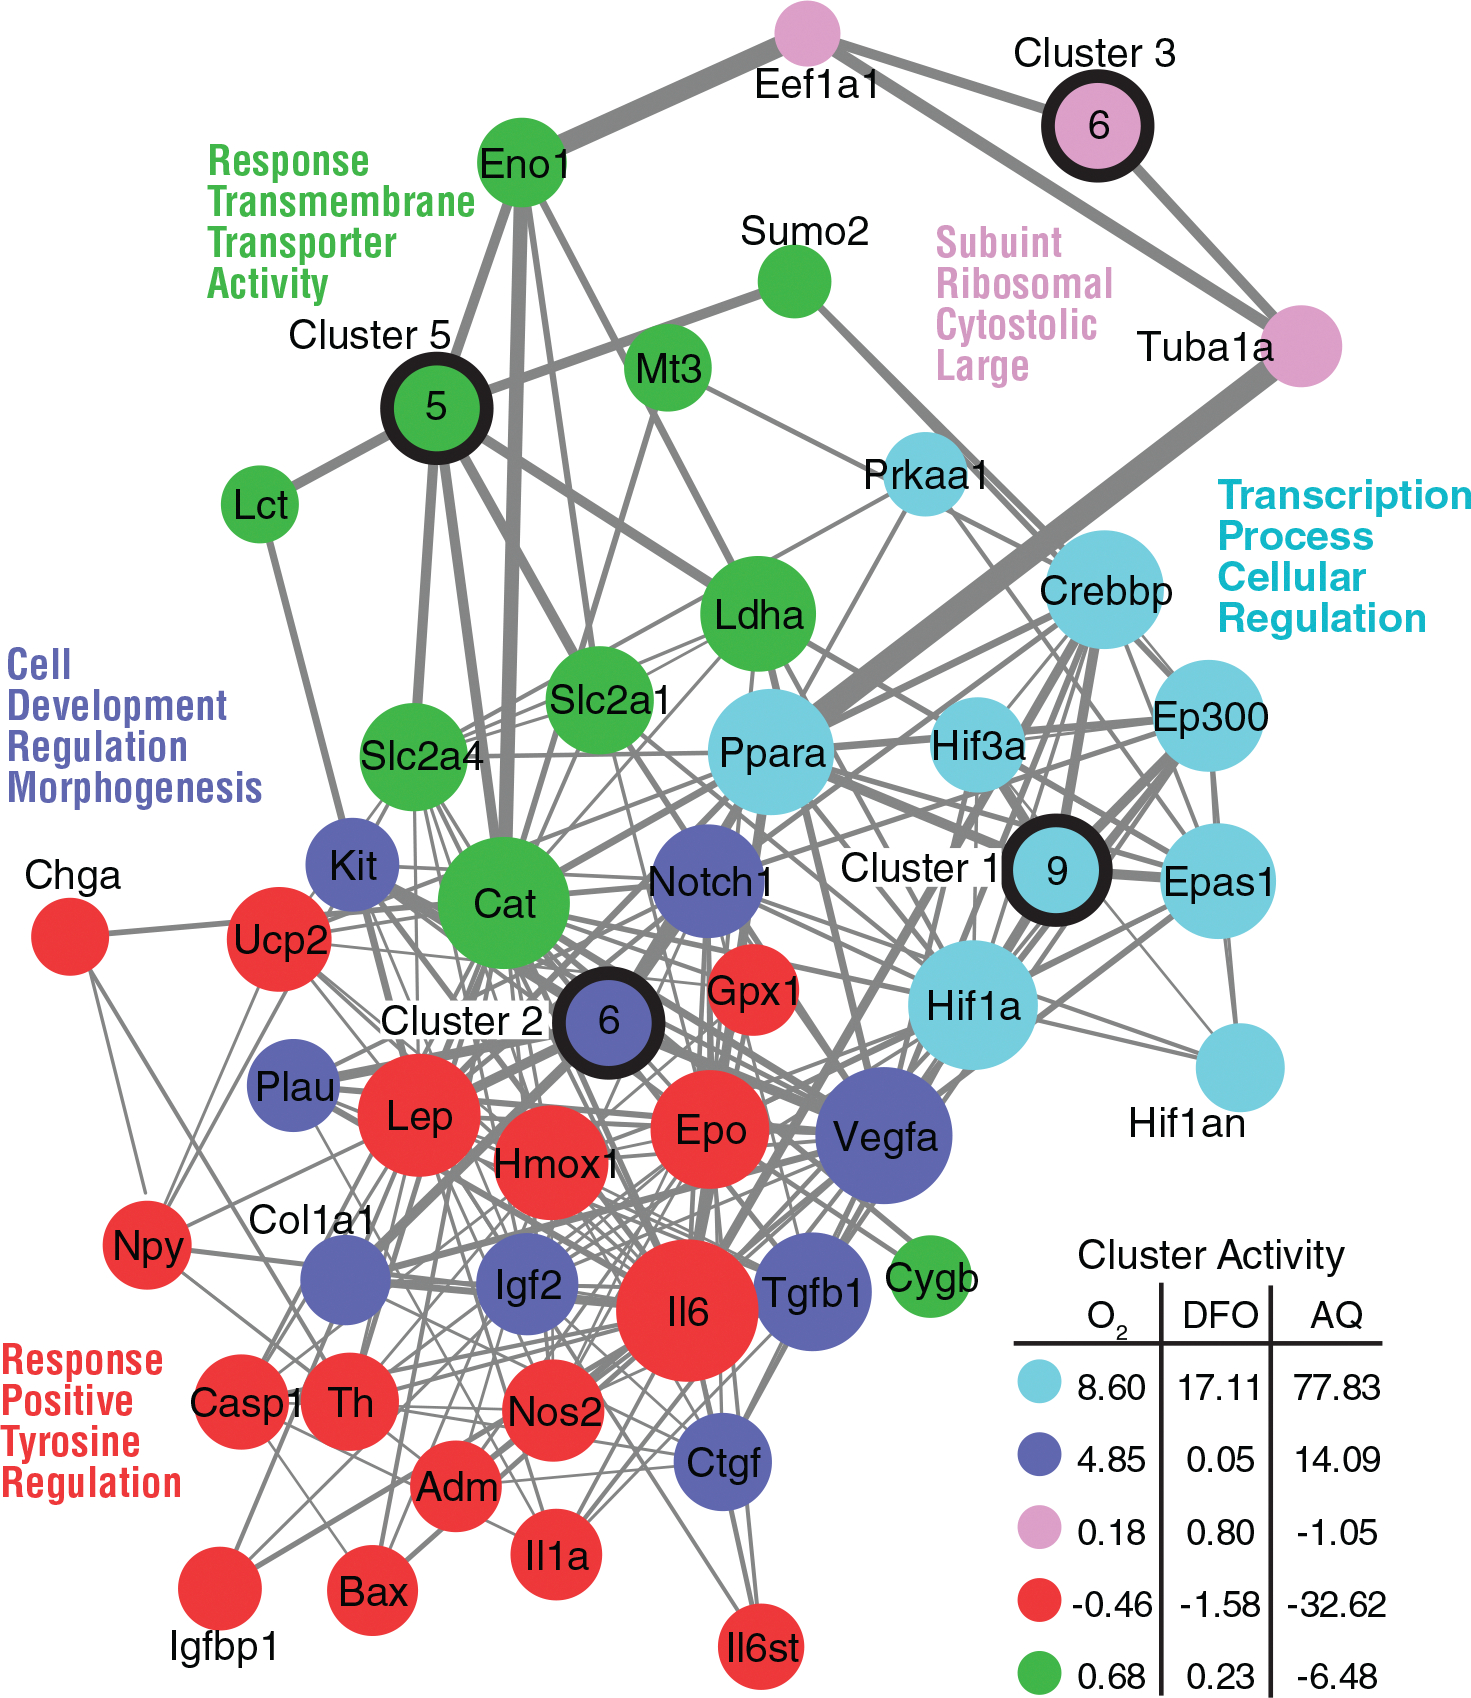
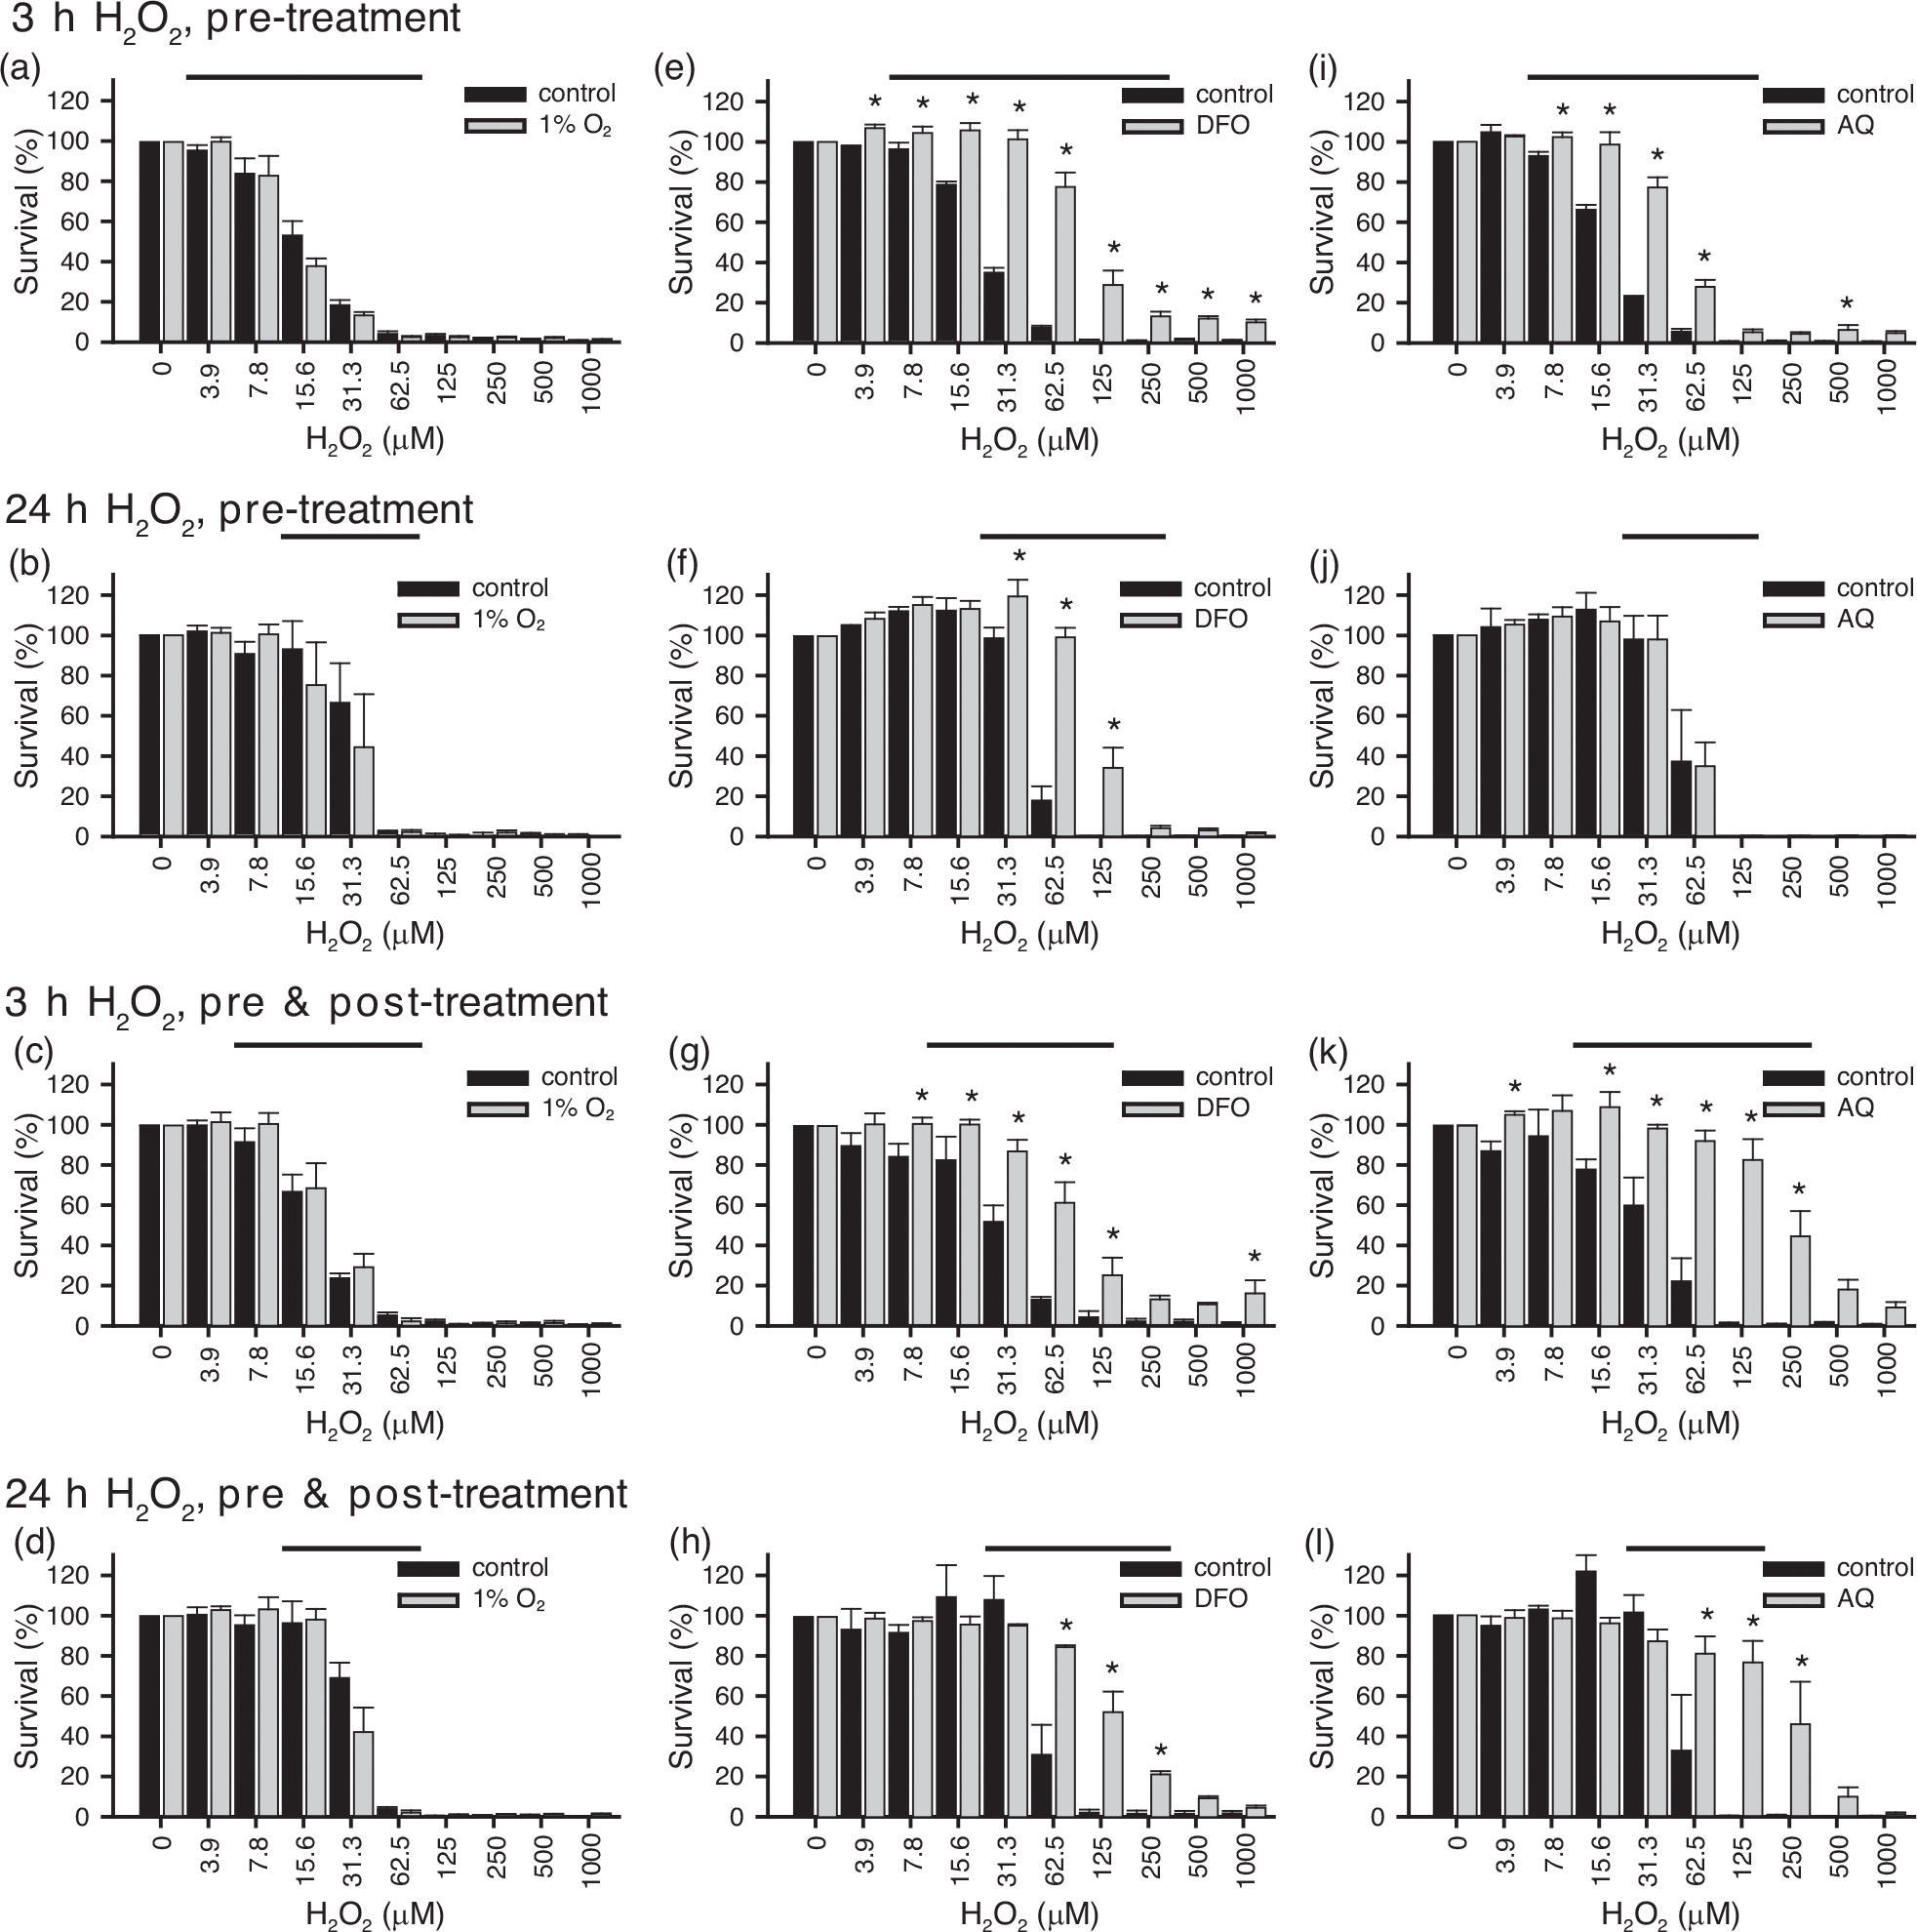
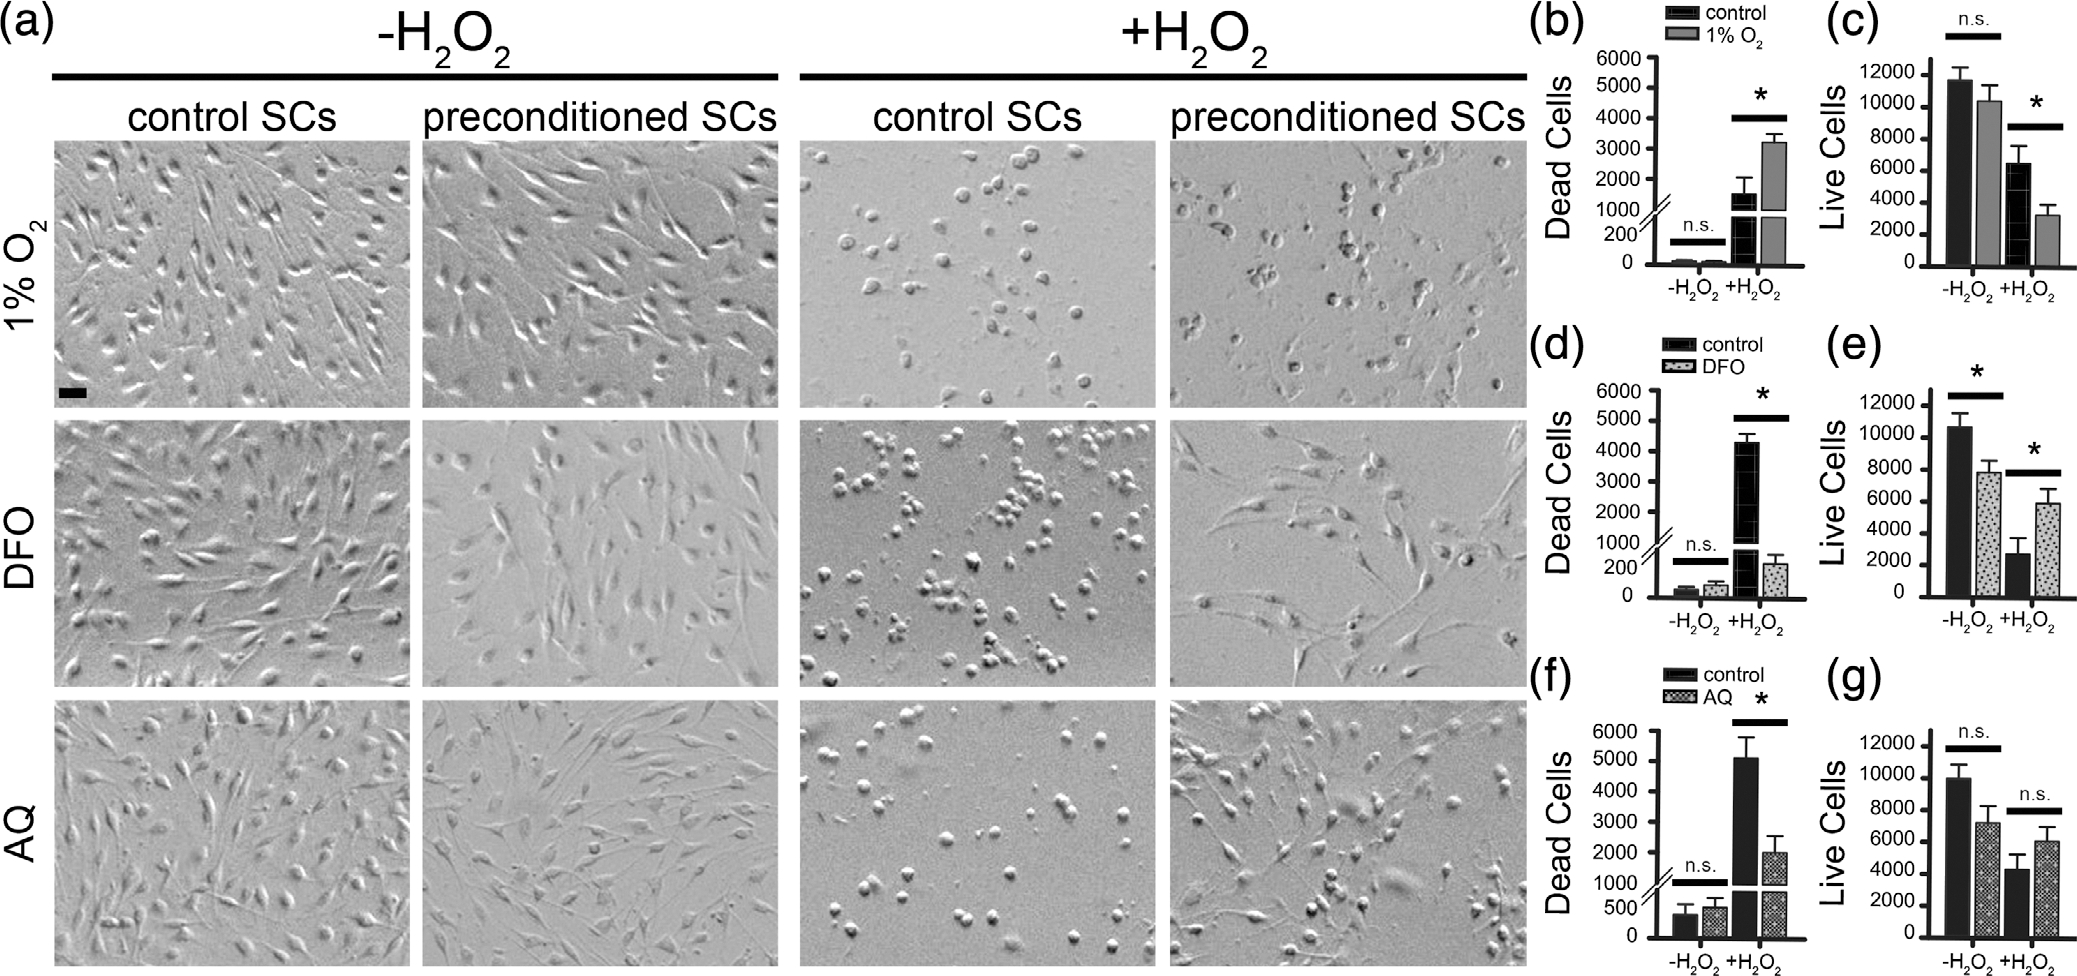
Schwann cell (SC) grafts promote axon regeneration in the injured spinal cord, but transplant efficacy is diminished by a high death rate in the first 2-3 days postimplantation. Both hypoxic preconditioning and pharmacological induction of the cellular hypoxic response can drive cellular adaptations and improve transplant survival in a number of disease/injury models. Hypoxia-inducible factor 1 alpha (HIF-1α), a regulator of the cellular response to hypoxia, is implicated in preconditioning-associated protection. HIF-1α cellular levels are regulated by the HIF-prolyl hydroxylases (HIF-PHDs). Pharmacological inhibition of the HIF-PHDs mimics hypoxic preconditioning and provides a method to induce adaptive hypoxic responses without direct exposure to hypoxia. In this study, we show that hypoxia-mimetics, deferoxamine (DFO) and adaptaquin (AQ), enhance HIF-1α stability and HIF-1α target gene expression. Expression profiling of hypoxia-related genes demonstrates that HIF-dependent and HIF-independent expression changes occur. Analyses of transcription factor binding sites identify several candidate transcriptional co-regulators that vary in SCs along with HIF-1α. Using an in vitro model system, we show that hypoxia-mimetics are potent blockers of oxidative stress-induced death in SCs. In contrast, traditional hypoxic preconditioning was not protective. The robust protection induced by pharmacological preconditioning, particularly with DFO, indicates that pharmacological induction of hypoxic adaptations could be useful for promoting transplanted SC survival. These agents may also be more broadly useful for protecting SCs, as oxidative stress is a major pathway that drives cellular damage in the context of neurological injury and disease, including demyelinating diseases and peripheral neuropathies.

Keywords: H2O2; adaptaquin; cell death; cell survival; deferoxamine; hypoxia adaptations; hypoxia inducible factor (HIF); preconditioning; prolyl hydroxylase inhibition; reporter assay.


Conflict of interest statement

CONFLICT OF INTEREST

The authors declare no conflicts of interest.

Figures

FIGURE 1
FIGURE 1
Luciferase activity over time following administration of 1% O2, deferoxamine (DFO) (200 μM) or adaptaquin (AQ) (10 μM) to Schwann cells (SCs) expressing either oxygen-dependent degradation (ODD)-luc to assess hypoxia-inducible factor (HIF) stabilization or hypoxia response element (HRE)-luc to assess HIF transcriptional activity. (a) Schematic of ODD-luc assay. In normoxia, the HIF-prolyl hydroxylases (PHDs) hydoxylate the ODD-luc fusion protein resulting in its proteasomal targeting and degradation. When the HIF-PHDs are inhibited, ODD-luc accumulates. The amount of light produced by the luciferase reaction when luciferin is added reflects the level of ODD-stabilization or degradation. (b) Schematic of HRE-luc assay. Transcription of luciferase is dependent on the HRE. HIF-binding and subsequent transcriptional activation results in increased luciferase levels within the cell. The amount of light produced by the luciferase reaction reflects the level of HIF-dependent HRE-mediated transcription. (c) 6–30 h of exposure to 1% O2 significantly increased the amount of light detected in ODD–luc expressing SCs (ANOVA: F(34,16) = 4.790, p = .000062, power = 1.000, post hoc: p < .05), 6–26 h shown. Maximum ODD-luc activity occurred with 8 h of 1% O2 exposure (63.3 ± 14.33-fold increase). Longer exposure to 1% O2 (14–30 h) resulted in reduced, but significantly elevated, levels of luciferase activity (24- to 33-fold increase above baseline). (d) 1% O2 significantly increased HRE-luc activity with 8–30 h of exposure (ANOVA: F(34, 16) = 8.404, p = 1.2084e−7, power = 1.000, post hoc: p < .05), up to 26 h shown. Maximum HRE-luc activity occurred with 16 h of hypoxia exposure (5.0 ± 0.66-fold increase). Longer hypoxia exposure (18–30 h) resulted in reduced, but significantly elevated, levels of HRE-luc activity (3.3- to 4.2-fold increase above baseline). (e) Exposure of ODD-luc SCs to DFO resulted in significantly increased luciferase activity from 12 to 28 h (ANOVA: F(7,8) = 20.594, p = 1.3019e−9, power = 1.000, post hoc: p < .05). Maximum ODD-luc activity occurred with 28 h of DFO exposure (198.8 ± 35.7-fold increase). (f) DFO exposure significantly increased HRE-luc activity from 8 to 28 h (ANOVA: F(27,8) = 14.217, p = 7.1611e−8, power = 1.000, post hoc: p < .05). Maximum HRE-luc activity occurred with 16 h of DFO exposure (5.8 ± 0.58-fold increase), after which HIF transcriptional activity remained elevated by 5.4- to 5.5-fold though 28 h of exposure. (g) 8–28 h of AQ exposure significantly increased ODD-luc activity (ANOVA: F(27,8) = 5.572, p = .000326, power = 0.995, post hoc: p < .05). Maximum stabilization occurred with 20 h of exposure (79.2 ± 14.94-fold increase). (h) 4–28 h AQ treatment significantly increased HRE-luc activity (ANOVA: F(27,8) = 20.555, p = 1.3294e−9, post hoc: p < .05). Maximum HIF transcriptional activity occurred with 16 h of AQ exposure (6.4 ± 0.56-fold increase), after which time HIF transcriptional activity gradually decreased to 3.3 ± 0.38 above baseline with 28 h of AQ exposure. Exposure times highlighted in bold were used for subsequent experiments. Solid bar denotes time points significantly elevated from baseline. Experiments were repeated three to four times, with three to four technical replicates for each independent replicate time, per condition, per time point. post hoc: Fisher’s LSD, one-tailed. n = 3–4
FIGURE 2
FIGURE 2
Protein expression of hypoxia-inducible factor 1 alpha (HIF-1α) and HIF target genes following exposure of Schwann cells (SCs) to hypoxia (1% O2) or hypoxia-mimetics (deferoxamine [DFO] or adaptaquin [AQ]). Confluent 10 cm dishes of SCs were treated and collected by trypsinization and centrifugation; nuclear and cytoplasmic protein was isolated. Western blotting (a) shows the nuclear levels of HIF-1α and cytoplasmic levels of VEGFA and enolase. Quantification of the protein levels normalized to β-actin and relative to the expression level in control SCs is shown for cells exposed to low O2 (b), DFO (c), and AQ (d). Levels of HIF-1α were significantly increased by all three treatments (O2, t(2) = 8.07, p = .08, power = 0.99; DFO, t(2) = 6.78, p = .01, power = 0.99; AQ, t(2) = 8.70, p = .007, power = 0.99), as were the levels of VEGFA (O2, t(2) = 2.89, p = .05, power = 0.59; DFO, t(2) = 3.11, p = .05, power = 0.64; AQ, t(2) = 4.68, p = .02, power = 0.89); and enolase (O2, t(2) = 3.30, p = .04, power = 0.68; DFO, t(2) = 13.10, p = .003, power = 0.99; AQ, t(2) = 22.39, p = .001, power = 1.00). Statistics, one-tailed t test. * p ≤ .05. n = 3/condition
FIGURE 3
FIGURE 3
Expression of hypoxia-related mRNAs in Schwann cells (SCs) in response to exposure to 1% O2 (24 h), or hypoxia-mimetics, deferoxamine (DFO) (200 μM, 24 h) or adaptaquin (AQ) (10 μM, 16 h). Confluent 10 cm dishes of SCs were treated and collected by trypsinization and centrifugation. (a,b) Upsets depict the number of mRNAs that are shared or differ between the conditions. Upsets of mRNAs increased (up), (a), and decreased (down), (b), in response to the treatments. Circles reflect treatment condition with change. Lines link conditions with shared responses. Set size reflects the total number of mRNAs altered by the treatment condition. (c–e) Heatmap and expression levels across treatments for the 85 hypoxia-related mRNAs. (c) mRNAs increased in response to all treatment (fold-change >0). (d) mRNAs reduced in response to treatment (fold-change <0). (e) mRNAs with divergent expression. n = 3–4/condition
FIGURE 4
FIGURE 4
Transcription factors with predicted binding to the hypoxia-related genes altered in Schwann cells (SCs) in response to exposure to low O2, deferoxamine (DFO), or adaptaquin (AQ). (a) Transcription factors identified that are shared between the three treatments relative to control SCs. Transcription factor binding sites (p < .05) were identified by TRANSFAC analysis of the mRNAs induced or repressed in treated vs. control cells. Lists were compared to identify the predicted transcription factors shared between SCs treated with hypoxia or the hypoxia-mimetics. Binding sites and p-values are included in Supplemental Table 2. (b) Transcription factors identified from the gene lists for the mRNAs upregulated (b) or downregulated (c) between treatments. Binding sites and p-values are included in Supplemental Table 5. Color intensity reflects level of expression in cultured SCs in Clements et al. (2017). *, transcription factors with predicted binding sites that are overrepresented for the altered mRNAs, but not for the 85 hypoxia-related mRNAs. Transcription factors with gray outlines were identified to be altered compared to hypoxia, but shared between the two hypoxia-mimetics
FIGURE 5
FIGURE 5
Using StringDB, a network was generated composed of the 85 hypoxia-related mRNAs examined. Five clusters were identified with the GLay algorithm and using the wordcloud app in Cytoscape, we identified key words from Gene Ontology terms associated with each gene in the clusters. A cluster activity score was calculated for each cluster with a higher positive number representing higher activity and a negative number representing suppressed cluster activity. Gene names are provided for the genes with more than one neighbor in the network. Genes with only one neighbor in each cluster were collapsed into a single node with a number indicating the number of genes in the node. Line thickness reflects strength of the edge from StringDB. Different colors represent the different clusters
FIGURE 6
FIGURE 6
Response of Schwann cells (SCs) preconditioned with hypoxia (1% O2, 24 h) or hypoxia-mimetics (deferoxamine [DFO], 200 μM, 24 h; adaptaquin (AQ), 10 μM, 16 h) and then exposed to H2O2 for either 3 h (a,c,e,g,i,k) or 24 h (b,d,f,h,j,l) with or without the addition of postconditioning treatment. Hypoxic preconditioning failed to protect SCs against H2O2-mediated cell death at either 3 h (a) or 24 h (b) (3 h: F(40, 1) = 1.24, p = .272, power = 0.193; 24 h: F(40, 1) = 0.508, p = .490, power = 0.107). The addition of hypoxic postconditioning did not prevent oxidative-stress-induced cell death in response to either 3 h (c) or 24 h (d) of exposure to H2O2 (3 h: F(40, 1) = 0.472, p = .496, power = 0.103; 24 h: F(40, 1) = 0.384, p = .539, power = 0.093). Preconditioning with DFO protected SCs against H2O2-mediated cell death at 3 h (e), and 24 h (f) (3 h: F(40,1) = 321.9, p = 9.80e−21, power = 1.000, post hoc, 3.9–1000 μM, p < .05; 24 h: F(40,1) = 64.26, p = 7.51e−10, power = 1.000, post hoc, 31.3–125 μM, p < .05). Protection was also observed when DFO was included along with the administration of H2O2 at both 3 h (g) and 24 h (h) (3 h: F(40, 1) = 55.31, p = 5.15e−35, power = 1.000, post hoc, 7.8–125 μM, 1000 μM, p < .05; 24 h: F(40, 1) = 15.9, p = 2.72 e−4, power = 0.974, post hoc, 62.5–250 μM, p < .05). Similar to DFO, AQ enhanced the survival of SCs exposed to oxidative stress for 3 h ((i) F(40,1) = 155.9, p = 2.21e−15, power = 1.000, post hoc, 7.8–62.5 μM, 500 μM, p < .05). Unlike DFO, preconditioning with AQ did not lead to long-term protection ((j), 24 h: F(40,1) = 0.005, p = .946, power = 0.051). The addition of postconditioning enhanced the protection achieved with AQ at 3 h ((k) F(40, 1) = 103.2, p = 1.22e−12, power = 1.000, post hoc, 3.9, 15.6–250 μM, p < .05). It also induced protection at 24 h ((l) F(40, 1) = 11.8, p = .001, power = 0.919, post hoc, 16.6, 62.5–250 μM, p < .05). Multivariate ANOVAs with one-tailed Fisher’s LSD post hoc tests. Bar, H2O2 concentrations for which survival significantly differs from the preceding concentration. *, significantly different (p ≤ .05) between groups. Experiments were repeated three to four times, with three to four technical replicates each time, per condition, per time point. n = 3–4
FIGURE 7
FIGURE 7
Appearance and quantification of dead and live Schwann cells (SCs) in response to preconditioning with hypoxia or hypoxia-mimetics, with and without H2O2 exposure. SCs were preconditioned with hypoxia (1% O2, 24 h) or hypoxia-mimetics (deferoxamine [DFO], 200 μM, 24 h; adaptaquin [AQ], 10 μM, 16 h), exposed to the LD50 dose of H2O2 for 3 h and then stained (dead, NucGreen-488-positive; live, NucRed-647-positive). Preconditioned SCs had a similar morphology to control SCs in response to all three preconditioning treatments ((a) H2O2). There was no morphological evidence that the preconditioning treatments were toxic to the SCs (a). A small number of dead SCs were quantified in the preconditioned SCs not exposed to oxidative stress (b,d,f) and the number did not differ between preconditioned and control SC cultures ((b,d,f), post hoc, n.s., p > .05). Fewer live SCs were quantified in wells exposed to preconditioning treatments than untreated control SCs ((c,e,g)). The reduction was significant for DFO-SCs ((e) DFO-SCs, post hoc, t = 2.430, p = .024), showed a trend for AQ-SCs ((g) AQ-SCs, post hoc, t = 2.013, p = .064) and was not statistically significant for 1% O2-SCs ((c) 1% O2-SCs, post hoc, t = 1.009, p = .324). After exposure to oxidative stress, control SCs had a spherical morphology and lacked their distinctive elongated processes ((a), +H2O2). In response to exposure to H2O2, 1% O2-SCs showed a similar spherical morphology ((a), +H2O2). In contrast, DFO-SC and AQ-SC cultures contained fewer spherical cells and more elongated SCs following exposure to H2O2 ((a), +H2O2). Significantly more dead cells ((b), post hoc, t =2.767, p = .019) and fewer live cells ((c), post hoc, t = 2.531, p = .02) were quantified in 1% O2-treated SC cultures than in normoxic controls. Significantly fewer dead SCs ((d), t = 14.498, p = 9.4e−5) and more live SCs ((e), t =2.322, p = .03) were found in DFO-preconditioned SC cultures following exposure to H2O2. Significantly fewer dead cells were found in AQ-preconditioned cultures following exposure to H2O2 ((f), post hoc, t = 3.158, p = .002), but no difference in the number of live cells was detected ((g), t =1.361, p = .195). Statistics: multivariate ANOVAs followed by post hoc two-tailed t-tests, corrected for unequal variance where appropriate based on Levene’s test for equality of variances. LD50 was use for H2O2 concentrations: 1% O2, 31.25 μM; DFO and AQ: 62.5 μM. Scale, 10 μm. *, significantly different (p ≤ .05) between groups. n.s., not significant. Experiments contain 7–12 wells from 2 to 3 independent experimental replicates. n = 7–12

Similar articles

Cited by

References

    1. Aime P, Karuppagounder SS, Rao A, Chen Y, Burke RE, Ratan RR, & Greene LA (2020). The drug adaptaquin blocks ATF4/CHOP-dependent pro-death Trib3 induction and protects in cellular and mouse models of Parkinson’s disease. Neurobiology of Disease, 136, 104725. 10.1016/j.nbd.2019.104725 - DOI - PMC - PubMed
    1. Anderson KD, Guest JD, Dietrich WD, Bartlett Bunge M, Curiel R, Dididze M, Green BA, Khan A, Pearse DD, Saraf-Lavi E, Widerstrom-Noga E, Wood P, & Levi AD (2017). Safety of autologous human Schwann cell transplantation in subacute thoracic spinal cord injury. Journal of Neurotrauma, 34(21), 2950–2963. 10.1089/neu.2016.4895 - DOI - PubMed
    1. Aoki H, & Kunisada T (2016). Rest as a new transcription factor to control neural crest development. Single Cell Biology, 5(2). 10.4172/2168-9431.1000144 - DOI
    1. Appelhoff RJ, Tian YM, Raval RR, Turley H, Harris AL, Pugh CW, Ratcliffe PJ, & Gleadle JM (2004). Differential function of the prolyl hydroxylases PHD1, PHD2, and PHD3 in the regulation of hypoxia-inducible factor. The Journal of Biological Chemistry, 279(37), 38458–38465. 10.1074/jbc.M406026200 - DOI - PubMed
    1. Arany Z, Huang LE, Eckner R, Bhattacharya S, Jiang C, Goldberg MA, Bunn HF, & Livingston DM (1996). An essential role for p300/CBP in the cellular response to hypoxia. Proceedings of the National Academy of Sciences of the United States of America, 93 (23), 12969–12973. 10.1073/pnas.93.23.12969 - DOI - PMC - PubMed

Publication types

Substances

LinkOut - more resources