. 2021 Sep;75(9):2251-2268.
doi: 10.1111/evo.14272. Epub 2021 Jun 6.

Selection and isolation define a heterogeneous divergence landscape between hybridizing Heliconius butterflies

Affiliations

Selection and isolation define a heterogeneous divergence landscape between hybridizing Heliconius butterflies

Steven M Van Belleghem et al. Evolution. 2021 Sep.

Abstract

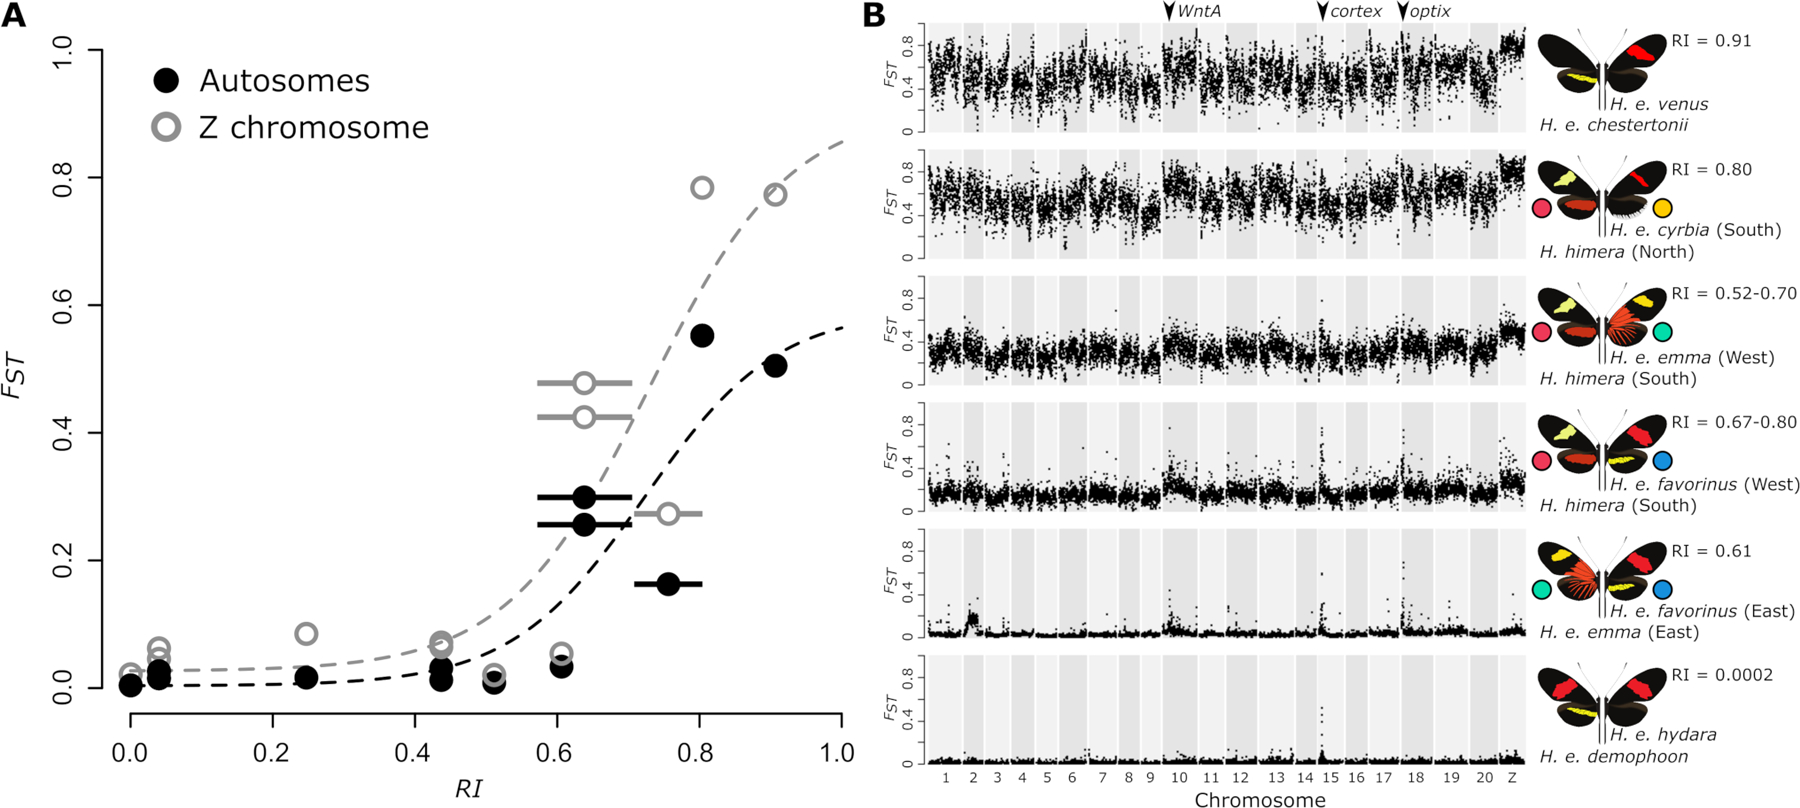
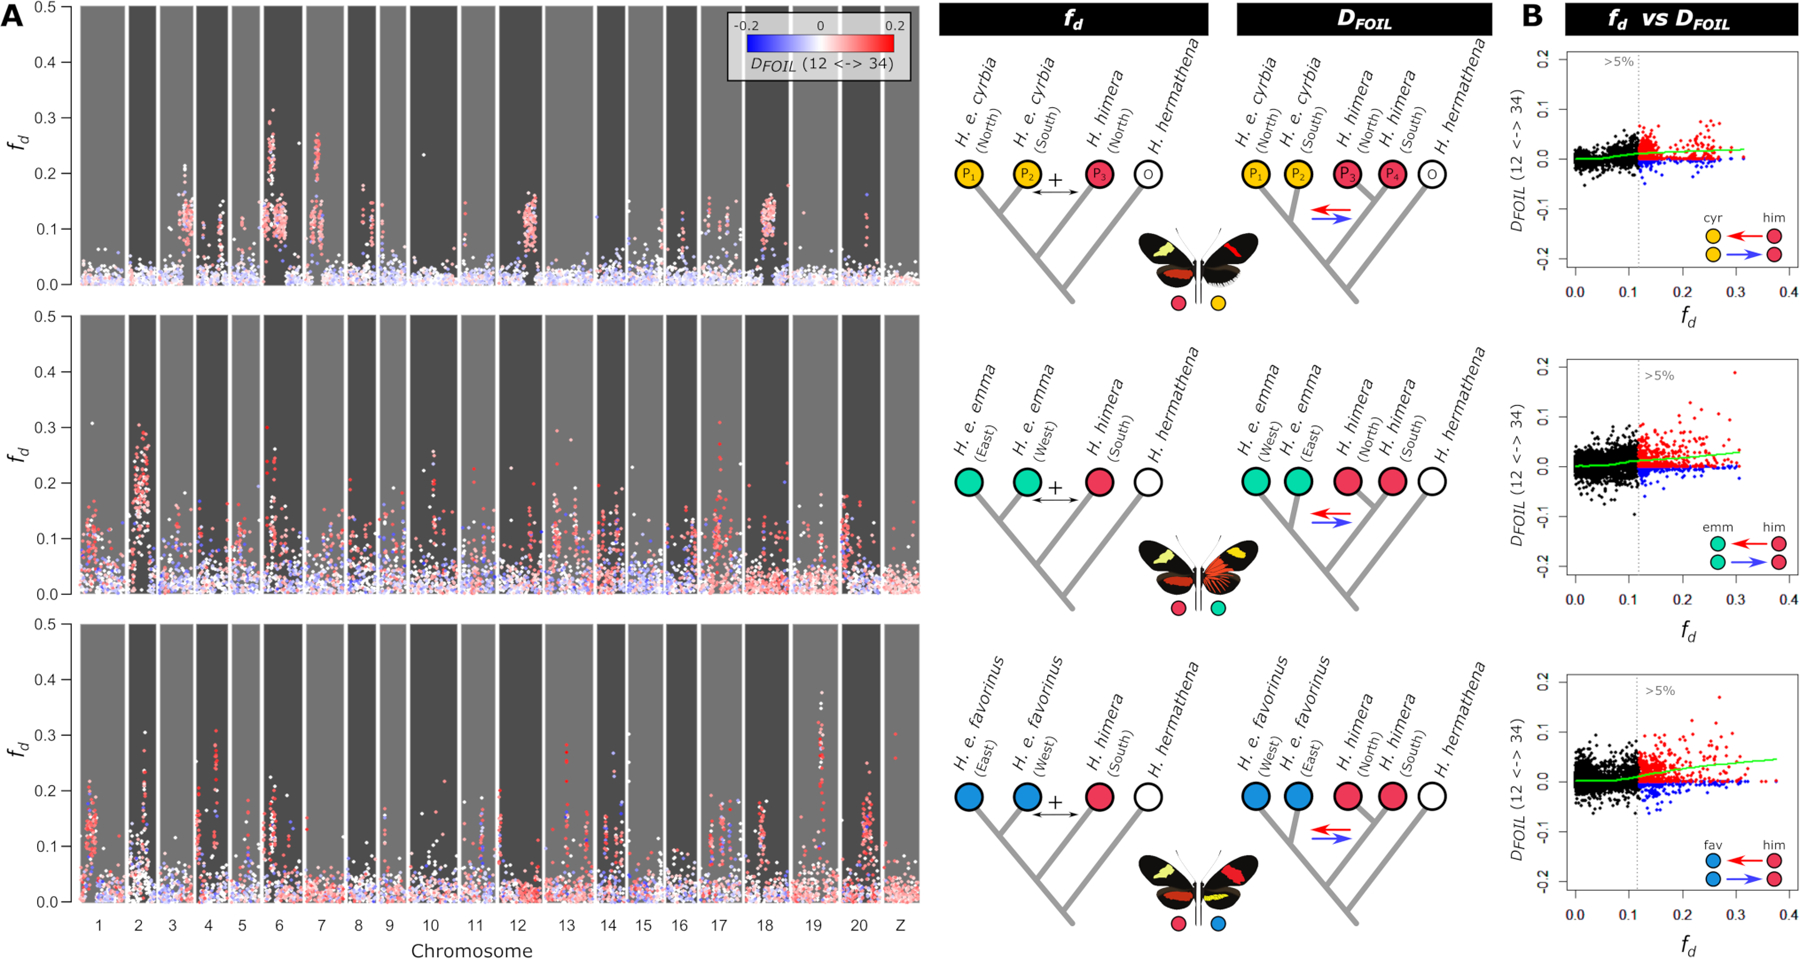
Hybridizing species provide a powerful system to identify the processes that shape genomic variation and maintain species boundaries. However, complex histories of isolation, gene flow, and selection often generate heterogeneous genomic landscapes of divergence that complicate reconstruction of the speciation history. Here, we explore patterns of divergence to reconstruct recent speciation in the erato clade of Heliconius butterflies. We focus on the genomic landscape of divergence across three contact zones of the species H. erato and H. himera. We show that these hybridizing species have an intermediate level of divergence in the erato clade, which fits with their incomplete levels of reproductive isolation. Using demographic modeling and the relationship between admixture and divergence with recombination rate variation, we reconstruct histories of gene flow, selection, and demographic change that explain the observed patterns of genomic divergence. We find that periods of isolation and selection within populations, followed by secondary contact with asymmetrical gene flow are key factors in shaping the heterogeneous genomic landscapes. Collectively, these results highlight the effectiveness of demographic modeling and recombination rate estimates to disentangling the distinct contributions of gene flow and selection to patterns of genomic divergence.

Keywords: Admixture; heterogeneous divergence; reproductive isolation; selection; species boundaries.


Conflict of interest statement

Conflict of Interest: The authors have no conflict of interest to declare.

Figures

Figure 1.
Figure 1.. Geographical distribution, population structure and phylogeny of the focal populations in relation to the Heliconius erato radiation.
(A) Maximum likelihood tree built using FastTree and using only autosomal sites from 121 whole genome resequenced individuals (see Figure S1 for the uncollapsed tree). Nodes in the tree that represent the major clades within H. erato (east and west of Andes) obtained high support (= 1) from the Shimodaira-Hasegawa test. (B) Principal Component Analysis (PCA) of the focal samples (colored points) among all the available whole genome data for the H. erato radiation (black points). (C) We sampled H. himera, H. e. cyrbia, H. e. emma and H. e. favorinus from two separate geographic areas each, indicated as North, South, East or West. The distribution of H. himera (red) covers dry valleys in the Andes of South Ecuador and North Peru. In the North, H. himera (N) comes into contact with a western H. e. cyrbia (S) population. In the South, H. himera comes into contact with an eastern H. e. emma (W) and H. e. favorinus (W) population. These contact zones are indicated with parenthesis.
Figure 2.
Figure 2.. Reproductive isolation and divergence among Heliconius erato populations.
(A) Genome-wide averages of relative divergence (FST) show a sharp increase with increasing measures of reproductive isolation between parapatric H. erato populations. The measure of reproductive isolation (RI) was obtained by weighting ecological (RIec), pre-isolation (RIpre) and post-isolation (RIpost) components using the method of Sobel and Chen (2014) (Table S2). Horizontal bars indicate a range of RI estimates based on uncertainties in RI components. Dashed lines indicate a non-linear least-squares fit for autosome (black) and Z chromosome (gray) relation between FST and RI. Higher relative divergence on the Z chromosome can be observed for the more divergent parapatric comparisons, however, incompatibilities that are potentially Z-linked have only been suggested for H. e. chestertonii crosses (Muñoz et al. 2010; Van Belleghem et al. 2018). (B) Plots of relative divergence (average FST in 50 kb windows) between parapatric H. erato populations along the genome. Plots are ordered according to the measure of reproductive isolation (RI). Colored circles match color codes used for the focal populations in this study. Divergence peaks on chromosome 10, 15 and 18 correspond to the divergently selected color pattern genes WntA (affecting forewing band shape), cortex (affecting yellow hindwing bar), and optix (affecting red color pattern elements), respectively (Van Belleghem et al. 2017).
Figure 3.
Figure 3.. Composite of best pairwise Secondary Contact (SC) demographic models of the H. himera and H. erato population history using ∂a∂i.
(A) Joint Site Frequency Spectra (JSFS) for data and best model (see Table S5 and Figure S2–3 for AIC values (Akaike Information Criterion)). (B) Reconstruction of historical demography of H. himera and H. erato populations using models with best AIC scores. All best models included a period of isolation and secondary contact. Arrows indicate effective migration rates (2Nam). Migration from H. himera into H. erato is indicated in orange, migration from H. erato into H. himera is indicated in blue. (C) Table with parameter ranges obtained from five best scoring models out of twenty runs. Na = ancestral population size, N1 = Size of population 1, N2 = size of population 2, g1 = growth coefficient of population 1, g2 = growth coefficient of population 2, ls = linked selection, Q = proportion of the genome with a reduced effective size due to linked selection (ls), m1<−2 = migration from population 2 into 1, m2<−1 = migration from populations 1 into 2, tsplit = split time, tSC = time of secondary contact, P = proportion of the genome evolving neutrally.
Figure 4.
Figure 4.. Admixture (fd) and admixture directionality (DFOIL) between H. himera and H. erato in three contact zones.
(A)Points show admixture (fd) values, whereas coloring shows directionality (DFOIL) in 50 kb non-overlapping windows for the contact zones H. himeraH. e. cyrbia (top), H. himeraH. e. emma (middle) and H. himeraH. e. favorinus (bottom). Blue indicates predominant admixture from H. erato into H. himera (12 -> 34), whereas red indicates predominant admixture from H. himera into H. erato (12 <- 34) based on the DFOIL tests. (B) Summary of admixture versus directionality with points above the 95% quantile indicated in blue (12 -> 34) and red (12 <- 34) demonstrates that the majority of windows with high fd indicate admixture from H. himera into H. erato. The green line indicates a loess fit of the data. Colored circles match color codes in Figure 1.
Figure 5.
Figure 5.. Divergence (FST), admixture (fd) and recombination rate (ρ) near the red color pattern gene optix.
(A) The optix gene is located near the start of chromosome 18 and has been demonstrated to control the expression of red color pattern elements in Heliconius wings (Reed et al. 2011). (B) Relative divergence (FST) and admixture (fd) comparisons performed between H. himera, H. e. cyrbia, H. e. emma and H. e. favorinus. Colored circles match color codes in Figure 2. (C) Lines show FST, fd and recombination rate (ρ) calculated in 50 kb non-overlapping windows. The green line in the bottom plot shows a loess fit of the recombination rate. Gene models including the location of the optix gene are presented at the top. (D) Relationship between FST and recombination rate (ρ) 500 kb left and right from the center of the optix regulatory sequence divergence peak. The relation between fd and recombination rate (ρ) is near zero and not shown.
Figure 6.
Figure 6.. Correlations of divergence and admixture proportions with recombination rate in the three H. himera – H. erato contact zones.
(A) Relative divergence (FST) versus population recombination rate (ρ). (B) Admixture proportion (fd) versus population recombination rate (ρ). (C) Relative divergence (FST) versus admixture proportion (fd). Statistics were calculated in 50 kb non-overlapping windows. Recombination rates were calculated from each H. erato population separately and averaged over populations (see methods) and showed a genome-wide average of ρ equal to 0.071 (SD = 0.026; ρ = 4Ner). Colored circles match geographic distributions and contact zones in Figure 2.
Figure 7.
Figure 7.. Expected relationship of recombination rate with divergence (FST) and admixture (fd) near a divergently selected locus.
(A) The population tree shows the simulated scenario with the onset of divergent selection on a derived allele indicated in red and in which migration rate (m) and migration time (tm) between P2 and P3 and selection start time (ts) are varied. Left and right of the simulated scenario are parameter combinations for two extreme scenarios that both include linked selection; on the left a scenario with Isolation with Migration (IM) and on the right a scenario reflecting Secondary Contact (SC). (B) Effect of population recombination rate (ρ) on relative divergence (FST) and admixture (fd) near a divergently selected locus for the two simulated scenarios with parameter combinations as in panel A. The selected allele occurs at position 0. The dashed red line indicates a locus at 500 kb from the selected locus at which the relationship between ρ, divergence and admixture is assessed in panel C. (C) The effect of migration start time (tm) and selection start time (ts) on the relation between ρ, divergence and admixture. Apart from the respective parameters being evaluated, other parameters were fixed as in panel A, with the red lines indicating the exact parameter combinations as in panel A and B. For simulations with a lower selection coefficient (s = 0.02), see Figure S8.

References

    1. Aeschbacher S, Selby JP, Willis JH, and Coop G. 2017. Population-genomic inference of the strength and timing of selection against gene flow. Proc. Natl. Acad. Sci 114:7061–7066. - PMC - PubMed
    1. Arias CF, Van Belleghem S, and McMillan WO. 2016. Genomics at the evolving species boundary. Curr. Opin. Insect Sci 13:7–15. Elsevier Inc. - PubMed
    1. Barton N, and Bengtsson BO. 1986. The barrier to genetic exchange between hybridising populations. Heredity (Edinb). 57:357–376. - PubMed
    1. Barton NH, and De Cara MAR. 2009. The evolution of strong reproductive isolation. Evolution. 63:1171–1190. - PubMed
    1. Berner D, and Roesti M. 2017. Genomics of adaptive divergence with chromosome-scale heterogeneity in crossover rate. Mol. Ecol 26:6351–6369. - PubMed

Publication types