. 2021 Jul 5;218(7):e20191766.
doi: 10.1084/jem.20191766. Epub 2021 May 21.

Antibodies against human endogenous retrovirus K102 envelope activate neutrophils in systemic lupus erythematosus

Affiliations

Antibodies against human endogenous retrovirus K102 envelope activate neutrophils in systemic lupus erythematosus

Maria Tokuyama et al. J Exp Med. .

Abstract

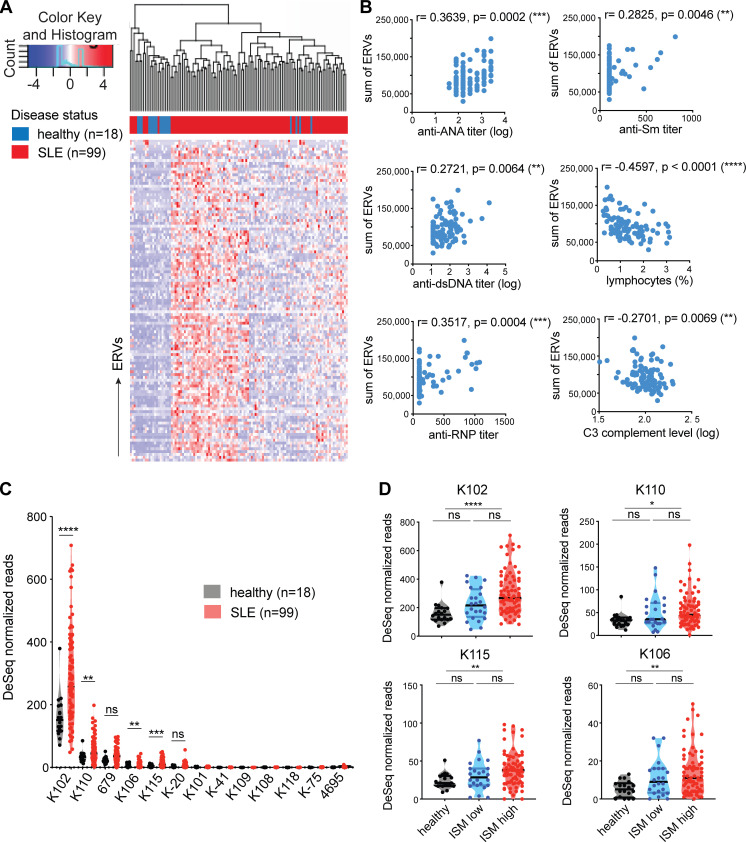
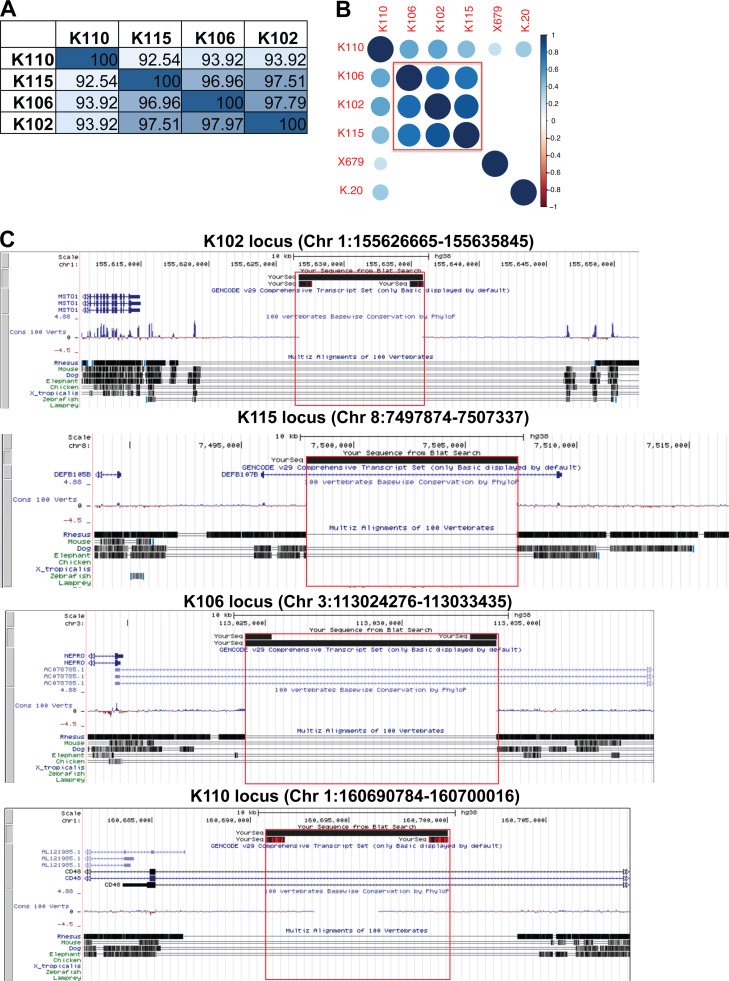
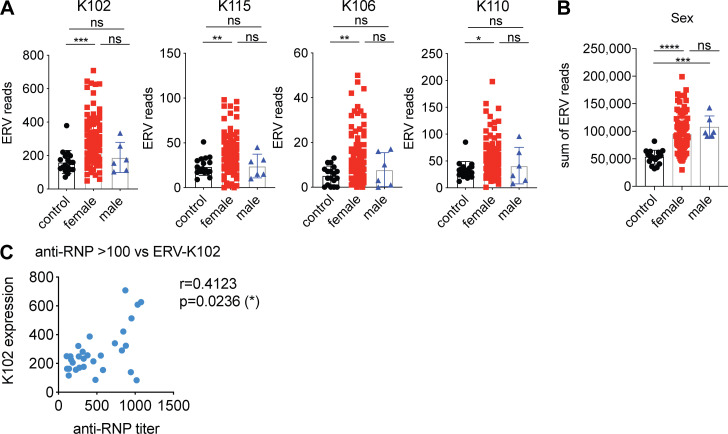
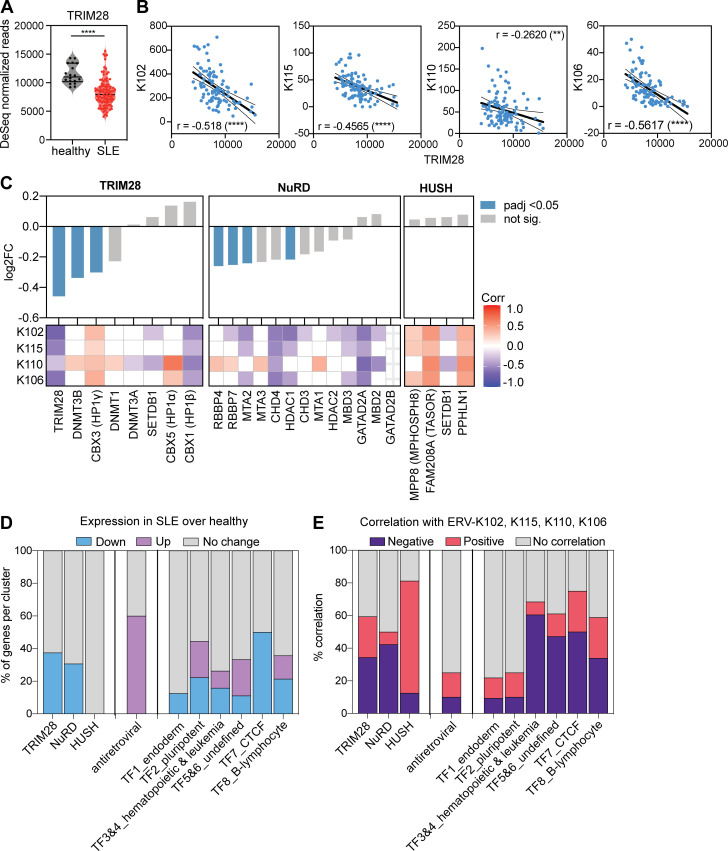
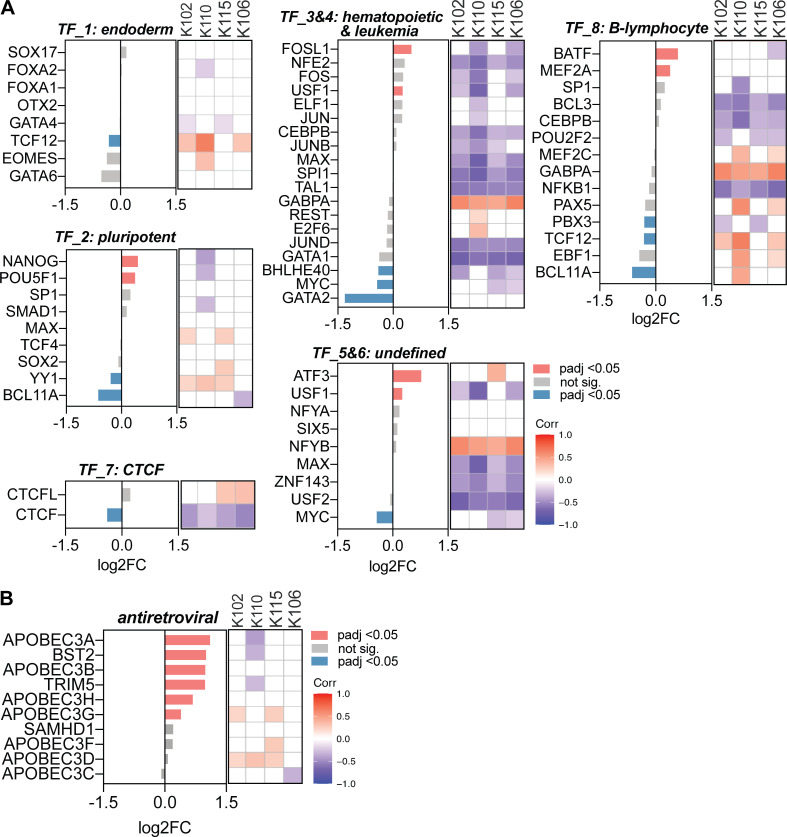
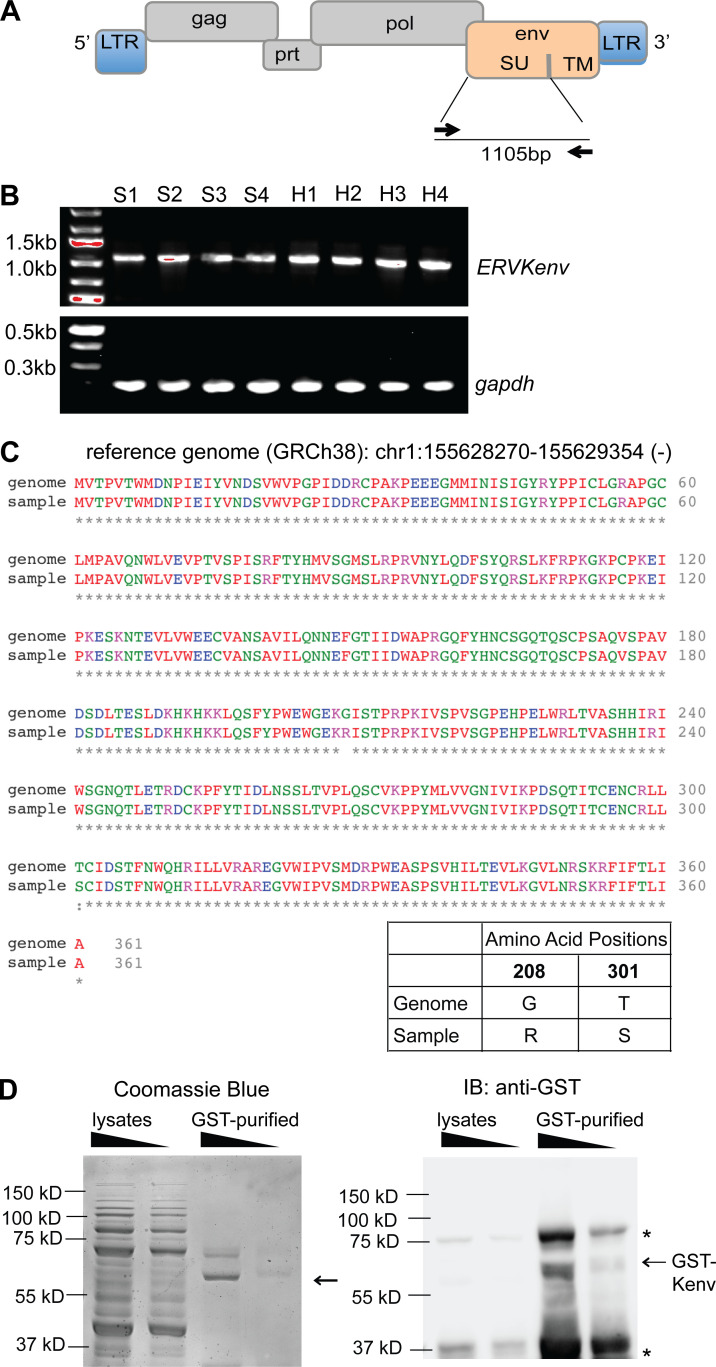
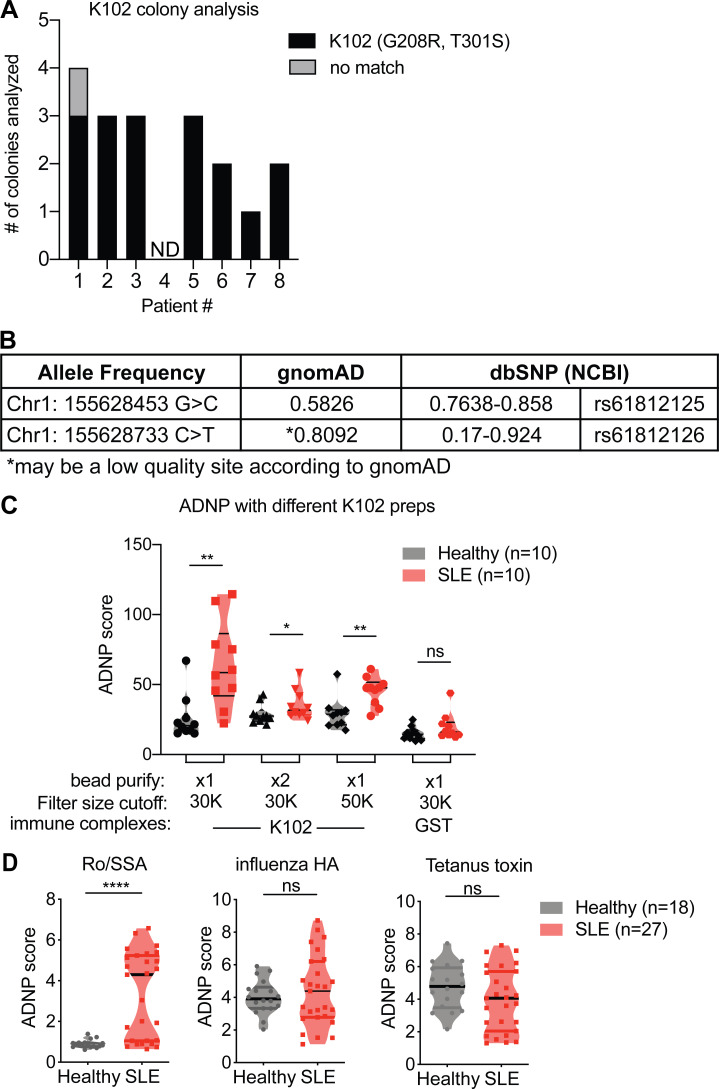
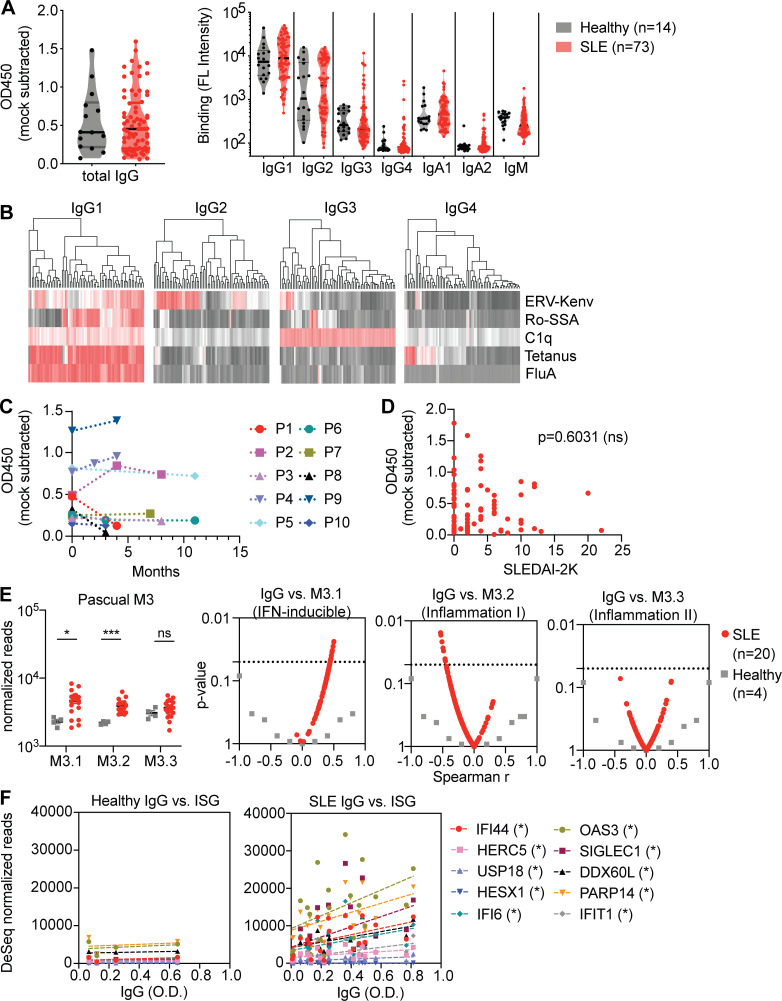
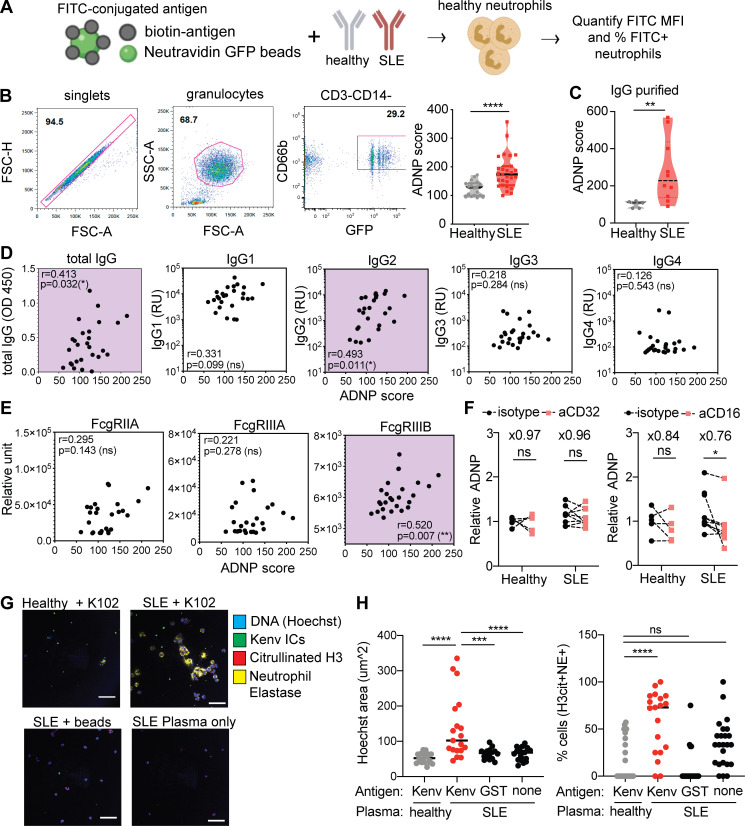
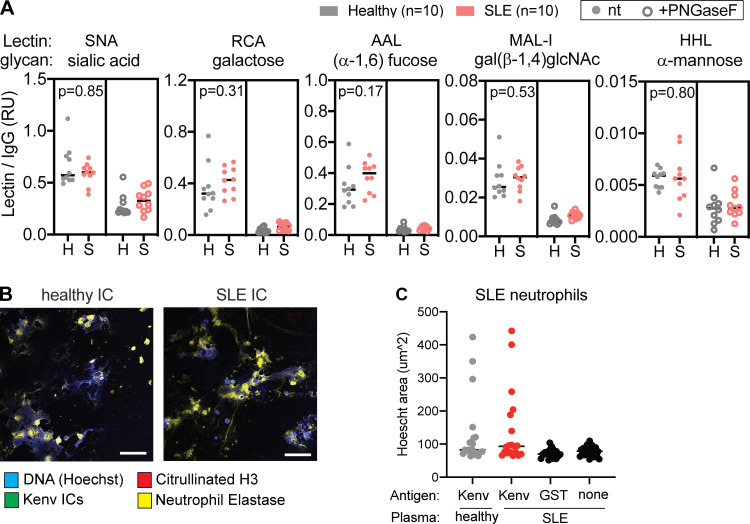
Neutrophil activation and the formation of neutrophil extracellular traps (NETs) are hallmarks of innate immune activation in systemic lupus erythematosus (SLE). Here we report that the expression of an endogenous retrovirus (ERV) locus ERV-K102, encoding an envelope protein, was significantly elevated in SLE patient blood and correlated with autoantibody levels and higher interferon status. Induction of ERV-K102 in SLE negatively correlated with the expression of epigenetic silencing factors. Anti-ERV-K102 IgG levels in SLE plasma correlated with higher interferon stimulated gene expression, and further promoted enhanced neutrophil phagocytosis of ERV-K102 envelope protein through immune complex formation. Finally, phagocytosis of ERV-K102 immune complexes resulted in the formation of NETs consisting of DNA, neutrophil elastase, and citrullinated histone H3. Together, we identified an immunostimulatory ERV-K envelope protein that in an immune complex with SLE IgG is capable of activating neutrophils.


Conflict of interest statement

Disclosures: M.J. Townsend reported "other" from Genentech, a member of the Roche Group, outside the submitted work. G. Alter reported "other" from Seromyx Systems Inc. and grants from Pfizer, GSK, BMS, Merck, Gilead, Novavax, Janssen, Sanofi outside the submitted work; in addition, G. Alter had a patent to Systems Serology Platform pending. A. Iwasaki reported grants from AbbVie during the conduct of the study; "other" from RIGImmune; and personal fees from InProTher and Boehringer Ingelheim outside the submitted work. No other disclosures were reported.

Figures

Figure 1.
Figure 1.
Human-specific envelope-coding ERV-K loci are elevated in lupus blood. ERVmap analysis of RNA-seq data from whole blood of healthy (n = 18) and SLE (n = 99) individuals was performed. (A) 113 significantly elevated ERV loci are depicted as a hierarchical cluster heatmap. (B) Spearman correlation between the sum of significantly elevated ERV read counts and levels of indicated clinical parameters. (C) Normalized read counts for ERV-K loci were compared between healthy and SLE samples. (D) Comparison of normalized ERV-K read counts between healthy (black), ISM low (blue), and ISM high (red) groups. Mann–Whitney t test was performed to calculate significance for C and D. *, P < 0.05; **, P < 0.01; ***, P < 0.001; ****, P < 0.0001. dsDNA, double-stranded DNA.
Figure S1.
Figure S1.
ERV-K102,K115,K106, and K110 sequences are similar and human specific. (A) Percent homology between the envelope SU sequences of the indicated ERV-K loci at the amino acid level. (B) Spearman correlation between normalized ERV-K read counts in SLE samples (n = 99). Scale bar represents Spearman r values and only showing correlations with P < 0.05. (C) UCSC genome browser outputs are displayed for each ERV-K locus to show absence of orthologous sequences in other vertebrate genomes. Red box indicates the full ERV-K locus. Chr, chromosome.
Figure S2.
Figure S2.
ERV-K expression is higher in females than males and correlates with anti-RNP titer. (A and B) Normalized ERV read counts for the indicated ERV-K loci (A) or sum of reads from the significantly elevated ERVs (B) were differentially plotted for females and males (control, n = 18; females, n = 93; males n = 6). Nonparametric one-way ANOVA analysis was performed to calculate statistical significance between groups. (C) Correlation plot of ERV-K102 read counts and anti-RNP titer for SLE patients with anti-RNP antibody titers over 100 (n = 30). *, P < 0.05; **, P < 0.01; ***, P < 0.001; ****, P < 0.0001.
Figure 2.
Figure 2.
Elevated ERV-K expression correlates with reduced epigenetic repressor expression. Using the same RNA-seq dataset as the ERVmap analysis, the cellular transcriptome was analyzed. (A) Read counts for TRIM28 in healthy donors (n = 18) and SLE patients (n = 99). Mann–Whitney t test was performed to calculate significance. ****, P < 0.0001. (B) Linear regression analysis on correlation between normalized read counts for ERV-K102, K115, K106, K110, and TRIM28. r, Pearson r. (C) Differential expression of the indicated epigenetic repressor genes between healthy donors and SLE patients grouped by repressor complexes. log2FC, log2 fold change of gene expression in SLE compared with healthy. Statistical significance (adjusted P value [padj]) calculated by DESeq2. Heatmap of correlation between ERV-K and indicated genes showing Spearman r values (1 to −1) for significant correlations (P < 0.05). White grids, no significant correlation. (D) Percent of genes within each cluster that are significantly different between healthy donors and SLE patients (DESeq2, padj < 0.05). (E) Percentage of genes that significantly correlate with ERV-K loci (Spearman correlation, P < 0.05).
Figure S3.
Figure S3.
Correlation between ERV-K expression and differentially expressed transcription factors and antiretroviral factors. (A and B) Differential expression of genes in SLE over healthy (log2FC) for the indicated transcription factors (A) and antiretroviral factors (B). Differential expression and padj was determined using DESeq2 comparing SLE patients (n = 99) and healthy donors (n = 18). Spearman correlation between normalized ERV-K read counts versus indicated genes were plotted in R studio. Spearman r correlation values are colored according to the legend. Blank boxes, not significant. Corr, correlation; TF, transcription factor.
Figure 3.
Figure 3.
Generation of recombinant envelope protein encoded by the ERV-K102 locus. (A) Schematic representation of the proviral structure of ERV-K sequence and the positions for the primers to amplify the SU of the envelope are indicated as arrows. TM, transmembrane. (B) DNA agarose gels of products from PCR amplification of ERV-K envelope SU and gapdh from healthy (H; n = 4) and SLE (S; n = 4) PBMC cDNA. (C) Amino acid sequence alignment between the reference ERV-K102 sequence (hg38) and the dominant product amplified from PBMC cDNA. Amino acid differences at positions 208 and 301 are depicted. (D) GST-purified recombinant ERV-K102 envelope SU analyzed by Coomassie blue staining and Western blot with anti-GST antibody. Asterisks indicate nonspecific bands. IB, immunoblot.
Figure S4.
Figure S4.
ERV-K102 cDNA sequence analysis and ADNP with different K102 protein preps and other antigens. (A) Sequencing analysis of ERV-K102 DNA amplified from SLE PBMC cDNA and cloned into a sequencing vector. BLAT results against for each of the inserts against hg38 per SLE patient (n = 8). No match, no alignment between insert and hg38. (B) Summary of the allele frequency for Chr1: 155628453 G>C (T301S) and Chr1: 155628733 C>T (G208R). (C) ADNP assay with immune complexes containing recombinant ERV-K SU envelope protein that were purified through an additional round of GST-bead purification or larger cutoff spin columns. Purified GST was used as a negative control. (D) ADNP assay with immune complexes containing the indicated antigens and healthy or SLE plasma. Mann–Whitney t test was performed to calculate statistical significance. *, P < 0.05; **, P < 0.01; ****, P < 0.0001.
Figure 4.
Figure 4.
Neutrophil activation by SLE IgG in an immune complex with ERV-K102 envelope protein. (A) Total IgG against recombinant ERV-K102 envelope SU measured by ELISA and IgG subclasses measured by Luminex assay in healthy (n = 14) and SLE (n = 73) plasma. (B) Hierarchical clustering of IgG levels in SLE patients for the indicated antigens and IgG subclasses measured by Luminex assay. FL, fluorescence. (C) Total anti-ERV-K102 IgG levels in SLE patients over the indicated months. Each line represents an individual patient (P; n = 10). (D) Correlation between anti-ERV-K102 IgG levels as measured by ELISA and SLEDAI-2K score obtained at the time of blood collection for SLE patients (n = 79). Spearman correlation analysis was performed. (E) Comparison of read counts for genes within M3.1, 3.2, and 3.3 modules between healthy (n = 4) and SLE (n = 20). Mann–Whitney t test was performed to calculate significance (*, P < 0.05; ***, P < 0.001). Volcano plot of Spearman r values obtained from correlation analysis between anti-ERV-K102 IgG levels and total read counts for genes in the indicated modules. Each dot represents an individual and dotted line is at P = 0.05. (F) Spearman correlation between read counts for the indicated genes versus total anti-ERV-K102 IgG levels measured by ELISA. *, P < 0.05.
Figure 5.
Figure 5.
ERV-K102 envelope immune complexes with SLE IgG induce higher neutrophil phagocytosis and neutrophil activation. (A) ADNP assay scheme. (B) Gating strategy for quantification of ADNP by flow cytometry and ADNP of healthy (n = 18) and SLE (n = 27) immune complexes. (C) ADNP of ERV-K102 immune complexes made with purified IgG from healthy and SLE plasma. Significance was calculated using the Mann–Whitney t test. **, P < 0.01; ****, P < 0.0001. (D and E) Spearman correlation between anti-ERV-K102 IgG levels (D) or ERV-K102 immune complex binding to FcγRs (E) and ADNP for SLE samples (n = 26). *, P < 0.05; **, P < 0.01. (F) ADNP of ERV-K102 immune complexes (healthy, n = 5; and SLE, n = 10) in neutrophils pretreated with isotype IgG, anti-CD32, or anti-CD16 IgG. Relative ADNP was calculated based on the average ADNP score for healthy samples. Average fold difference between isotype- and specific antibody–treated samples is indicated above each condition. Mann–Whitney t test was used to calculate statistical significance. *, P < 0.05. (G) Representative confocal images of neutrophils treated with ERV-K102 immune complexes or indicated controls for healthy (n = 5) and SLE (n = 5) plasma. Hoechst (blue), citrullinated histone H3 (red), neutrophil elastase (yellow), and FITC-conjugated immune complexes (green) are shown. Data are representative of two or more repeated experiments. (H) Area of Hoechst nuclear DNA staining (square millimeters) was measured per cell in ImageJ. The average area of four cells per image is plotted. For each condition for each donor plasma, four images were recorded, and four cells were measured per image. Scale bars, 75 µm. The percentage of neutrophils that costained with of citrullinated histone H3 and neutrophil elastase per image was calculated. One-way ANOVA with multiple comparisons was performed to calculate statistical significance. ***, P < 0.001; ****, P < 0.0001. FSC-A, forward scatter A; FSC-H, forward scatter H; IC, immune complex; SSC-A, side scatter A.
Figure S5.
Figure S5.
Glycan modifications of anti-ERV-K102 IgG and NETosis in SLE neutrophils. (A) Glycan modifications on anti-ERV-K102 IgG (healthy and SLE) detected using biotinylated lectins and quantified by a Luminex assay. Lectin binding was quantified for untreated IgG (left panel) and PNGase F–treated IgG (right panel). Relative units were calculated by normalizing MFI of each lectin signal by MFI of total human IgG for each sample. Mann–Whitney t test was performed to calculate statistical significance. *, P < 0.05; **, P < 0.01. (B) Representative microscopy images of neutrophils from SLE patients stimulated with ERV-K102 immune complexes (ICs) generated with healthy plasma (n = 5) or SLE plasma (n = 5). (C) NETs were quantified by measuring the area of Hoechst staining per cell in ImageJ. For each condition per donor plasma, four images were recorded, four cells were measured per image, and the average area per image was plotted. Scale bars, 75 µm. RU, relative unit.

References

    1. Absher, D.M., Li X., Waite L.L., Gibson A., Roberts K., Edberg J., Chatham W.W., and Kimberly R.P.. 2013. Genome-wide DNA methylation analysis of systemic lupus erythematosus reveals persistent hypomethylation of interferon genes and compositional changes to CD4+ T-cell populations. PLoS Genet. 9:e1003678. 10.1371/journal.pgen.1003678 - DOI - PMC - PubMed
    1. Andrews, B.S., Eisenberg R.A., Theofilopoulos A.N., Izui S., Wilson C.B., McConahey P.J., Murphy E.D., Roths J.B., and Dixon F.J.. 1978. Spontaneous murine lupus-like syndromes. Clinical and immunopathological manifestations in several strains. J. Exp. Med. 148:1198–1215. 10.1084/jem.148.5.1198 - DOI - PMC - PubMed
    1. Anwar, F., Davenport M.P., and Ebrahimi D.. 2013. Footprint of APOBEC3 on the genome of human retroelements. J. Virol. 87:8195–8204. 10.1128/JVI.00298-13 - DOI - PMC - PubMed
    1. Ballestar, E., and Li T.. 2017. New insights into the epigenetics of inflammatory rheumatic diseases. Nat. Rev. Rheumatol. 13:593–605. 10.1038/nrrheum.2017.147 - DOI - PubMed
    1. Banki, K., Maceda J., Hurley E., Ablonczy E., Mattson D.H., Szegedy L., Hung C., and Perl A.. 1992. Human T-cell lymphotropic virus (HTLV)-related endogenous sequence, HRES-1, encodes a 28-kDa protein: a possible autoantigen for HTLV-I gag-reactive autoantibodies. Proc. Natl. Acad. Sci. USA. 89:1939–1943. 10.1073/pnas.89.5.1939 - DOI - PMC - PubMed

Publication types

MeSH terms