. 2021 Jul 2;49(W1):W15-W20.
doi: 10.1093/nar/gkab377.

Amino Acid Interactions (INTAA) web server v2.0: a single service for computation of energetics and conservation in biomolecular 3D structures

Affiliations

Amino Acid Interactions (INTAA) web server v2.0: a single service for computation of energetics and conservation in biomolecular 3D structures

Jiří Vymětal et al. Nucleic Acids Res. .

Abstract

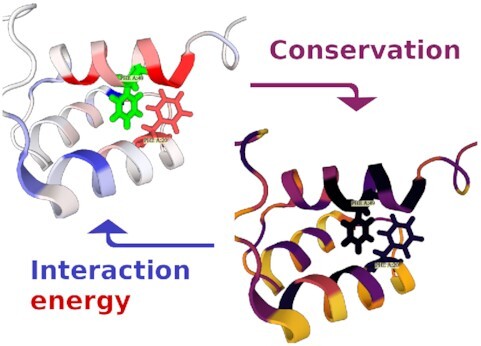
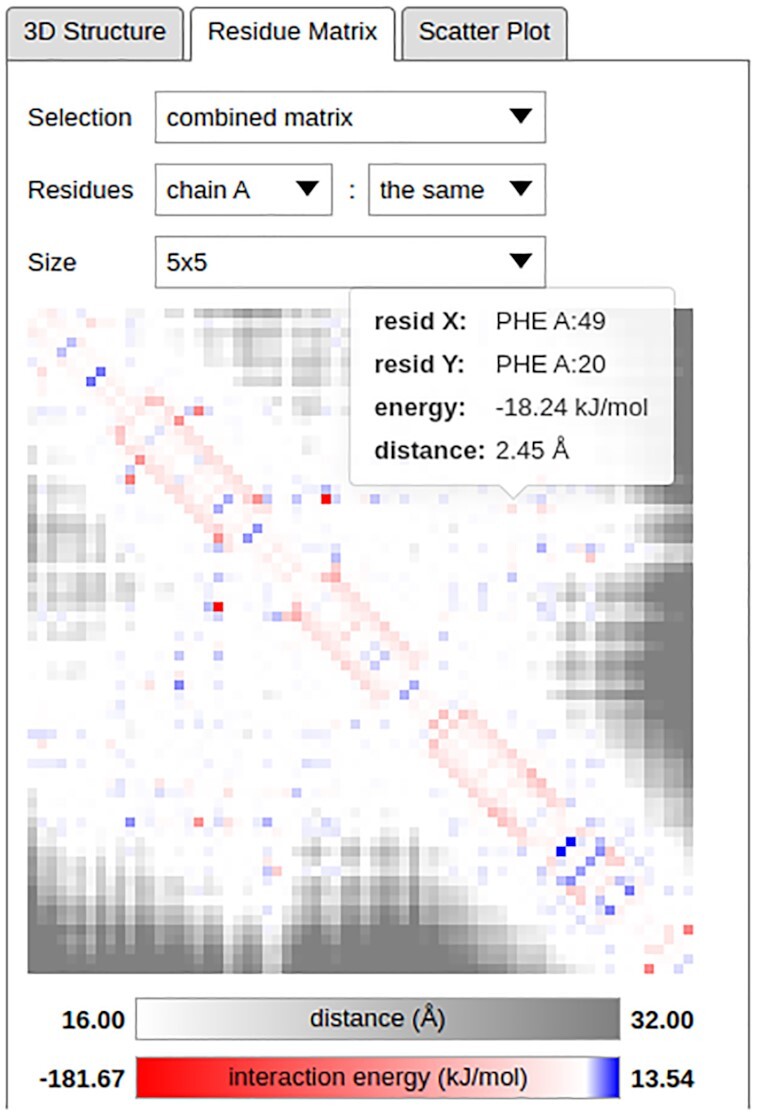
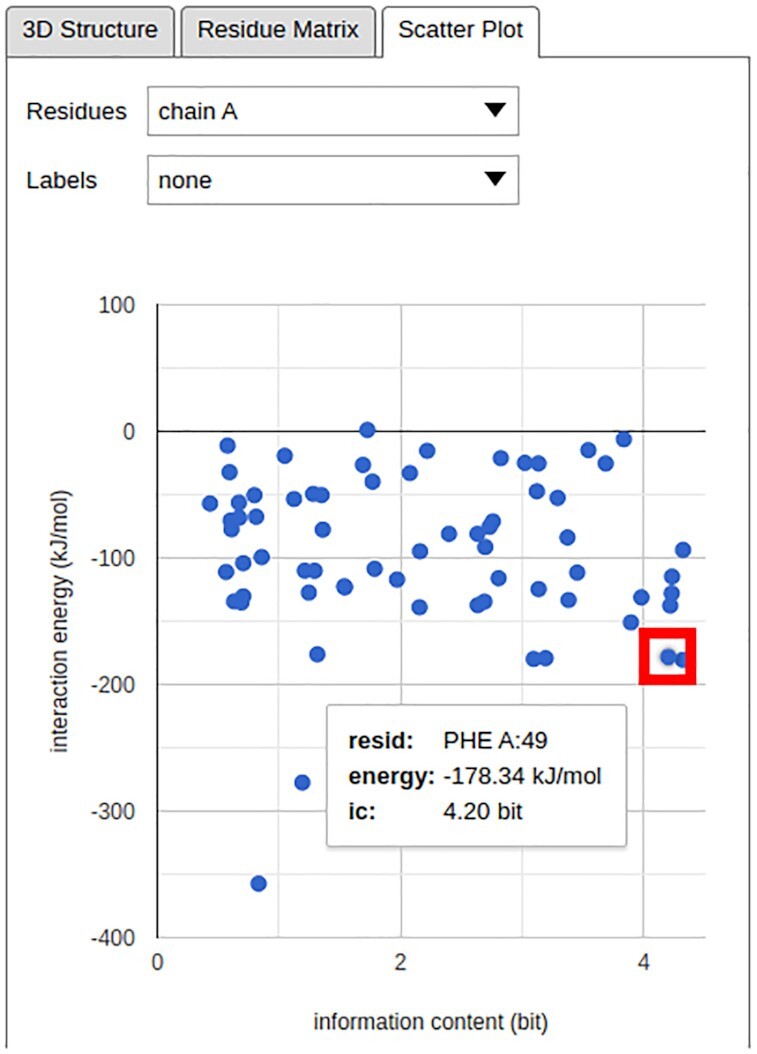
Interactions among amino acid residues are the principal contributor to the stability of the three-dimensional structure of a protein. The Amino Acid Interactions (INTAA) web server (https://bioinfo.uochb.cas.cz/INTAA/) has established itself as a unique computational resource, which enables users to calculate the contribution of individual residues in a biomolecular structure to its total energy using a molecular mechanical scoring function. In this update, we describe major additions to the web server which help solidify its position as a robust, comprehensive resource for biomolecular structure analysis. Importantly, a new continuum solvation model was introduced, allowing more accurate representation of electrostatic interactions in aqueous media. In addition, a low-overhead pipeline for the estimation of evolutionary conservation in protein chains has been added. New visualization options were introduced as well, allowing users to easily switch between and interrelate the energetic and evolutionary views of the investigated structures.


Figures

Graphical Abstract
Graphical Abstract
The Amino Acid Interactions (INTAA) web server is a unique computational resource which newly allows its users to interactively inspect both energetic and evolutionary properties of biomolecular structures.
Figure 1.
Figure 1.
The 3D structure of the Antennapedia homeodomain from Drosophila (PDB ID 1HOM) analyzed using the IEM web service. As the hydrogen atoms were already present in the structure, none needed to be added. The IEs were calculated using the CHARMM36 FF (25) and the new OBC-II continuum solvation model. The central section of the UI features two tables of IE values. In the table on the left, the amino acid residues have been sorted according to their total IEs, with the ones displaying the most energetically favorable interactions at the top [the residues can be sorted according to any of the displayed features as described in the previous publication (5)]. The IC values calculated for each residue using the new conservation calculation pipeline have been added to this table. Once a residue is selected (in this example, Phe49), the table on the right side shows the pairwise IEs for its interactions with the other residues in the structure. These IEs can be sorted as well and the most favorable pairwise interactions can thus be identified for each residue. In this example, Phe20 is selected in the table on the right. It can be seen that the pairwise noncovalent interaction between the two selected residues is among the most energetically favorable. The integrated molecular structure viewer in the right section of the UI displays the investigated structure in cartoon representation; any residues selected within the central tables are highlighted in stick representation. The most notable additions to the web service and UI updates are highlighted in bold rectangles. The top magenta rectangle highlights the new IE Component drop-down menu. Here, the user can choose between the display of the Coulomb, Lennard-Jones, or complete (Coulomb + Lennard-Jones) IEs in the application. The bottom green rectangle highlights a window relating the primary sequence, the one-dimensional (1D) IE profile, and the 1D conservation profile for the residues in the structure. The window is interactive and enables the IE and IC values for individual residues to be displayed numerically. The top right blue rectangle highlights the selection boxes for the new visualization options. The Selection drop-down menu in the 3D Structure tab allows the user to switch between total IE-, pairwise IE-, or conservation-based mark-ups for the investigated structure. In this example, conservation is selected, and the per-residue IC values are projected onto the structure. It can be seen that the two selected Phe residues are involved in the hydrophobic core of the homeodomain and are both highly conserved, in agreement with the known evolutionary properties of the domain family (24). Switching to the Residue Matrix tab allows the user to visualize and interact with the IE and distance matrices; switching to the Scatter Plot tab allows the user to interrelate the total IEs and IC values for the selected residues using an interactive 2D plot. These are described in greater detail in Figures 2 and 3, respectively. Finally, the top red rectangle highlights the new Action drop-down menu. This menu provides access to advanced IEM export options, configuration options, as well as a button for providing feedback to the developers.
Figure 2.
Figure 2.
Detailed view of the IE and distance matrices corresponding to the structure investigated in Figure 1. The combined matrix has been chosen for visualization in the Selection drop-down menu, meaning that IEs are shown in the matrix viewer for residue pairs with any pair of atoms at or below a distance threshold and distances are shown for residue pairs further apart. An alternative, COM-based distance definition can be toggled using the Configure dialog in the new Action drop-down menu (Figure 1); the thresholds can be configured using this menu as well. The investigated structure contains only a single chain and the Residues drop-down menu selections thus lead to a symmetric matrix being displayed. Finally, the Size drop-down menu can be used to adjust the dimensions of the matrix elements. In this example, the Phe49–Phe20 pair investigated in Figure 1 has been highlighted in the matrix viewer, and the IE for its pairwise interaction and the closest distance between the residues’ atoms are shown.
Figure 3.
Figure 3.
The total IE–IC value relations for the residues in the structure investigated in Figure 1. The single chain in the investigated structure has been selected using the Residues drop-down menu; the Labels drop-down menu can be used to add textual identifiers to individual points in the plot. In this example, the position of Phe49 in the scatter plot has been highlighted in a red rectangle, and its total IE and IC value are shown.

References

    1. Bendová-Biedermannová L., Hobza P., Vondrášek J.. Identifying stabilizing key residues in proteins using interresidue interaction energy matrix. Proteins. 2008; 72:402–413. - PubMed
    1. Vondrášek J., Bendová L., Klusák V., Hobza P.. Unexpectedly strong energy stabilization inside the hydrophobic core of small protein rubredoxin mediated by aromatic residues: correlated ab initio quantum chemical calculations. J. Am. Chem. Soc. 2005; 127:2615–2619. - PubMed
    1. Celniker G., Nimrod G., Ashkenazy H., Glaser F., Martz E., Mayrose I., Pupko T., Ben-Tal N.. ConSurf: using evolutionary data to raise testable hypotheses about protein function. Isr. J. Chem. 2013; 53:199–206.
    1. Jakubec D., Vondrášek J., Finn R.D.. 3DPatch: fast 3D structure visualization with residue conservation. Bioinformatics. 2019; 35:332–334. - PMC - PubMed
    1. Galgonek J., Vymetal J., Jakubec D., Vondrasek J.. Amino Acid Interaction (INTAA) web server. Nucleic. Acids. Res. 2017; 45:W388–W392. - PMC - PubMed

Publication types