. 2021 May 20;81(10):2183-2200.e13.
doi: 10.1016/j.molcel.2021.04.015.

Targeting histone acetylation dynamics and oncogenic transcription by catalytic P300/CBP inhibition

Affiliations

Targeting histone acetylation dynamics and oncogenic transcription by catalytic P300/CBP inhibition

Simon J Hogg et al. Mol Cell. .

Abstract

To separate causal effects of histone acetylation on chromatin accessibility and transcriptional output, we used integrated epigenomic and transcriptomic analyses following acute inhibition of major cellular lysine acetyltransferases P300 and CBP in hematological malignancies. We found that catalytic P300/CBP inhibition dynamically perturbs steady-state acetylation kinetics and suppresses oncogenic transcriptional networks in the absence of changes to chromatin accessibility. CRISPR-Cas9 screening identified NCOR1 and HDAC3 transcriptional co-repressors as the principal antagonists of P300/CBP by counteracting acetylation turnover kinetics. Finally, deacetylation of H3K27 provides nucleation sites for reciprocal methylation switching, a feature that can be exploited therapeutically by concomitant KDM6A and P300/CBP inhibition. Overall, this study indicates that the steady-state histone acetylation-methylation equilibrium functions as a molecular rheostat governing cellular transcription that is amenable to therapeutic exploitation as an anti-cancer regimen.

Keywords: H3K27ac; P300/CBP; cancer; chromatin biology; epigenetics; histone acetylation; histone deacetylase; histone methylation; lysine acetylation; transcription.


Conflict of interest statement

Declaration of interests The Johnstone laboratory receives funding support from Roche, Bristol Myers Squibb (BMS), AstraZeneca, and MecRx. R.W.J. is a shareholder in and consultant for MecRx. A.L. and K.D.B. are employees of and shareholders in AbbVie. A.S. has participated on advisory boards for and received research funding from Celgene, Juno, BMS, Janssen-Cilag, Novartis, Amgen, Haemalogix, Abbvie, and Takeda. J.S. has participated on advisory boards for and received honoraria from Celgene. O.A.-W. has served as a consultant for H3B Biomedicine, Foundation Medicine Inc., Merck, Prelude Therapeutics, and Janssen; is on the scientific advisory boards of Envisagenics Inc., Pfizer Boulder, and AIChemy Inc.; and has received prior research funding from Loxo Oncology and H3 Biomedicine. J.D.L. is a scientific adviser to the Samuel Waxman Cancer Research Foundation. All other authors declare no competing interests.

Figures

Figure 1.
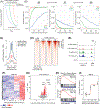
Figure 1.. Catalytic P300/CBP inhibition selectively disrupts cell type-specific transcription
(A) Apoptosis of MM cell lines treated for 72 hours with A-485. Mean ± SEM. (B) Kaplan-Meier survival curve of NSG mice bearing MM1.S and treated with A-485 or DMSO vehicle. (C) Schema isolation of primary MM specimens. (D) Change in viability for primary MM specimen following 72 hours with A-485. (E) RNA-Seq in MM1.S cells treated with μM A-485 for 2 hours. Genes in red indicate absolute log2 fold-change>1 and FDR<0.01. (F) GSEA of A-485 response in e. (G) Correlation of log2 fold-change in gene expression between MM1.S and primary MM patients (n=4) (H) Schema for processing of primary CLL specimen for single-cell genomics. (I) UMAP dimensionality reduction on scRNA-seq data from CLL specimen treated ex vivo with A-485 or DMSO. (J) Heatmap of differentially expressed genes in response to A-485. (K) Gene ontology on differentially expressed genes.
Figure 2.
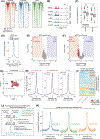
Figure 2.. Genome-wide hypoacetylation is not associated with alterations in chromatin accessibility
(A) H3K27ac, H3K18ac, and P300 ChIP-Rx from MM1.S cells treated with μM A-485 for 2 hours. Heatmaps centered on ATAC-Seq accessible regions. (B) Genome browser view of ChIP-Rx at the IL6R locus. (C) Quantification of promoter and enhancer H3K27ac by A-485 at 2 and 6 hours (Wilcoxon signed-rank test, ***p-value<0.0001). (D) ATAC-Seq signal in MM1.S cells treated for 2 or 6 hours with A-485 (1μM), centered on ATAC-Seq accessible regions ± 2.5 kb. Differential ATAC-Seq accessibility at (E), 2 hours, and (F), 6 hours. Accessible regions in red/blue indicate absolute log2 fold-change>1 and FDR<0.01. (G) UMAP of snATAC-Seq from CLL specimen treated ex vivo with A-485 or DMSO. (H) Pseudo-bulk analysis of snATAC-Seq signal across cell cluster-specific accessible regions. (I) Heatmap of log2 fold-change snATAC-Seq signal within promoter regions of significant DEGs (from Figure 1J). (J) Schematic for NOMe-Seq. (K) Nucleosome-free region GpC methylation centered on A-485 hypersensitive accessible regions (bin #1, Figure 3A) in MM1.S cells.
Figure 3.
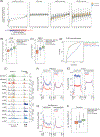
Figure 3.. P300/CBP are required for transcriptional co-activator and RNA polymerase II recruitment
(A) Log2 fold-change in H3K27ac, ATAC-Seq, BRD4, and BRD2 across accessible regions binned on the loss of H3K27ac following A-485 treatment. (B) Log2 fold-change in mRNA of genes for which promoter deacetylation is classified as more sensitive, sensitive, or less sensitive. (C) Log2 fold-change in BRD4 binding at promoters classified as more sensitive, sensitive, or less sensitive. (D) ROC curve for classification of A-485 hypersensitive genes by differential H3K27ac, BRD4, and ATAC-Seq responses. (E) Genome browser view of the IRF4 locus and its upstream enhancer (across the DUSP22 locus). (F) PRO-Seq signal across the gene body of genes preferentially suppressed or not suppressed by A-485 in MM1.S cells. (G) TT-Seq signal across the gene body of genes preferentially suppressed and not suppressed by A-485 in MM1.S cells. (H) Total RNA Pol II ChIP-Rx signal across the gene body of genes preferentially suppressed and not suppressed by A-485 treatment in MM1.S cells. (I) Log2 fold-change in total RNA Pol II ChIP-Rx signal from promoter regions for which promoter deacetylation is classified as more sensitive, sensitive, or less sensitive.
Figure 4.
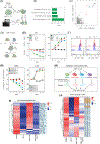
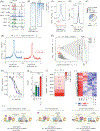
Figure 4.. Histone deacetylation kinetics are controlled by NCOR/SMRT co-repressor complexes
(A) Schema of CRISPR/Cas9 resistance screen. (B) GO analysis of significantly enriched genes. (C) Enrichment of individual genes from two replicate screens. Red indicates genes with P-Value<0.0001 in both screens. (D) Schema of competitive proliferation assays. (E) Outgrowth of MM1.S cells treated with A-485 or DMSO vehicle from competitive proliferation assays. Data presented is a representative experiment with mean ± SEM for 3 technical triplicates measurements. (F) Representative histogram of CTV fluorescence in an NCOR1 depleted and NCOR1 WT MM1.S cell line at day 0 (TO) and following treatment for 96 hours with A-485 (1μM) or DMSO. (G) Outgrowth of MM1.S cells treated with A-485 or DMSO vehicle from competitive proliferation assays. Data presented is a representative experiment with mean ± SEM for 3 technical triplicates measurements. (H) Schematic for global acetylome profiling by mass spectrometry. Heatmap showing average of normalized relative log2 expression (nRLE) values of (I) non-histone and (J) histone acetyl-lysine sites significant for adjusted p-value < 0.05.
Figure 5.
Figure 5.. Perturbations of the steady-state acetylation equilibrium overcome catalytic P300/CBP inhibition
(A) Heatmap and (B) average binding profile of ChIP-Seq binding NCOR1, HDAC3, P300, and H3K27ac in MM1.S cells centered on ATAC-Seq accessible regions ± 2.5 kb. (C) Quantification of ChIP-seq data from (B) by calculating average mean ChIP-seq signal per factor across clusters. (D) Normalized expression (CPM) of MYC mRNA in NCOR1 depleted or WT MM1.S cells by RNA-Seq. (E) GSEA analysis of NCOR1 depleted cells (NCOR1–1) compared to NCOR1 WT MM1.S cells. (F) Log2 fold-change of A-485 suppressed genes (Log2 fold-change<−1 and FDR<0.01 in parental MM1.S cells) following treatment of NCOR1 depleted (sgNCOR1–1, sgNCOR1–2) or wild-type (WT; sgSCR) MM1.S cells with A-485 (250nM, 6 hours). (G) Genome browser view of H3K27ac ChIP-Rx signal at the IRF4 locus and its upstream enhancer (across the DUSP22 locus) in NCOR1 depleted or WT MM1.S cells following treatment with A-485 (250nM, 6 hours). (H) H3K27ac ChIP-Rx signal from NCOR1 depleted or WT MM1.S cells centered on ATAC-Seq accessible regions ± 2.5 kb. (I) Log2 fold-change in H3K27ac ChIP-Rx signal from NCOR1 depleted or WT MM1.S cells.
Figure 6.
Figure 6.. Divergent histone acetylation-methylation kinetics dictate reversibility of P300/CBP inhibition
(A) Schematic of agent-based in silico modelling. (B) Proportion of acetylated (KAc), unmodified (K), and methylated (KMe3) lysine residues following 8, 16, or 32 hours pre-treatment with A-485 predicted by agent-based modelling. (C) Average profile and (D) heatmap of H3K27ac ChIP-Rx signal (centered on ATAC-Seq accessible regions ± 2.5 kb) in MM1.S cells following 16 hours treatment with A-485 (1μM) and subsequent wash-out for 0.5, 2, and 6 hours. (E) Genome browser view of H3K27ac ChIP-Rx signal at the IRF4 locus and its upstream enhancer. (F) Row-scaled heatmap of gene expression in MM1.S cells following RNA-seq from 16 hour washout experiment. (G) Volcano plot of RNA-Seq from 16 hour washout experiment. Genes in red indicate absolute log2 fold-change>1 and FDR<0.01. (H) GSEA of 16 hour A-485 treatment and 2 hour washout. (I) Cell death of MM1.S cells in a 72hr assay where exposure to A-485 (1μM) was varied by indicated time-points to assess the length of exposure necessary to induce cell death.
Figure 7.
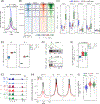
Figure 7.. Reciprocal histone methylation switching may be exploited to augment P300/CBP inhibition
(A) Genome browser view of the IRF4 locus and its upstream enhancer following sustained (32 hours) treatment with A-485 (1μM). (B) heatmap and (C) average profile of H3K27me3 ChIP-Rx signal in MM1.S cells following 32 hours treatment with A-485 (1μM), centered on ATAC-Seq accessible regions ± 2.5 kb. (D) ATAC-Seq in MM1.S cells following 32 hours treatment with A-485 (1μM), centered on ATAC-Seq accessible regions ± 2.5 kb. (E) Quantification of differential ATA-Seq peaks. (F) NOME-Seq nucleosome free-region GpC methylation centered on A-485 hypersensitive accessible regions (bin #1, Figure 3A) in MM1.S cells following 32 hours treatment with A-485. (G) Loss of representation of sgRNAs in presence of A-485 from targeted epigenetics screen in H929 cells and representation of individual sgRNAs targeted KDM6A. (H) Proliferation of KDM6A WT and KDM6A depleted ARP-1 MM cells following 96 hours treatment with A-485. (I), Cell death of MM1.S cells treated for 72 hours with GSK-J4, A-485, or the combination. Mean ± SEM. (J) Cell death of primary MM specimens treated for 72 hours with 1μM GSK-J4, 1μM A-485 or the combination. Synergy quotient values for the effect of the combination for each patient is depicted. (K) Heatmap of genes suppressed in MM1.S cells following treatment with DMSO, A-485 (1μM), GSK-J4 (2μM). (L) Model for the temporal regulation of gene expression by the histone acetylation-methylation equilibrium and the consequences of KAT inhibition on cellular transcription independent of changes in 3D chromatin configuration.

References

    1. Bannister AJ, and Kouzarides T. (1996). The CBP co-activator is a histone acetyltransferase. Nature 384, 641–643. - PubMed
    1. Boyer LA, Lee TI, Cole MF, Johnstone SE, Levine SS, Zucker JP, Guenther MG, Kumar RM, Murray HL, and Jenner RG (2005). Core transcriptional regulatory circuitry in human embryonic stem cells. cell 122, 947–956. - PMC - PubMed
    1. Bradner JE, Hnisz D, and Young RA (2017). Transcriptional Addiction in Cancer. Cell 168, 629–643. - PMC - PubMed
    1. Comet I, Riising EM, Leblanc B, and Helin K. (2016). Maintaining cell identity: PRC2-mediated regulation of transcription and cancer. Nature Reviews Cancer 16, 803. - PubMed
    1. Consortium EP (2012). An integrated encyclopedia of DNA elements in the human genome. Nature 489, 57–74. - PMC - PubMed

Publication types