. 2021 Jun 16;109(12):2025-2040.e7.
doi: 10.1016/j.neuron.2021.04.019. Epub 2021 May 20.

Decision-making ability, psychopathology, and brain connectivity

Collaborators, Affiliations

Decision-making ability, psychopathology, and brain connectivity

Michael Moutoussis et al. Neuron. .

Abstract

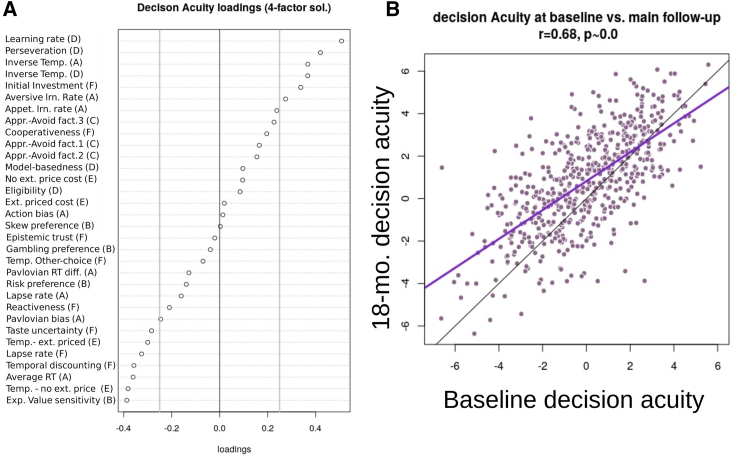
Decision-making is a cognitive process of central importance for the quality of our lives. Here, we ask whether a common factor underpins our diverse decision-making abilities. We obtained 32 decision-making measures from 830 young people and identified a common factor that we call "decision acuity," which was distinct from IQ and reflected a generic decision-making ability. Decision acuity was decreased in those with aberrant thinking and low general social functioning. Crucially, decision acuity and IQ had dissociable brain signatures, in terms of their associated neural networks of resting-state functional connectivity. Decision acuity was reliably measured, and its relationship with functional connectivity was also stable when measured in the same individuals 18 months later. Thus, our behavioral and brain data identify a new cognitive construct that underpins decision-making ability across multiple domains. This construct may be important for understanding mental health, particularly regarding poor social function and aberrant thought patterns.

Keywords: adolescence; computational psychiatry; decision acuity; development; functional connectivity.


Conflict of interest statement

Declaration of interests The authors declare no competing interests.

Figures

Figure 1
Figure 1
Decision acuity (A) Decision acuity common factor over cognitive parameters, based on the validated four-factor solution. Measure labels are shortened versions of descriptions in Table 1, and letters in brackets are task labels referring to Table 1. The top half of variables load positively, while gray vertical lines give a visual indication of which measures are important, being the thresholds used for inclusion of variables in the confirmatory analyses. (B) Decision acuity was strongly correlated between baseline and follow-up, as expected for a dispositional measure. Mauve is the regression line, and black is the identity line.
Figure 2
Figure 2
Structure of predictive testing Flow diagram of the nested cross-validation pipeline used to estimate how strongly decision acuity (similarly for IQ) could be predicted from brain data. Essentially, a predictive model was derived from training folds and then applied to the brain data from test folds to derive predicted values for the decision acuity for each individual. This could then be compared with the experimentally derived decision acuity. In our study, NB = 200, NF1 = 20, NF2 = 10, NR = 5, and NP = 100. X corresponds to the rsFC features and y to the scores predicted (d or IQ).
Figure 3
Figure 3
Brain networks Modules detected by the community structure algorithm. The 168 nodes of the parcellation were clustered in 14 modules with high average rsFC among their nodes. ATC, anterior temporal cortex including the medial temporal lobe; FPL, frontal pole; FPN, frontoparietal control network; LDC, left dorsolateral prefrontal cortex; MPC, medial prefrontal cortex; OFC, orbitofrontal cortex, medial and lateral; OPC, opercular cortex; PCC, posterior cingulate cortex; PTC, posterior temporal cortex; RDC, right dorsolateral prefrontal cortex; SUB, subcortical; SAN, salience network; SMT, somatosensory and motor areas; VIS, visual regions.
Figure 4
Figure 4
Observed versus predicted decision acuity by testing wave Model predictive performance for each of the functional modules. (A) Coefficient for the correlation between observed d and dpr predicted by models trained on all connections and the connections involving nodes in each module. (B) Correlation between observed d and dpr predicted by models trained on the baseline data. Only modules for which the prediction was significant at baseline are shown here. All the models included as covariates demographic and imaging-related factors (brain volume, scanning site, head motion; see STAR Methods). The whiskers indicate the intervals containing the lower 95% probability mass (corresponding to one-tailed tests) for the null distribution, obtained via permutation of the subjects to derive the significance of the correlation between predicted and measured scores (see STAR Methods). The correlation is significant (uncorrected) when it falls above the whisker. significant uncorrected; ∗∗significant with FDR correction for the 15 tests. ATC, anterior temporal cortex including the medial temporal lobe; FPL, frontal pole; FPN, frontoparietal control network; LDC, left dorsolateral prefrontal cortex; MPC, medial prefrontal cortex; OFC, orbitofrontal cortex, medial and lateral; OPC, opercular cortex; PCC, posterior cingulate cortex; PTC, posterior temporal cortex; RDC, right dorsolateral prefrontal cortex; SUB, subcortical; SAN, salience network; SMT, somatosensory and motor areas; VIS, visual regions.
Figure 5
Figure 5
Networks specific to decision acuity versus specific to IQ Predictive performance for d and IQ when correcting for each other. (A) As in Figure 4A, correlation between observed d and dpr, but here additionally correcting for IQ in addition to demographic and imaging-related factors (brain volume, scanning site, head motion; see STAR Methods). (B) Correlation between observed and predicted IQ, but correcting for imaging related factors and decision acuity. In all plots, the leftmost bar corresponds to the model that includes all connections. The whiskers indicate the intervals containing the lower 95% probability mass (corresponding to one-tailed tests) for the null distribution, obtained via permutation of the subjects to derive the significance of the correlation between predicted and measured scores (see STAR Methods). The correlation is significant (uncorrected) when it falls above the whisker. significant uncorrected; ∗∗significant with FDR correction for the 15 tests. Abbreviations as per Figure 4.

Comment in

References

    1. Axelrod B.N. Validity of the Wechsler abbreviated scale of intelligence and other very short forms of estimating intellectual functioning. Assessment. 2002;9:17–23. - PubMed
    1. Bach D.R., Guitart-Masip M., Packard P.A., Miró J., Falip M., Fuentemilla L., Dolan R.J. Human hippocampus arbitrates approach-avoidance conflict. Curr. Biol. 2014;24:541–547. - PMC - PubMed
    1. Bach D.R., Moutoussis M., Bowler A., Dolan R.J., Neuroscience in Psychiatry Network consortium Predictors of risky foraging behaviour in healthy young people. Nat. Hum. Behav. 2020;4:832–843. - PMC - PubMed
    1. Badre D., Doll B.B., Long N.M., Frank M.J. Rostrolateral prefrontal cortex and individual differences in uncertainty-driven exploration. Neuron. 2012;73:595–607. - PMC - PubMed
    1. Bickel W.K., Jarmolowicz D.P., Mueller T.E., Koffarnus M.N., Gatchalian K.M. Excessive discounting of delayed reinforcers as a trans-disease process contributing to addiction and other disease-related vulnerabilities: emerging evidence. Pharmacol. Ther. 2012;134:287–297. - PMC - PubMed

Publication types

MeSH terms

LinkOut - more resources