. 2021 Jul 6;33(7):1322-1341.e13.
doi: 10.1016/j.cmet.2021.04.017. Epub 2021 May 20.

Adhesion-mediated mechanosignaling forces mitohormesis

Affiliations

Adhesion-mediated mechanosignaling forces mitohormesis

Kevin M Tharp et al. Cell Metab. .

Abstract

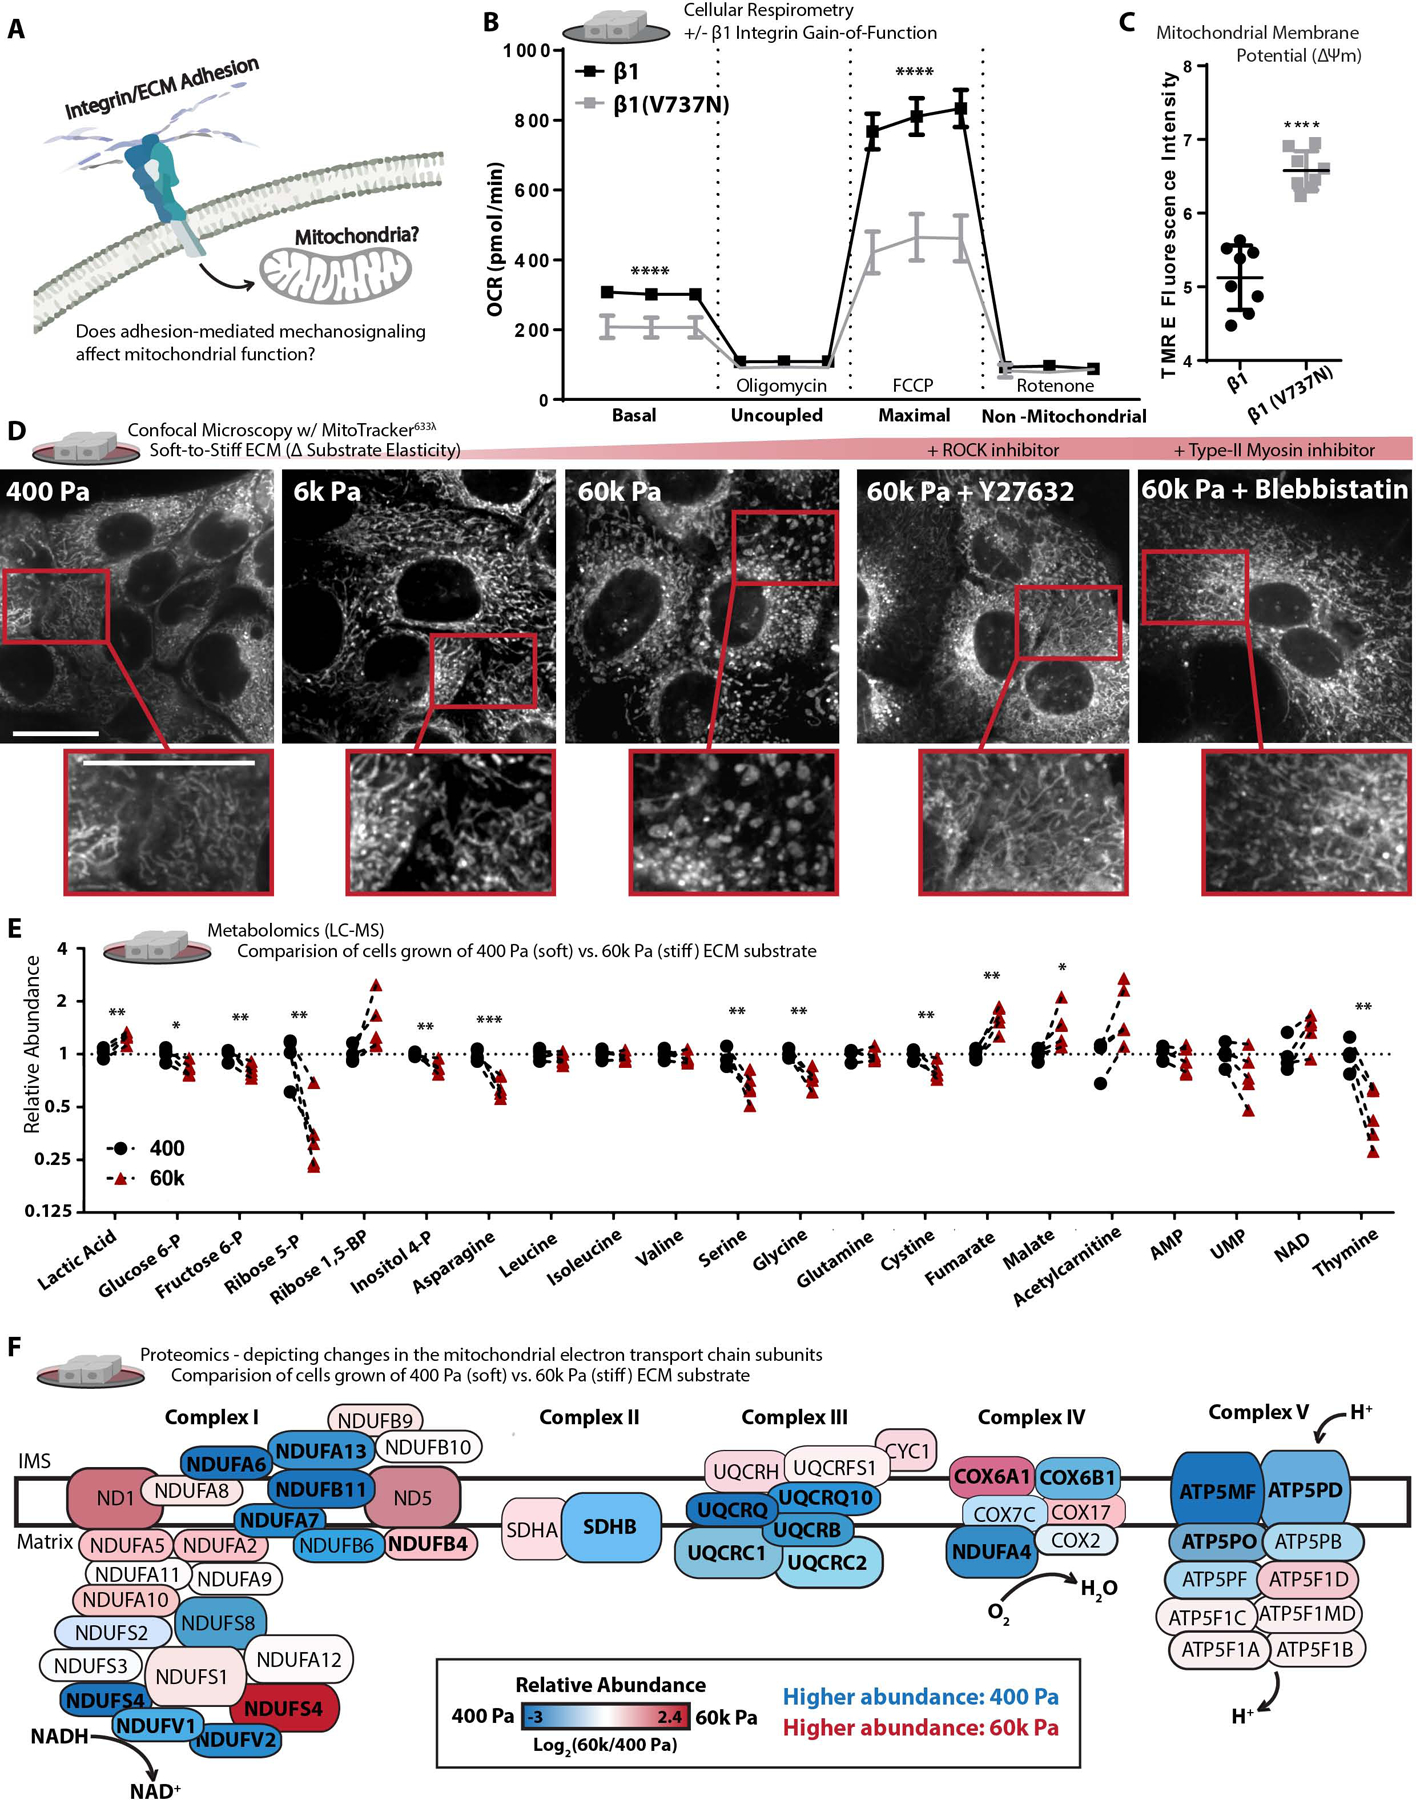
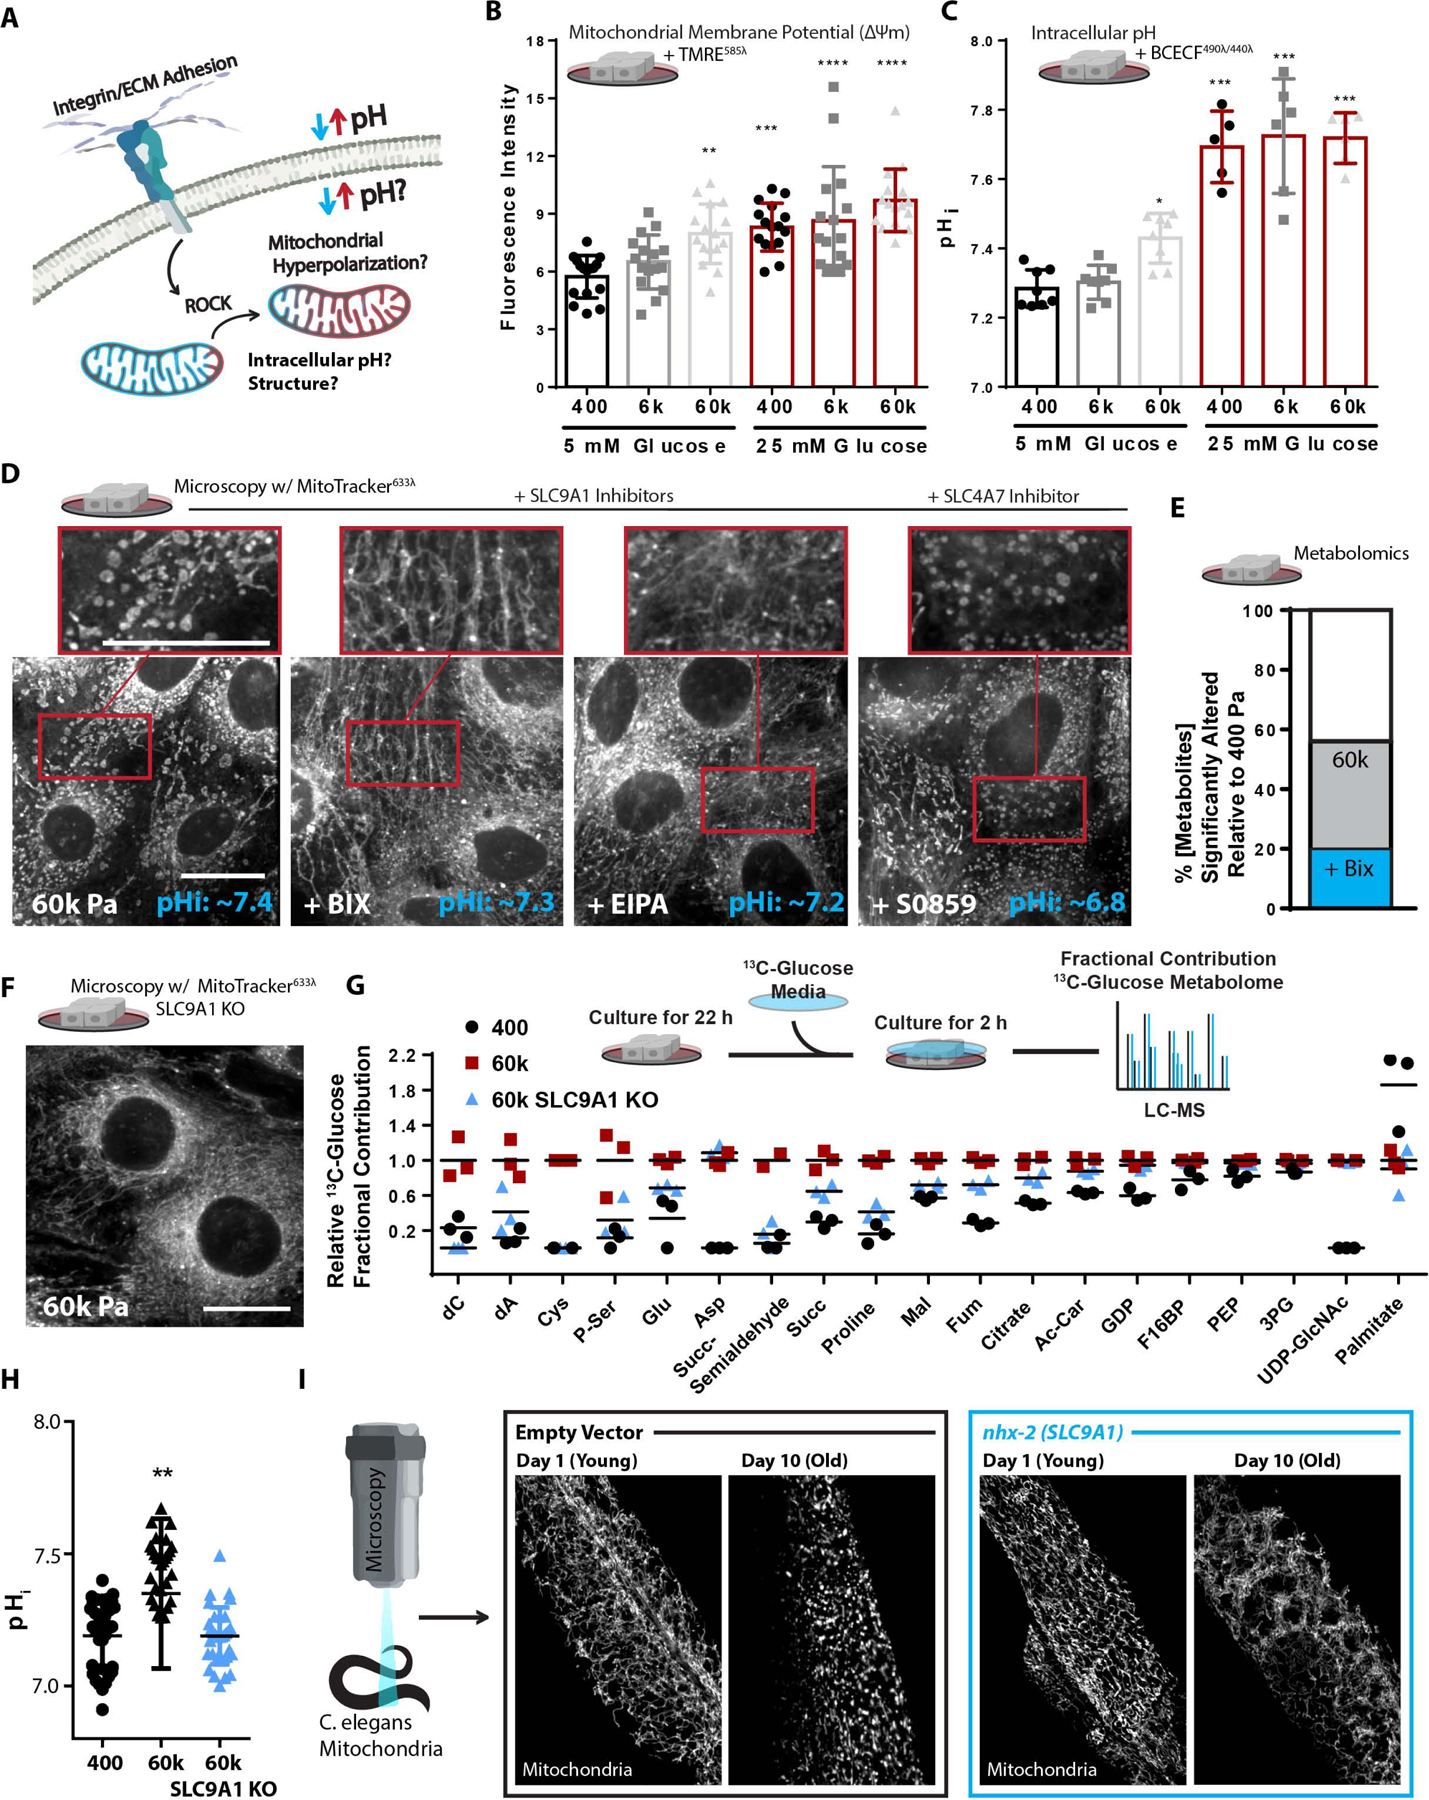
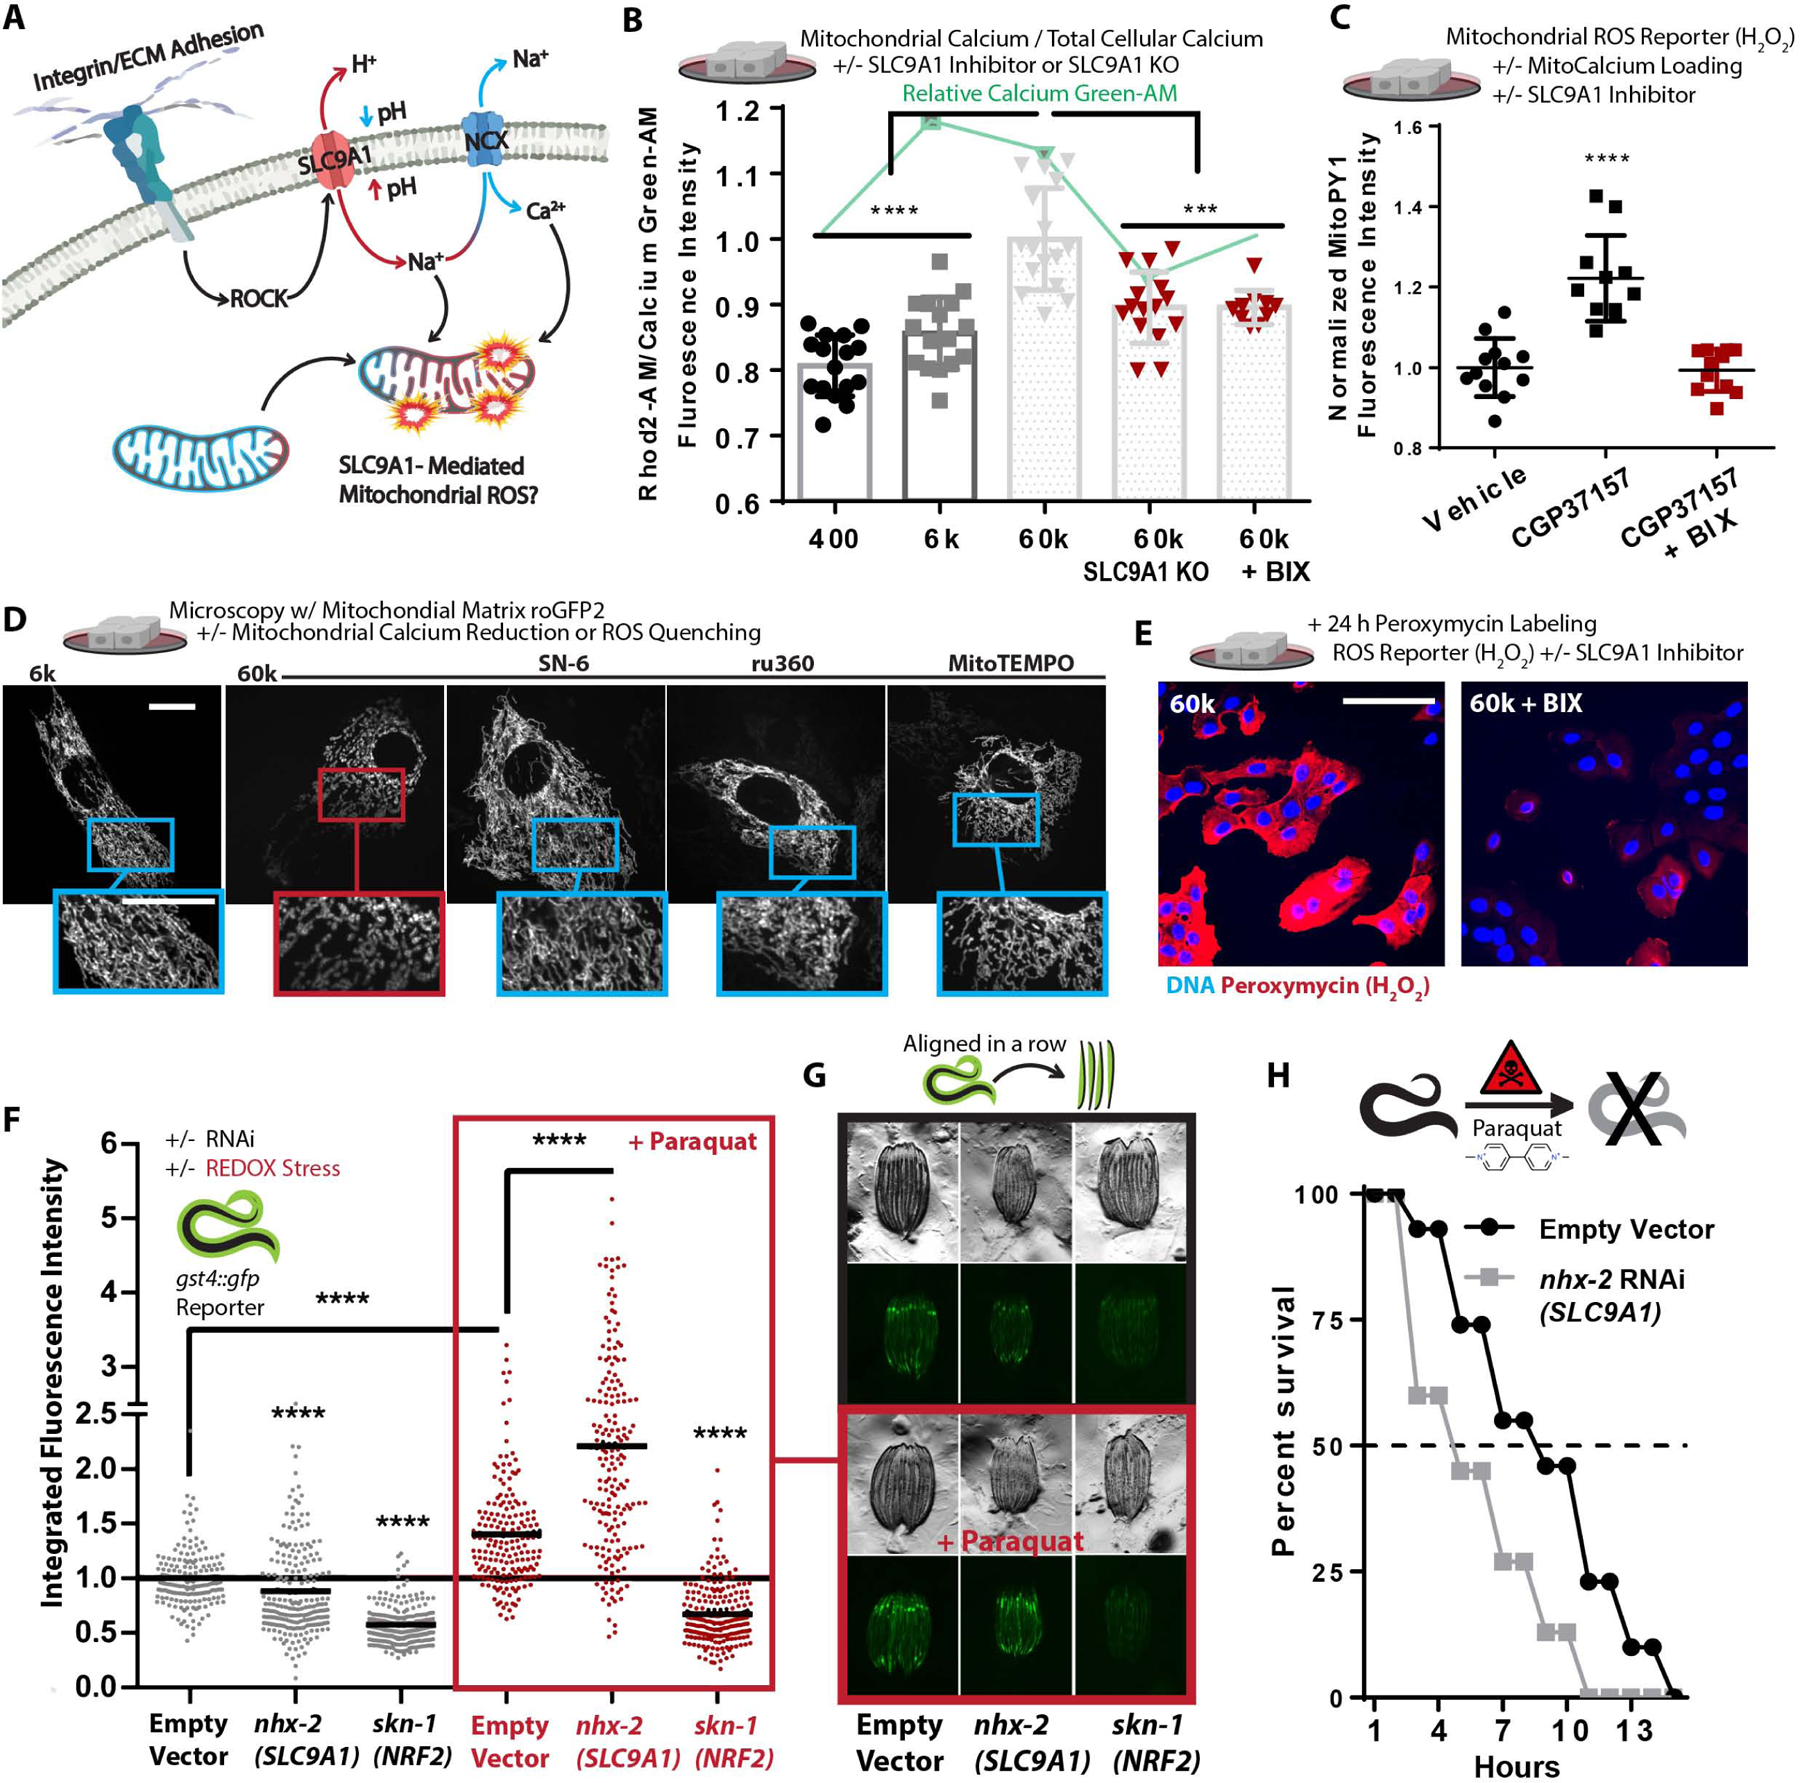
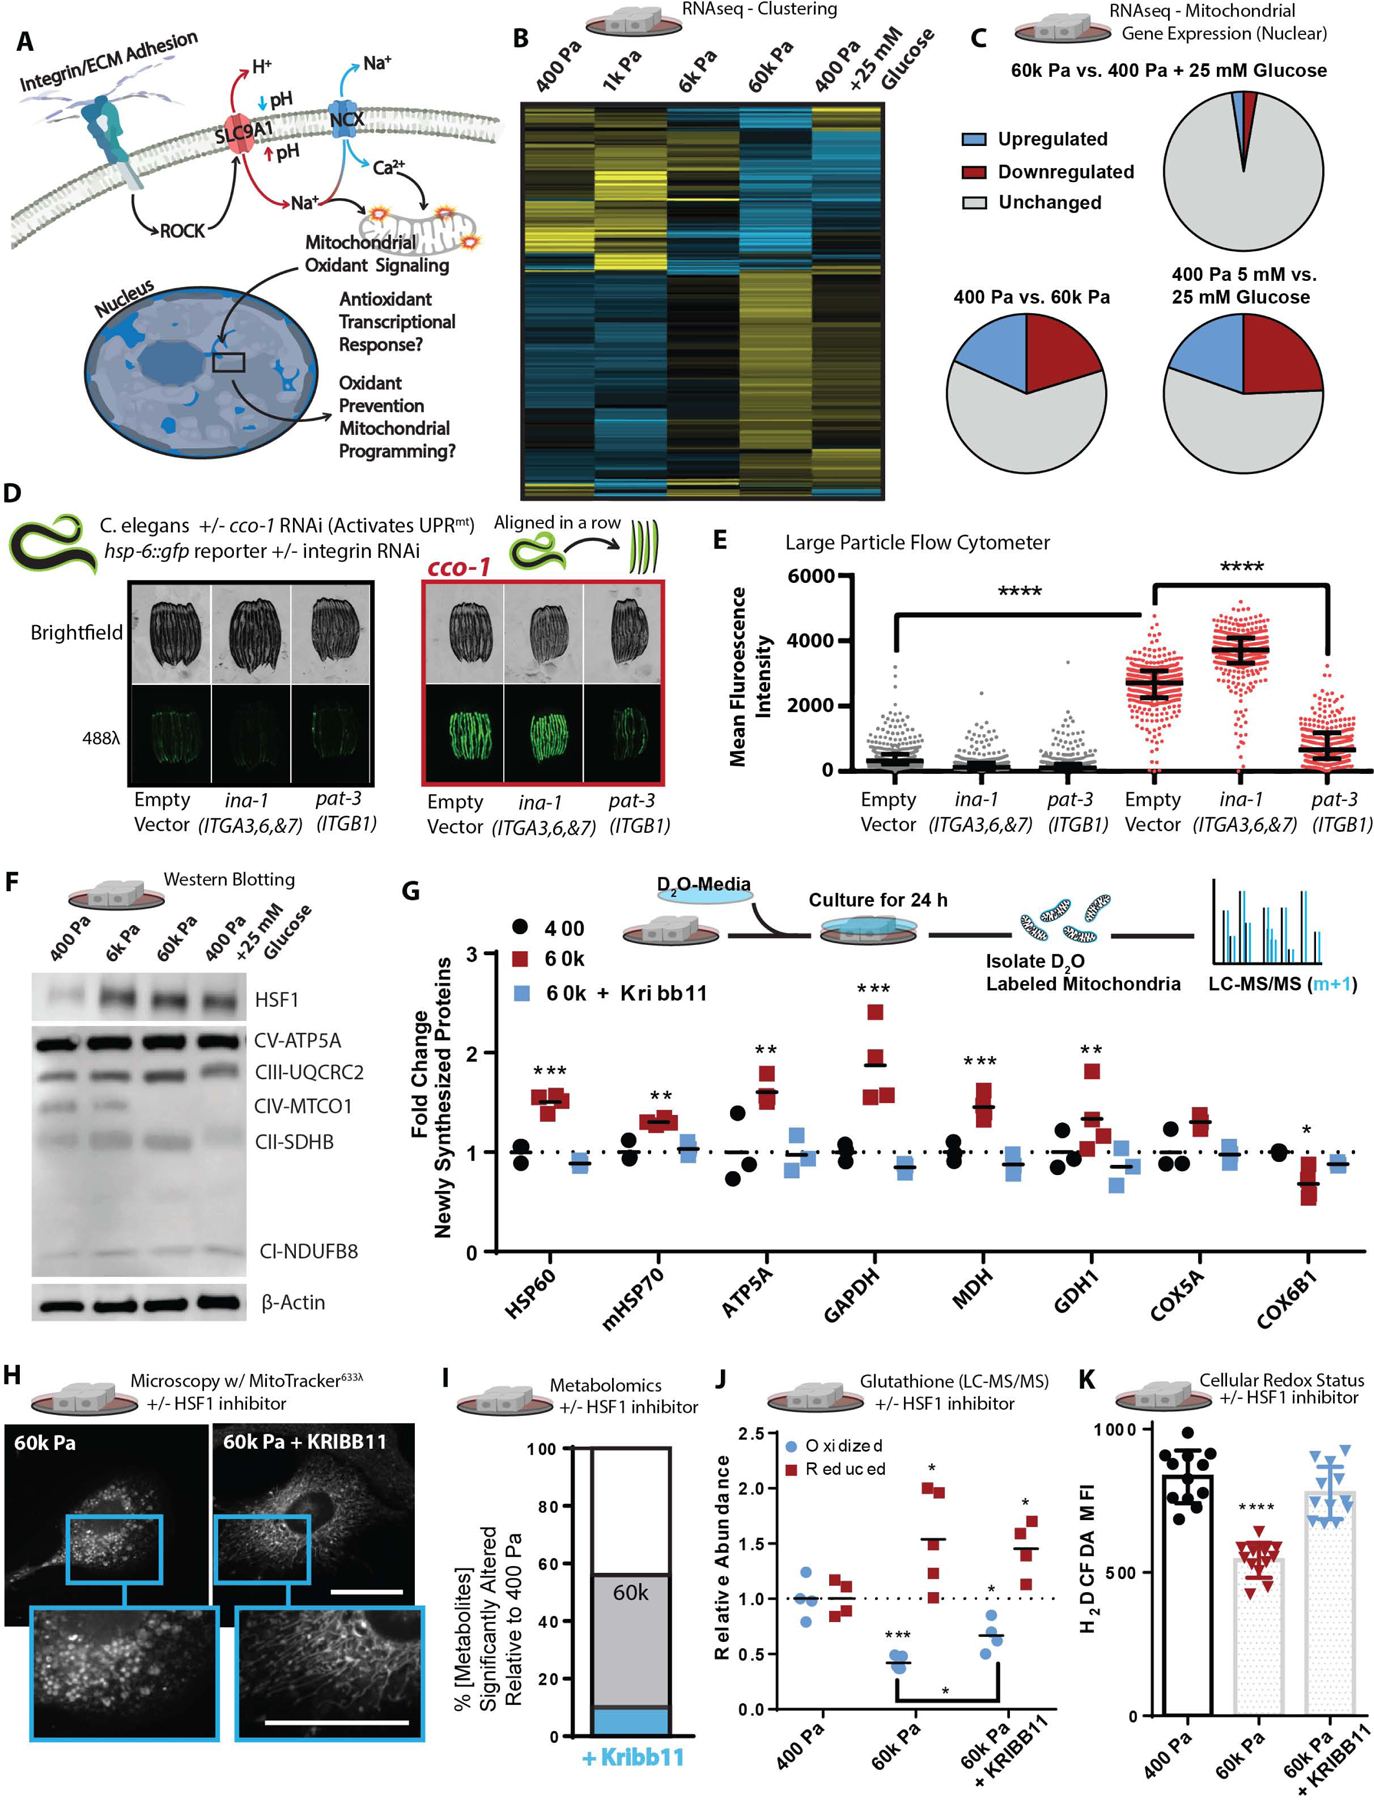
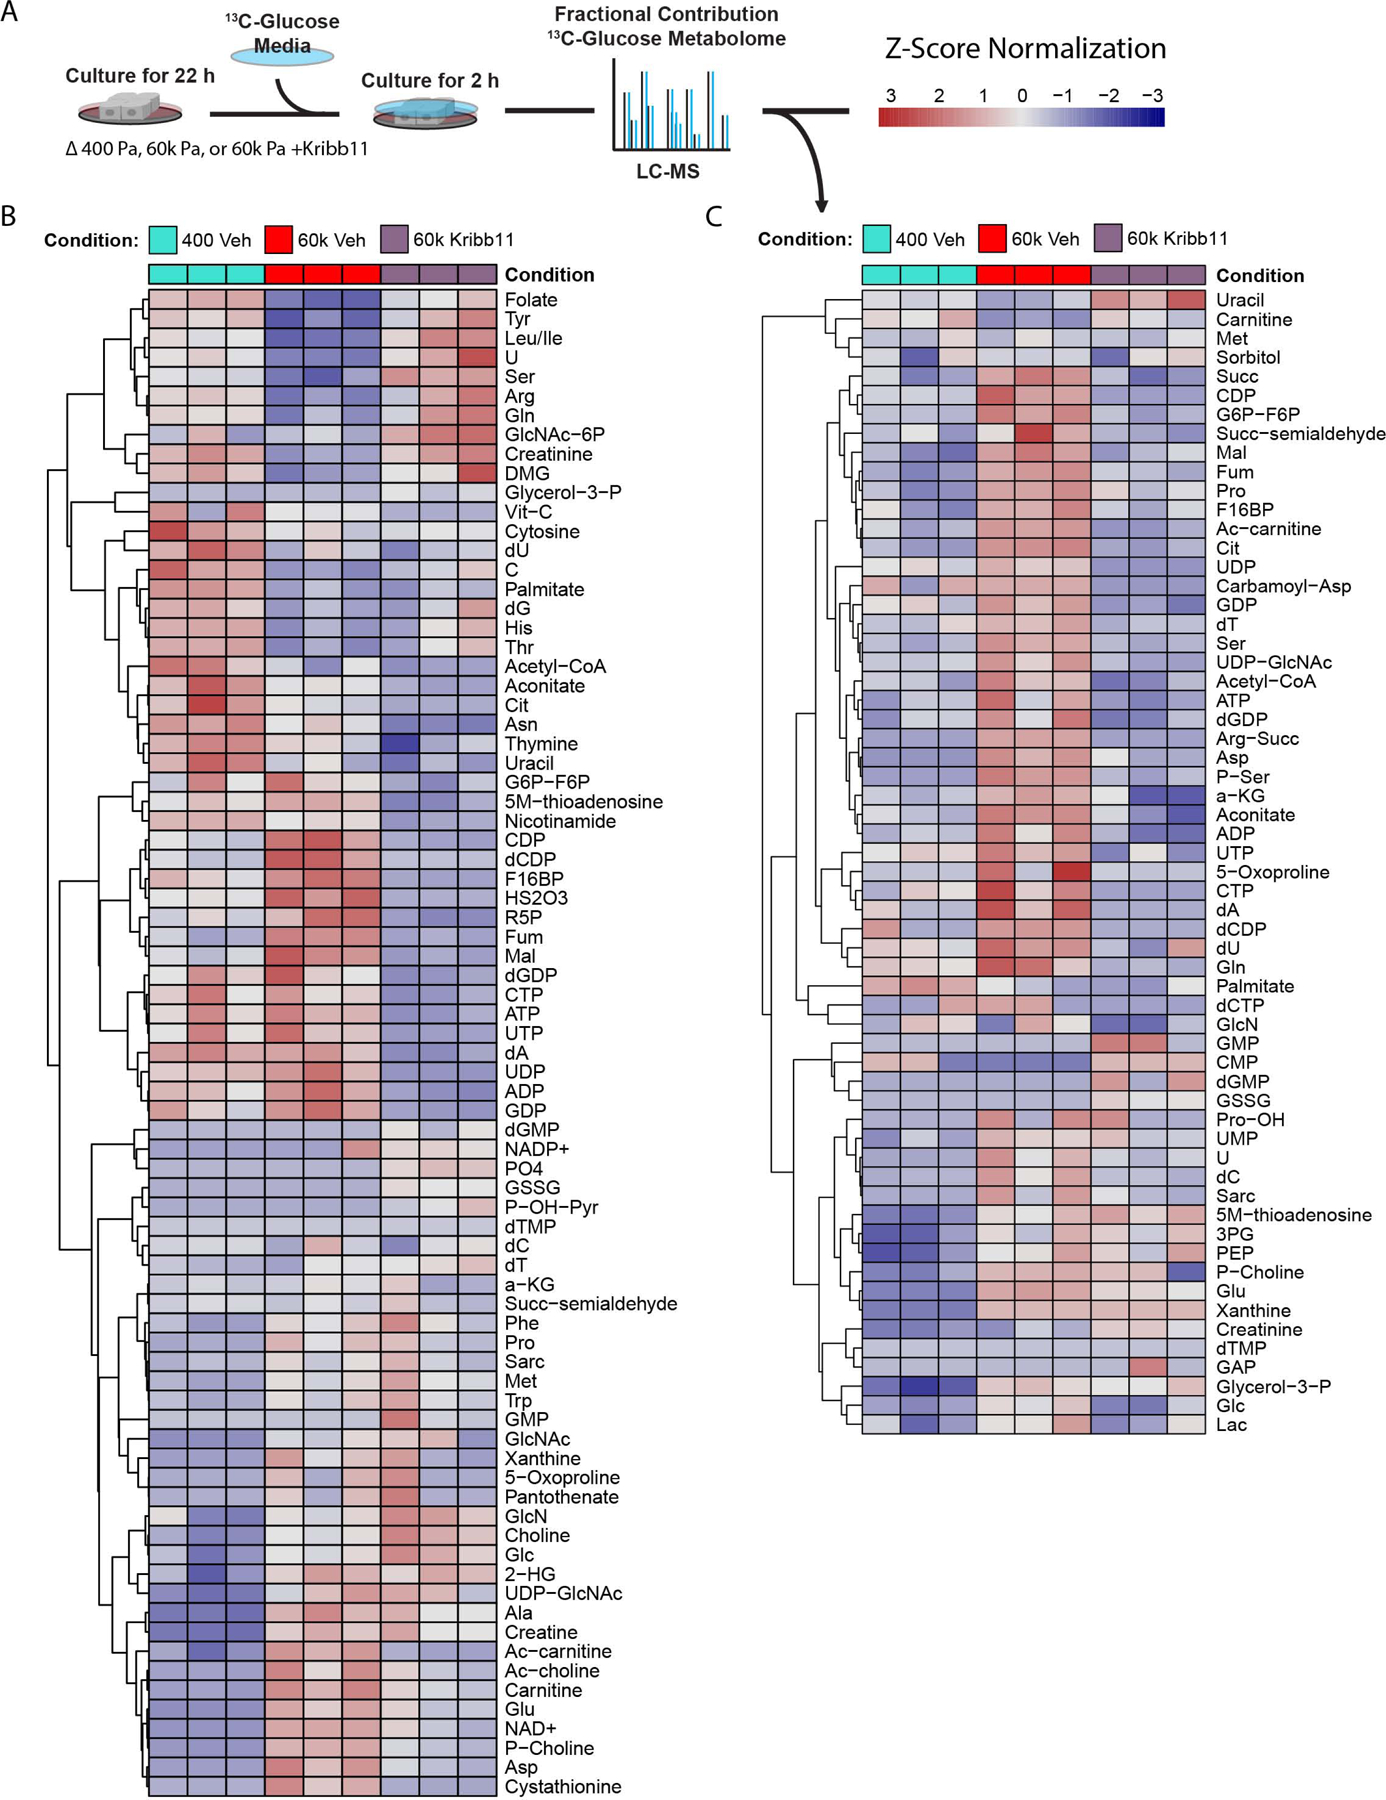
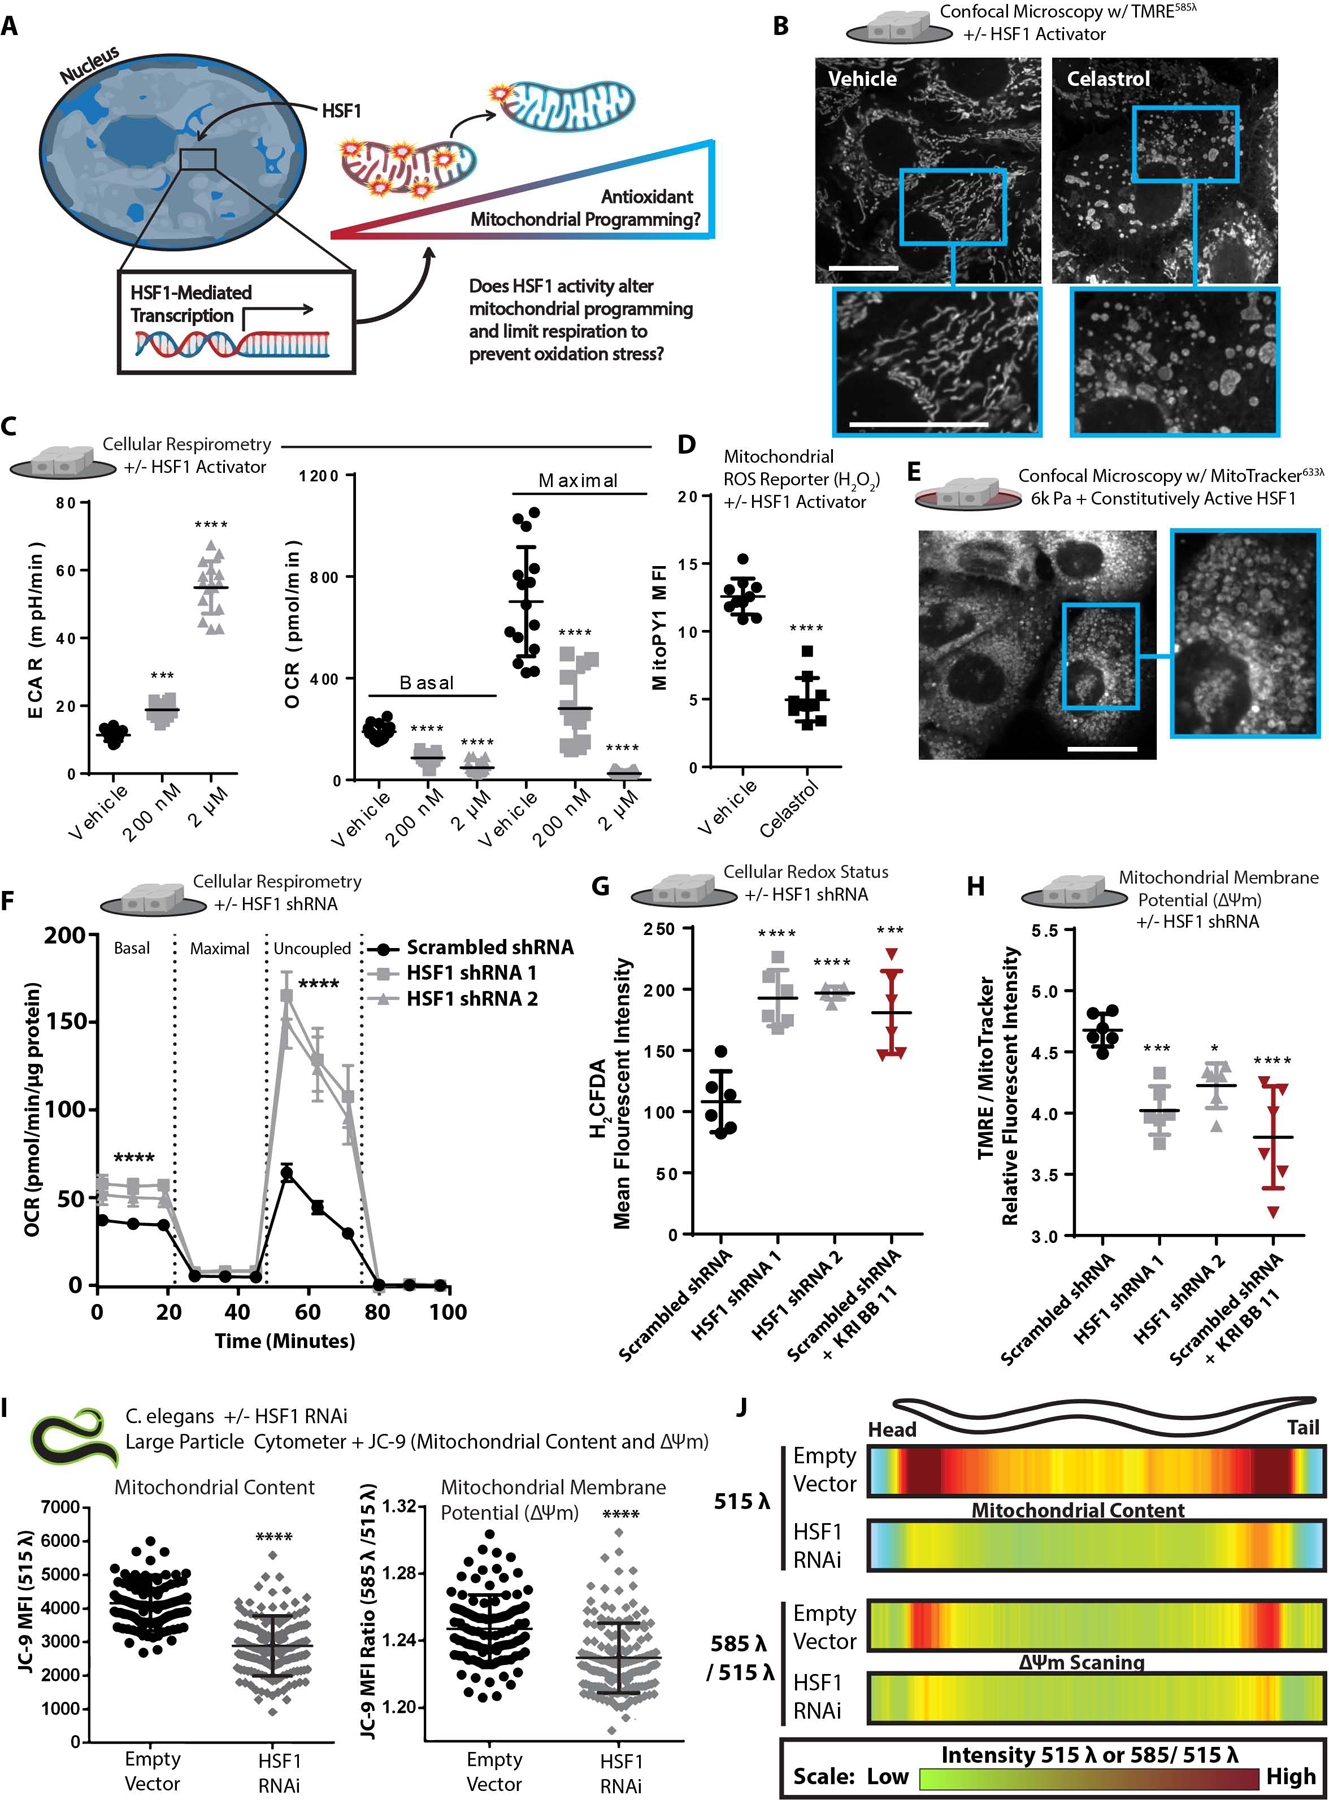
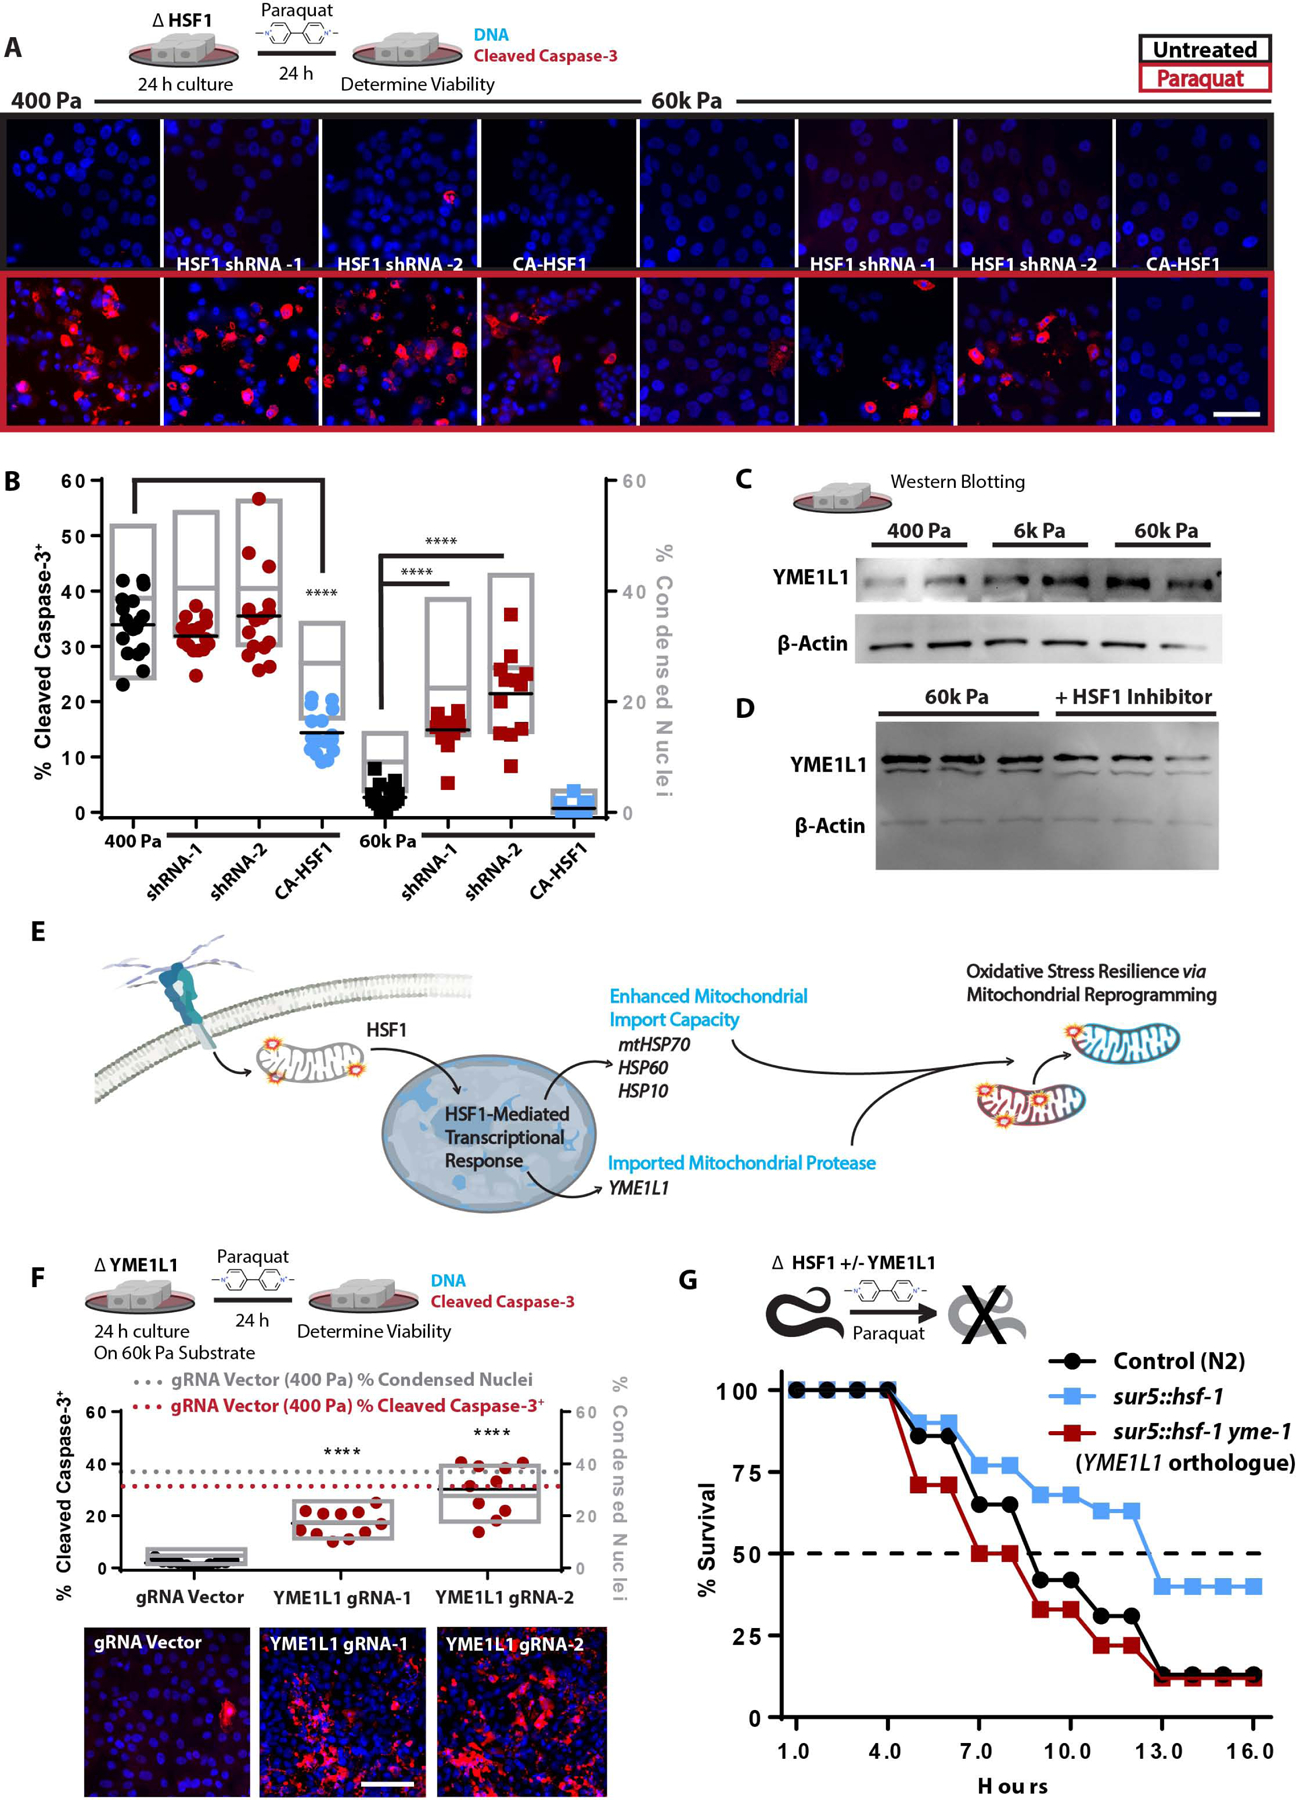
Mitochondria control eukaryotic cell fate by producing the energy needed to support life and the signals required to execute programed cell death. The biochemical milieu is known to affect mitochondrial function and contribute to the dysfunctional mitochondrial phenotypes implicated in cancer and the morbidities of aging. However, the physical characteristics of the extracellular matrix are also altered in cancerous and aging tissues. Here, we demonstrate that cells sense the physical properties of the extracellular matrix and activate a mitochondrial stress response that adaptively tunes mitochondrial function via solute carrier family 9 member A1-dependent ion exchange and heat shock factor 1-dependent transcription. Overall, our data indicate that adhesion-mediated mechanosignaling may play an unappreciated role in the altered mitochondrial functions observed in aging and cancer.

Keywords: UPRmt; adhesion; aging; cancer; extracellular matrix; mechanical stress; mechanotabolism; metabolism; oxidative stress; tension.


Conflict of interest statement

Declaration of interests The authors declare no competing interests.

Figures

Figure 1.
Figure 1.. Adhesion-mediated mechanosignaling alters mitochondrial structure and function of human mammary epithelial cells (MECs).
A. Graphical representation of the experimental question. B. Mitochondrial oxygen consumption rate (OCR) of β1-integrin or β1(V7373N) expressing cells (100k cells per well, n=5 wells, 3 replicate measures, repeated 3 times), mitochondrial stress test conditions: uncoupled = oligomycin [1 μM], maximal = Trifluoromethoxy carbonylcyanide phenylhydrazone (FCCP) [1 μM], non-mitochondrial = antimycin A [1 μM] and rotenone [1 μM]. C. Mitochondrial membrane potential, measured after 1 h treatment of Tetramethylrhodamine ethyl-ester (TMRE) [10 nM] (n = 2 wells, repeated 4 times). D. Confocal Microscopy depicting mitochondrial network structure in PFA-fixed cells cultured on varied soft-to-stiff fibronectin coated [6 μM/cm2] polyacrylamide hydrogels (soft-to-stiff ECM), for 24 h +/− y27632 [10 μM] or Blebbistatin [10 μM], stained with mitotracker (deep red FM) [100 nM]. (Scale Bar: 10 μm). MitoMAPR Quantification: 400 (18), 6k (20) 60k (7), 60k + Y27632 (15), and 60k + Blebbistatin (12) junctions per network. E. Selection of metabolites measured with (LC-MS) from MECs cultured on soft of stiff ECM for 24 h, fold change relative to 400 Pa. (n=4–5 biological replicates LC-MS run together, repeated 2 times) F. Relative abundance (fold change) of mitochondrial ETC subunits measured via timsTOF LC-MS of MECs cultured on soft or stiff ECM for 24 h (n=3 biological replicates). Bolded text indicates *P of < 0.05 or less, locations and sizes of ETC subunits graphically depicted are approximate and not to molecular scale.
Figure 2.
Figure 2.. SLC9A1 facilitates stiff ECM induced mitochondrial programming
A. Graphical representation of the experimental question. B. Mitochondrial membrane potential, measured after 1 h treatment of Tetramethylrhodamine ethyl-ester (TMRE) [10 nM] (n = 4 replicate PA gels repeated 4 times, shown together). C. Intracellular pH (pHi) of cells grown of varied stiffness PA gels +/− glucose [25 mM], measured via 2’,7’-Bis-(2-Carboxyethyl)-5-(and-6)-Carboxyfluorescein, Acetoxymethyl Ester (BCECF) [1 μM] (n=2 replicate PA gels repeated 3–4 times, shown together). D. Confocal microscopy depicting mitochondrial network structure and caption depicting of pHi measurements (mean of n=5) in MECs on 60k Pa surfaces treated with BIX [500 nM], EIPA [10 μM], S0859 [50 μM], or vehicle for 24 h, mitotracker (deep red FM) [100 nM] and BCECF [1 μM] (n=2 replicate PA gels repeated 3 times). (Scale Bar: 10 μm). MitoMAPR Quantification: 60k (9), BIX (20), EIPA (20), and S0859 (7) junctions per network. E. Metabolomics (LC-MS) of cells cultured on 400 or 60k ECM for 24 h, % metabolites significantly altered relative to 400 Pa +/− BIX [500 nM]. (n=4–5 biological replicates LC-MS run together, repeated 2 separate times). F. Confocal microscopy depicting mitochondrial network structure of SLC9A1 KO cells on 60k Pa surfaces for 24 h, mitotracker (deep red FM) [100 nM]. (Scale Bar: 10 μm). MitoMAPR Quantification: WT (8) and SLC9A1 KO (21) junctions per network. G. Fractional contribution of 13C6-Glucose to a selection of pertinent metabolites. 2 h labeling, (n=3 biological replicates, LC-MS run together) H. Intracellular pH (pHi) of WT or SLC9A1 KO cells grown of varied stiffness PA gels measured via 2’,7’-Bis-(2-Carboxyethyl)-5-(and-6)-Carboxyfluorescein, Acetoxymethyl Ester (BCECF) [1 μM] (n=6 replicate PA gels, repeated 4 times, shown together). I. Representative microscopy depicting mitochondrial network structure of live C.elegans expressing MLS::mRuby (mitochondrial matrix) grown on empty vector or nhx-2 (SLC9A1 orthologue) RNAi from hatch of 5 d or 15 d old animals.
Figure 3.
Figure 3.. SLC9A1 facilitates mitochondrial oxidative stress
A. Graphical schematic indicating how SLC9A1 affects mitochondrial oxidative stress. B. Calcium content of MCF10A cells cultured on soft-to-stiff ECM for 24 h, treated with Rhod2-AM [2 μM] (mitochondrial) and Calcium Green-1-AM [2 μM] (intracellular). (n=4 replicates, repeated 4 times). C. Mitochondrial H2O2 production of cells cultured on 6k Pa surfaces and treated with BIX [500 nM] or vehicle for 24 h and then MitoPy1 [5 μM] and vehicle or CGP37157 [1 μM] for 1 h (n=6, repeated 2 times). D. Confocal microscopy depicting mitochondrial network structure of PFA fixed MECs on 6k or 60k Pa ECM treated with 1 μM ru360 (MCU inhibitor), 10 μM SN-6 (NCX reverse mode inhibitor, opposite direction of CCP37157), and 2 μM MitoTEMPO for 24 h. (Scale Bar: 10 μm). MitoMAPR Quantification: 6k (21), 60k (6), 60k + SN-6 (27), 60k + Ru360 (13), and 60k + MitoTEMPO (12) junctions per network. E. Confocal microscopy of peroxymycin (H2O2) (Yik-Sham Chung et al., 2018) staining over 24 h on 60k Pa ECM +/− BIX [500 nM], quantitated in Figure S3I. F-G. gst-4p::gfp reporter fluorescent intensity of C.elegans measured with a large particle cytometer, +/− paraquat [50 mM] (n=177, 206, 190, 187, 191, and 215 animals in order left to right) with representative images (G) of C. elegans quantified, repeated 3 times. H. C. elegans survival in 50 mM paraquat at 1 d; animals grown from hatch on nhx-2 RNAi vs empty-vector control (80 worms per condition, repeated 3 times).
Figure 4:
Figure 4:. Mechanosignaling facilitates mitochondrial stress response via HSF1
A. Graphical representation of the paradigm and remaining questions. B. Heatmap depicting unsupervised hierarchical clustering of RNAseq of cells cultured on soft-to-stiff ECM for 24 h +/− glucose [5 or 25 mM], (n=2 duplicate libraries of 3 biological replicates, ~ 10 million reads per library). C. Comparison of significantly altered MitoCarta 2.0 catalogued genes from the 400 pa, 60k, and 400 pa + 25 mM glucose conditions shown in Figure 4B. D.hsp-6::gfp reporter fluorescent intensity representative images of C. elegans quantified, in Figure 4E RNAis were mixed at a 5:1 ratio of ev, ina-1, or pat-3 RNAi to ev or cco-1 RNAi as depicted (hsp-6 is the HSPA9/mtHSP70 orthologue) E. Quantification of hsp-6::gfp reporter fluorescent intensity of C.elegans measured with a large particle cytometer, +/− cco-1 RNAi (n=387, 309, 377, 326, 312, and 294 animals in order left to right, repeated 3 times). F. Western blot depicting relative protein abundance of HSF1, electron transport chain components, or β-actin within 5 μg of total protein derived from lysates of cells cultured on soft-to-stiff ECM for 24 h +/− glucose [5 or 25 mM]. G. Stable Isotope mitochondrial proteomics of crude mitochondrial fraction of MCF10A cells grown 400 or 60k Pa ECM for 24 h +/− KRIBB11 [2 μM] [(n=4 biological replicates LC-MS run together, repeated 2 times) H. Confocal microscopy of 100 nM mitotracker (deep red FM) stained and fixed (PFA) cells cultured on 60k Pa ECM surfaces for 24 h +/− vehicle or KRIBB11 [2 μM]. MitoMAPR Quantification: 60k (7) and 60k + Kribb11 (12) junctions per network. I. Metabolomics (LC-MS) of cells cultured on 400 or 60k Pa ECM for 24 h, % significantly altered relative to 400 Pa +/− KRIBB11 [2 μM]. (n=4–5 biological replicates LC-MS/MS run together, repeated 2 times) J. Oxidized/reduced glutathione (NEM protected) measurements of MCF10A cells grown on 400 or 60k Pa ECM for 24 h +/− KRIBB11 [2 μM] [(n=4 biological replicates, repeated 2 times) (n=4–5 biological replicates LC-MS run together, repeated 2 times). K. Oxidative stress indicator intensity of cells after 1 hour, MCF10A cells cultured on varied 400 or 60k Pa ECM for 24 h +/− vehicle or KRIBB11 [2 μM] prior, measured with 2’,7’-dichlorodihydrofluorescein diacetate (H2DCFDA) [2 μM].
Figure 5:
Figure 5:. HSF1 facilitates mechanosignaling-mediated metabolic reprogramming
A. Graphical depiction of experimental design. B. Heat map of relative metabolite levels of MECs cultured on 400 Pa or 60k Pa vehicle (DMSO) treated or 60k Pa ECM with Kribb11 [2 μM] for 22 h followed by media exchanged for 13C6-glucose containing media for 2 h and then harvested for LC-MS analysis. (n=3 biological replicates) C. Heat map of fractional contributions of 13C6-glucose to the metabolome of MECs cultured on 400 Pa or 60k Pa vehicle (DMSO) treated or 60k Pa ECM with Kribb11 [2 μM] over the course of 2 h. MECs were previously cultured for 22 h in the same conditions with unlabeled glucose media. (n=3 biological replicates, LC-MS analysis)
Figure 6:
Figure 6:. HSF1 induces mitochondrial reprogramming
A. Graphical depiction of experimental question. B. Confocal microscopy depicting morphology and mitochondrial membrane potential staining of live cells via TMRE [10 nM] staining +/− vehicle or Celastrol [2 μM] treatment for 40 minutes prior to imaging. MitoMAPR Quantification: vehicle (10) and celastrol (6) junctions per network. C. Extracellular acidification rate (ECAR) and OCR of MECs treated +/− vehicle or Celastrol [200 nM] for 24 h or Celastrol [2 μM] for 40 minutes (n=5 wells, 3 replicate measures). D. Mitochondrial H2O2 production of cells treated with Celastrol [2 μM] treatment for 40 minutes, measured with MitoPY [1 μM] (n=5, repeated 2 times). E. Confocal microscopy depicting mitochondrial morphology of PFA-fixed cells expressing constitutively-active HSF1 and cultured on 6k Pa ECM for 24 h, stained with 100 nM mitotracker (deep red FM). F. Oxygen consumption rate (OCR) of MCF10A cells expressing a scrambled shRNA or two different shRNAs targeting HSF1 (n=5 wells, 3 replicate measures, repeated 3 times) G. Oxidative stress indicator intensity after 1 h in MCF10A cells cultured on TCPS expressing a scrambled shRNA +/− KRIBB11 [2 μM] or two different shRNAs targeting HSF1, measured with 2’,7’-dichlorodihydrofluorescein diacetate (H2DCFDA) [2 μM].(n=6 wells, repeated 3 times). H. Mitochondrial membrane potential of MCF10A cells cultured on TCPS expressing a scrambled shRNA +/− KRIBB11 [2 μM] or two different shRNAs targeting HSF1, measured with TMRE [1 nM] and mitotracker [100 nM] after 1 h staining (n=6, repeated 3 times). I. Mean fluorescent intensity of 150 per condition JC-9 stained C. elegans grown on empty vector or hsf-1 RNAi from hatch, depicting mitochondrial mass (515 λ alone) or mitochondrial membrane potential (585 λ / 515 λ), spatially quantified in Figure 5J. J. Heatmap depicting mitochondrial content (515 λ alone) or mitochondrial membrane potential (585 λ / 515 λ) across the body length (head (left) to tail (right)) of 150 C. elegans animals grown on empty vector or hsf-1 RNAi from hatch; JC-9 staining via administration of JC-9 loaded C.elegans food (E.coli) (repeated 3 times).
Figure 7:
Figure 7:. ECM-mediated mechanosignaling controls OxSR via HSF1 and YME1L1
A. Confocal microscopy of indicators of apoptosis with cleaved caspase 3 staining (red) and nuclear condensation (dapi) of MECs cultured on 400 or 60k Pa ECM for 24 h with subsequent 24 h +/− paraquat treatment [10 mM]. 100k cells/well of 24 well plate. (n=4 replicates, repeated 3 separate times) B. Quantitation of cells from 16 field views depicted in G for condensed nuclei and cleaved caspase-3 positive cells (1653–575 cells counted per condition, repeated 3 times). C. Western blot of YME1L1 and β-actin from 5 μg of protein derived from cells cultured on soft-to-stiff ECM for 24 h. (2 biological replicates shown, repeated 3 times) D. Western blot of YME1L1 and β-actin from 5 μg of protein derived from cells cultured on 60k Pa ECM for 24 h +/− KRIBB11 [2 μM] (3 biological replicates shown, repeated 2 times) E. Graphical representation of the conceptual paradigm pertaining to this figure. F. Quantitation of MECs with YME1L1 knockdown via CRISPR-I compared to CRISPR-I and empty guide vector expressing cells on 400 Pa (dashed lines) or 60k Pa ECM, 11 field views quantified for condensed nuclei and cleaved caspase-3 positive cells (923–2880 cells counted per condition, repeated 3 times). G. C. elegans survival in 50 mM paraquat, with C. elegans overexpressing hsf-1 (sur-5p::hsf-1) compared or control line (N2) grown on either empty vector or ymel-1 RNAi from hatch (n=80 animals per condition, repeated 3 times).

Comment in

References

    1. Acerbi I, Cassereau L, Dean I, Shi Q, Au A, Park C, Chen YY, Liphardt J, Hwang ES, and Weaver VM (2015). Human breast cancer invasion and aggression correlates with ECM stiffening and immune cell infiltration. Integr. Biol. (Camb) 7, 1120–1134. - PMC - PubMed
    1. Ahn S-G, and Thiele DJ (2003). Redox regulation of mammalian heat shock factor 1 is essential for Hsp gene activation and protection from stress. Genes Dev. 17, 516–528. - PMC - PubMed
    1. Aldridge JE, Horibe T, and Hoogenraad NJ (2007). Discovery of genes activated by the mitochondrial unfolded protein response (mtUPR) and cognate promoter elements. PLoS One 2, e874–e874. - PMC - PubMed
    1. Anesti V, and Scorrano L (2006). The relationship between mitochondrial shape and function and the cytoskeleton. Biochim. Biophys. Acta 1757, 692–699. - PubMed
    1. Baird NA, Douglas PM, Simic MS, Grant AR, Moresco JJ, Wolff SC, Yates JR 3rd, Manning G, and Dillin A (2014). HSF-1-mediated cytoskeletal integrity determines thermotolerance and life span. Science 346, 360–363. - PMC - PubMed

Publication types

MeSH terms