. 2021 Jan-Jun:296:100796.
doi: 10.1016/j.jbc.2021.100796. Epub 2021 May 18.

Lipid-specific oligomerization of the Marburg virus matrix protein VP40 is regulated by two distinct interfaces for virion assembly

Affiliations

Lipid-specific oligomerization of the Marburg virus matrix protein VP40 is regulated by two distinct interfaces for virion assembly

Souad Amiar et al. J Biol Chem. 2021 Jan-Jun.

Abstract

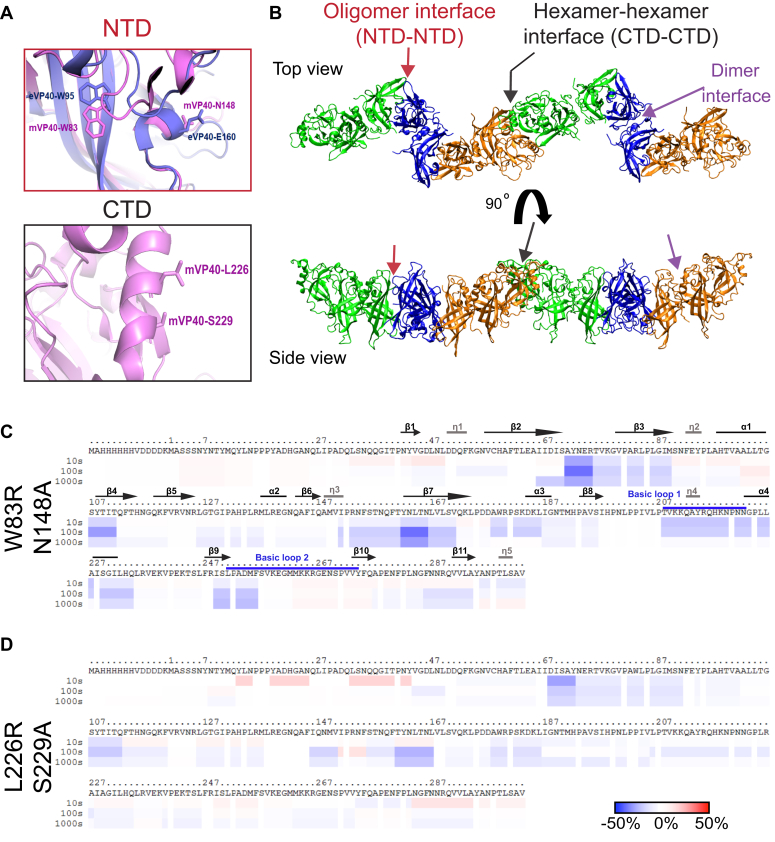
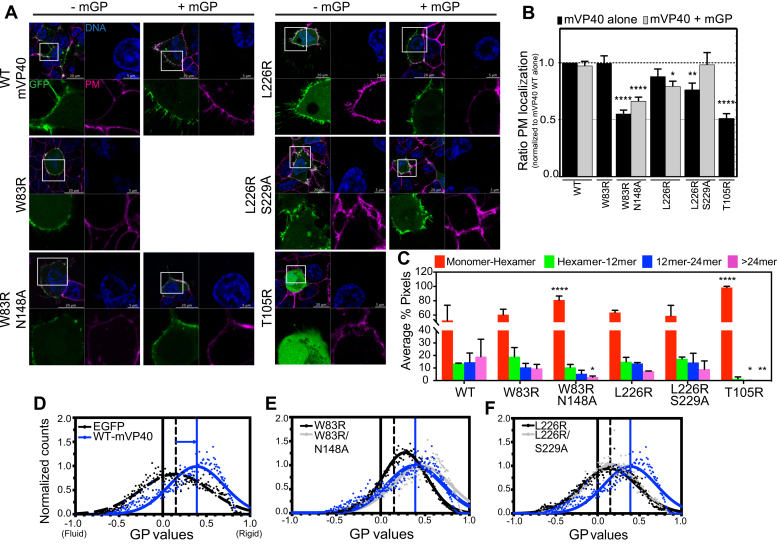
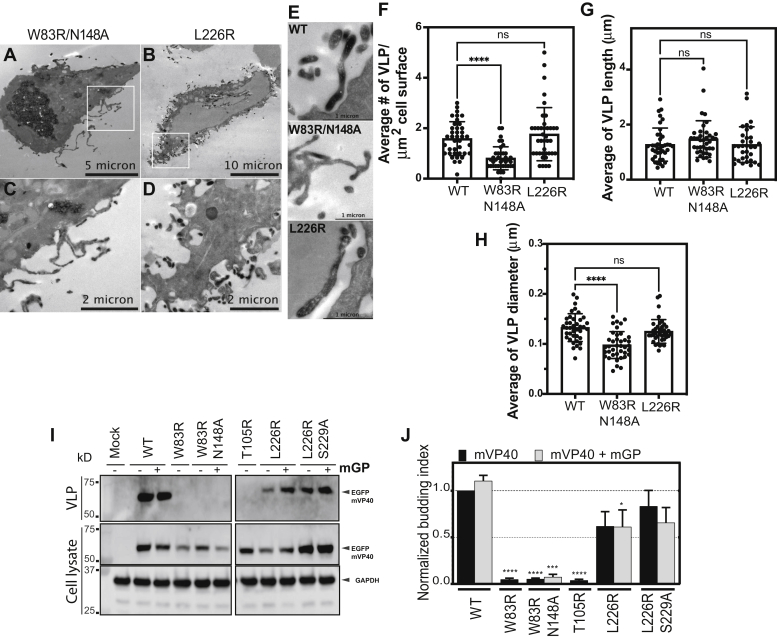
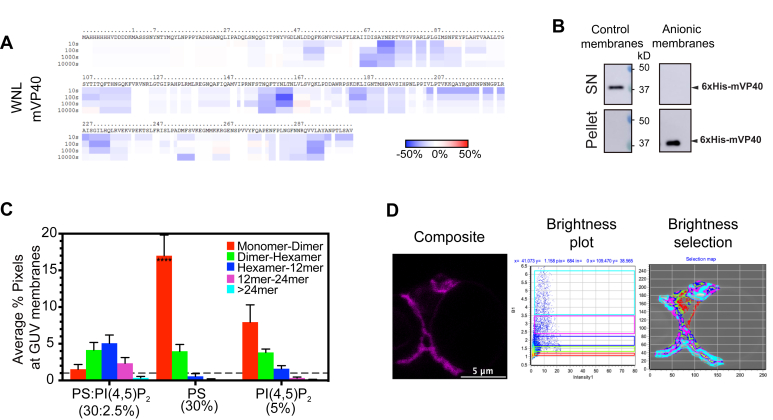
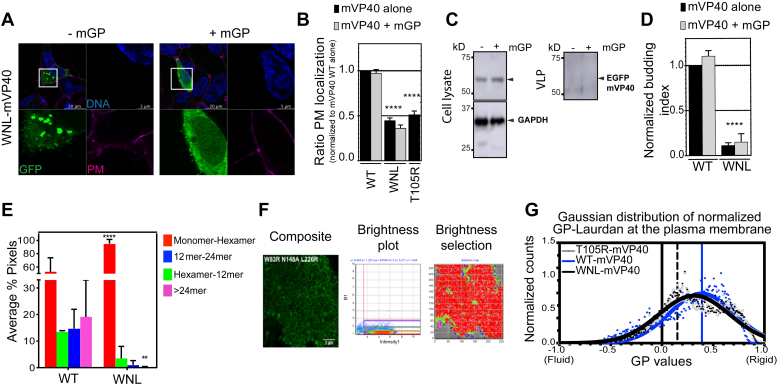
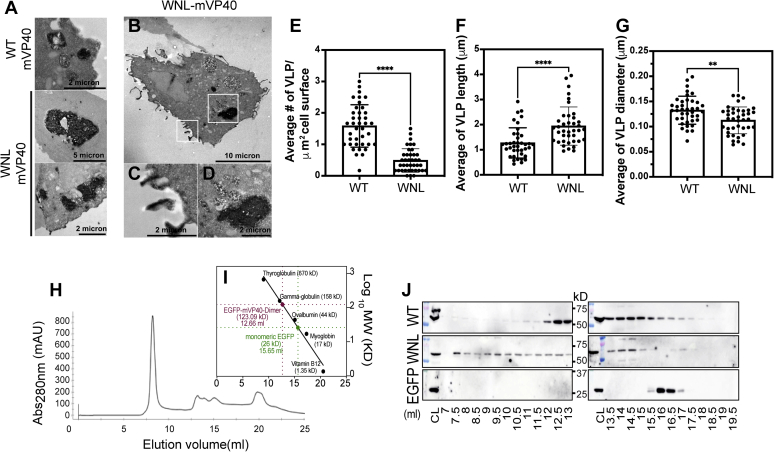
Marburg virus (MARV) is a lipid-enveloped virus harboring a negative-sense RNA genome, which has caused sporadic outbreaks of viral hemorrhagic fever in sub-Saharan Africa. MARV assembles and buds from the host cell plasma membrane where MARV matrix protein (mVP40) dimers associate with anionic lipids at the plasma membrane inner leaflet and undergo a dynamic and extensive self-oligomerization into the structural matrix layer. The MARV matrix layer confers the virion filamentous shape and stability but how host lipids modulate mVP40 oligomerization is mostly unknown. Using in vitro and cellular techniques, we present a mVP40 assembly model highlighting two distinct oligomerization interfaces: the (N-terminal domain [NTD] and C-terminal domain [CTD]) in mVP40. Cellular studies of NTD and CTD oligomerization interface mutants demonstrate the importance of each interface in matrix assembly. The assembly steps include protein trafficking to the plasma membrane, homo-multimerization that induced protein enrichment, plasma membrane fluidity changes, and elongations at the plasma membrane. An ascorbate peroxidase derivative (APEX)-transmission electron microscopy method was employed to closely assess the ultrastructural localization and formation of viral particles for wildtype mVP40 and NTD and CTD oligomerization interface mutants. Taken together, these studies present a mechanistic model of mVP40 oligomerization and assembly at the plasma membrane during virion assembly that requires interactions with phosphatidylserine for NTD-NTD interactions and phosphatidylinositol-4,5-bisphosphate for proper CTD-CTD interactions. These findings have broader implications in understanding budding of lipid-enveloped viruses from the host cell plasma membrane and potential strategies to target protein-protein or lipid-protein interactions to inhibit virus budding.

Keywords: Marburg virus; VP40; lipid bilayer; lipid-binding protein; lipid–protein interaction; phosphatidylinositol-4,5-bisphosphate; phosphatidylserine; phospholipid; plasma membrane; virus assembly.


Conflict of interest statement

Conflict of interest The authors declare they have no conflicts of interest with the contents of the article.

Figures

Figure 1
Figure 1
mVP40 potential oligomerization interfaces at NTD and CTD regions.A, zoomed in views of the structure of mVP40 at the NTD oligomer interface (top) indicating Trp83 and Asn148 residues (pink) involved in the oligomerization with an overlay of Ebola virus VP40 (eVP40) structure with corresponding residues Trp95 and Glu160 (purple), and at the CTD interface (bottom) showing the potential residues Leu226 and Ser229 involved in dimer–dimer interactions. Modeled using PyMOL (mVP40 Protein Data Bank ID: 5B0V) and (eVP40 Protein Data Bank ID: 4LDB). B, top and side views of a mVP40 filament (two hexamers formed through the NTD–NTD interface, Fig. S1). C and D, ribbon maps of W83R/N148A and L226R/S229A mutants, respectively, indicating the difference in deuteration percentage of mVP40 in the presence of PS-containing liposomes. Each row corresponds to each time point collected (10–1000 s). Color coding: blue indicates the regions that exchange slower and red indicates the regions that exchange faster in the presence of liposomes. CTD, C-terminal domain; NTD, N-terminal domain.
Figure 2
Figure 2
N-terminal domain and C-terminal domain oligomerization interfaces required for efficient mVP40 trafficking and oligomerization at the plasma membrane.A, confocal live images of cells expressing EGFP constructs (green) +/− glycoprotein mGP, stained for DNA (blue) and plasma membrane (PM, pink). B, ratio of PM retention from A quantified by calculating the integrated density of pixels at PM to total pixels within the cell and normalized to WT. C, average % pixels with each estimated oligomerization form from number and brightness analysis performed 24 h.p.t of HEK293 cells with EGFP-mVP40 constructs. Functional budding assays were performed to assess the capacity of WT-mVP40 and mutants to produce virus-like particles. Experimental and fitted normalized generalized polarization (GP) distribution curves of Laurdan dye across PM of HEK293 cells with EGFP (black dashed line) (D), mVP40 mutants of N-terminal domain (E), and C-terminal domain (F) oligomerization interfaces, compared with WT (blue line). GP values range from −1 (very fluid lipid domains) to +1 (very rigid lipid domains). The fitting procedure was performed using a nonlinear Gaussian curve. Values are reported as mean ± SEM (B) or SD (C) of three independent means. One-way ANOVA with multiple comparisons were performed (∗p < 0.05, ∗∗∗p < 0.0005, ∗∗∗∗p < 0.0001).
Figure 3
Figure 3
Cellular oligomerization defects of N-terminal domain and C-terminal domain interface mutants reduce VLP budding.A and B, are representative TEM micrographs of HEK293 cells coexpressing GBP-APEX2 and EGFP-mVP40 W83R/N148A and L226R, respectively. C and D, zoomed insets in (A) and (B), respectively. E, TEM micrographs of potential VLPs at cell surfaces when expressing EGFP-mVP40 indicated constructs. Quantification of the average number of VLP per μm2 of cell surface and VLP length and diameter measurements were performed on TEM micrographs are shown in (FH), respectively. For VLP length analysis, only full and non-bud VLP were measured. I, representative Western blot assays performed on VLPs (top) and cell samples (middle and bottom) from cells 24 h.p.t in the presence and absence of MARV glycoprotein (mGP). J, quantification of the budding index for each mVP40 protein (normalized to mVP40 WT) was determined by densitometry analysis. Values are reported as mean ± SD of three independent means. One-way ANOVA with multiple comparisons were performed (∗∗∗p < 0.0005, ∗∗∗∗p < 0.0001). VLP, virus-like particle.
Figure 4
Figure 4
N-terminal domain and C-terminal domain oligomerization interface mutants bind anionic membranes efficiently and display lipid-specific oligomerization profiles.A, plotted average % pixel from number and brightness analysis of WT-mVP40 enriched at giant unilamellar vesicle membranes indicating the oligomerization profile of mVP40. B, oligomerization profiles of W83R/N148A, L226R, the monomeric mutant T105R and His-tag alone at the PS:PI(4,5)P2-containing membranes. C, binding efficiency of WT-mVP40 (lane 1) and mutants (lane 2, T105R; lane 3, L226R; lane 4, W83R/N148A) to anionic membrane (30% PS:2.5% PI(4,5)P2) assessed by liposome sedimentation assay and quantified in (D). Values are reported as mean ± SEM (A and B) or ± SD (D) of three independent means. Two-way ANOVA with multiple comparisons were performed. (∗p < 0.05, ∗∗p < 0.005, ∗∗∗p < 0.0005, ∗∗∗∗p < 0.0001).
Figure 5
Figure 5
In vitro study of N-terminal domain/C-terminal domain oligomerization interfaces triple mutant WNL-mVP40.A, ribbon maps of W83R/N148A/L226R (WNL) mutant, indicating the difference in deuteration percentage in the presence of PC:PS (55%:45%) liposomes over the entire exchange period. Each row corresponds to each time point from 10 to 1000 s. Color coding: blue indicates the regions that exchange slower and red indicates the regions that exchange faster in the presence of liposomes. B, liposome sedimentation assay of WNL-mVP40 was performed using control membranes (no anionic lipids) or anionic membranes (30% PS:2.5% PI(4,5)P2). C, oligomerization profile of WNL according to different anionic membranes 30%PS:2.5%PI(4,5)P2 (molar ratio), 30% PS only, and 5% PI(4,5)P2 only, determined from number and brightness analysis. D, representative original composite of the time-lapsed images (left), the number of pixels versus intensity plot (middle), and brightness selection plot of the 30%PS:2.5%PI(4,5)P2-containing giant unilamellar vesicle (GUV) (right). Two-way ANOVA with multiple comparisons were performed compared with WT-mVP40. (∗∗∗∗p < 0.0001).
Figure 6
Figure 6
WNL-mVP40 mutant had impaired trafficking, oligomerization, and budding from the plasma membrane.A, HEK293 cells, expressing EGFP-constructs ± mGP, stained for DNA (blue) and plasma membrane (PM; pink). B, ratios of PM retention represented as averages ± SEM of three independent means. WT-mVP40 data are extracted from Figure 1B. Statistical analysis was performed as described in Figure 2 (∗∗∗∗p < 0.0001). C, Western blot assay performed on cells and virus-like particle (VLP) quantified in (D) as described in Figure 3. E, average % pixels of estimated oligomerization forms of EGFP- WT and WNL-mVP40 from number and brightness analysis of cellular EGFP-WNL-mVP40 24 h.p.t. (F). G, Gaussian fitted normalized GP index distribution curves of Laurdan across PM of cells expressing EGFP-WNL-mVP40 (black) compared with WT (blue) and T105R-mVP40 (gray) as described in Figure 2.
Figure 7
Figure 7
WNL-mVP40 mutant accumulates in intracellular structures. TEM micrographs of zoomed intracellular structures EGFP-mVP40 (WT or WNL) coexpressed with GBP-APEX2 in (A), while (B) and insets (C and D) show intracellular accumulations of WNL protein in cells. Quantification of the average number of virus-like particles (VLP) per μm2 of cell surface and VLP length and diameter measurements performed on TEM micrographs are shown in (EG), respectively. These analyses were performed as described in Figure 3. Values are reported as mean ± SD of three independent means. One-way ANOVA with multiple comparisons were performed (∗∗p < 0.005, ∗∗∗∗p < 0.0001). H, the chromatogram of gel filtration analysis of protein extract from HEK293 cells transfected with EGFP-WT-mVP40 shown as absorbance (280 nm) versus elution volume. Molecular mass standard curve is plotted in (I) as log values of molecular weights versus elution volume. J, Western blot analyses of each protein are indicated. EGFP empty vector served as a negative control. CL, cell lysate.
Figure 8
Figure 8
Molecular dynamics (MD) simulations of the oligomer interfaces ofmVP40.A, the mVP40 oligomer interface modeled based on eVP40 structure initially shows separated W83 residues as in eVP40 (Trp95) shown in (B). However, upon 150 ns MD simulation, the structure relaxes so that the interface residues W83 interact with each other. C, center of mass distance between Trp83 residues in mVP40 (black curve) and between Trp95 residues in eVP40 (red curve) as a function of time. D, dimer–dimer interface in the mVP40 filament (CTD from each monomer is shown in different colors). The hydrophobic residues within 3 Å of Leu226 at the mVP40 dimer–dimer interface are highlighted. The hydrophobic interaction at the dimer–dimer interface may provide an agile interface, giving flexibility to the filaments. E, zoom into dimer–dimer interface in the mVP40 filament formed through CTD–CTD linear oligomerization as proposed by Wan et al. (31). (CTD from each monomer is shown in different colors). CTD, C-terminal domain.

Similar articles

Cited by

References

    1. Leroy E.M., Gonzalez J.-P., Baize S. Ebola and Marburg haemorrhagic fever viruses: Major scientific advances, but a relatively minor public health threat for Africa. Clin. Microbiol. Infect. 2011;17:964–976. - PubMed
    1. World Health Organization . Elsevier; Amsterdam, Netherlands: 2019. Ebola Virus Disease: Democratic Republic of the Congo.
    1. Suzuki Y., Gojobori T. The origin and evolution of Ebola and Marburg viruses. Mol. Biol. Evol. 1997;4:800–806. - PubMed
    1. Breman J.G., Heymann D.L., Lloyd G., McCormick J.B., Miatudila M., Murphy F.A., Muyembé-Tamfun J.-J., Piot P., Ruppol J.-F., Sureau P., van der Groen G., Johnson K.M. Discovery and description of Ebola Zaire virus in 1976 and relevance to the west African epidemic during 2013–2016. J. Infect. Dis. 2016;214:S93–S101. - PMC - PubMed
    1. Slenczka W., Klenk H.D. Forty years of Marburg virus. J. Infect. Dis. 2007;196:S131–S135. - PubMed

Publication types

MeSH terms

LinkOut - more resources