

Unraveling the molecular crosstalk between Atherosclerosis and COVID-19 comorbidity
- PMID: 34020127
- PMCID: PMC8088080
- DOI: 10.1016/j.compbiomed.2021.104459
Unraveling the molecular crosstalk between Atherosclerosis and COVID-19 comorbidity
Abstract
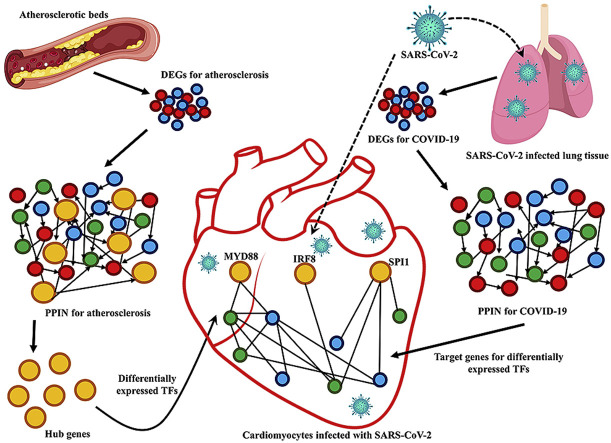
Background: Corona virus disease 2019 (COVID-19) caused by Severe Acute Respiratory Syndrome Coronavirus -2 (SARS-CoV-2) has created ruckus throughout the world. Growing epidemiological studies have depicted atherosclerosis as a comorbid factor of COVID-19. Though both these diseases are triggered via inflammatory rage that leads to injury of healthy tissues, the molecular linkage between them and their co-influence in causing fatality is not yet understood.
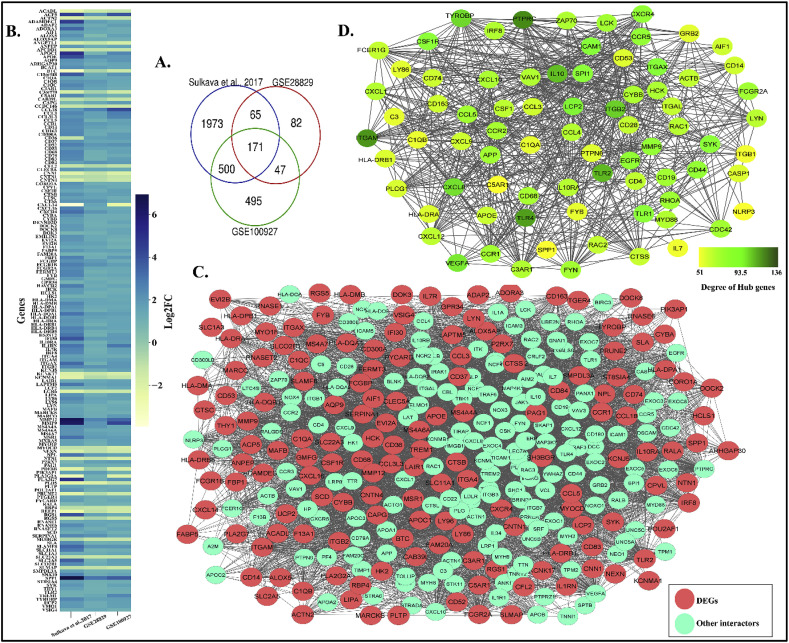
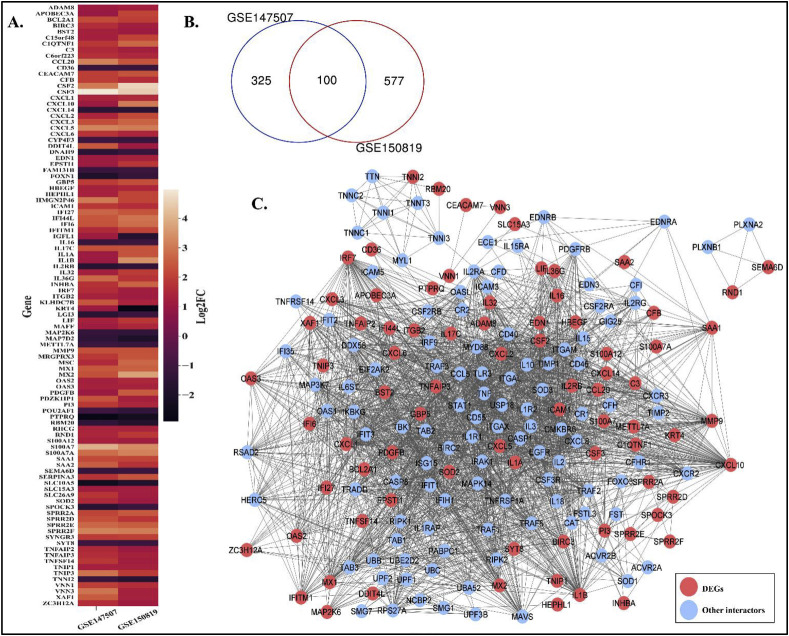
Methods: We have retrieved the data of differentially expressed genes (DEGs) for both atherosclerosis and COVID-19 from publicly available microarray and RNA-Seq datasets. We then reconstructed the protein-protein interaction networks (PPIN) for these diseases from protein-protein interaction data of corresponding DEGs. Using RegNetwork and TRRUST, we mapped the transcription factors (TFs) in atherosclerosis and their targets (TGs) in COVID-19 PPIN.
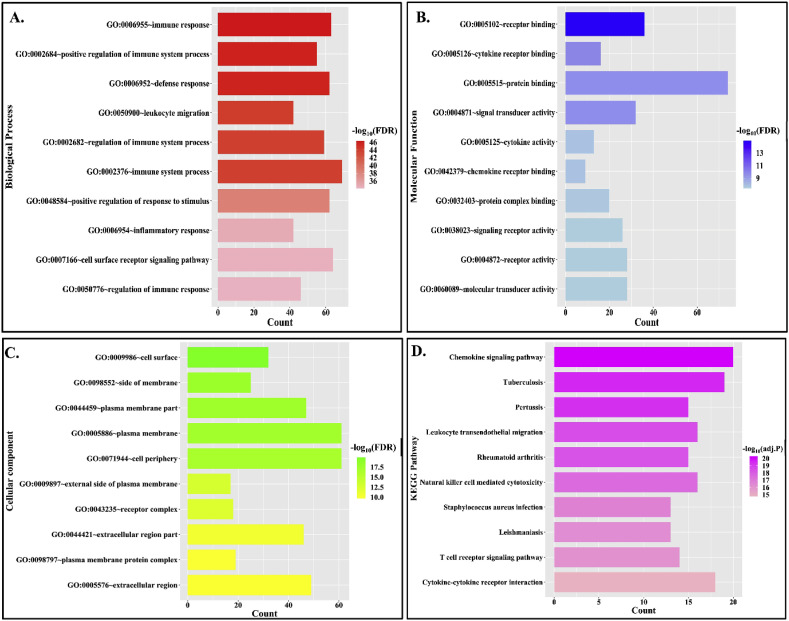
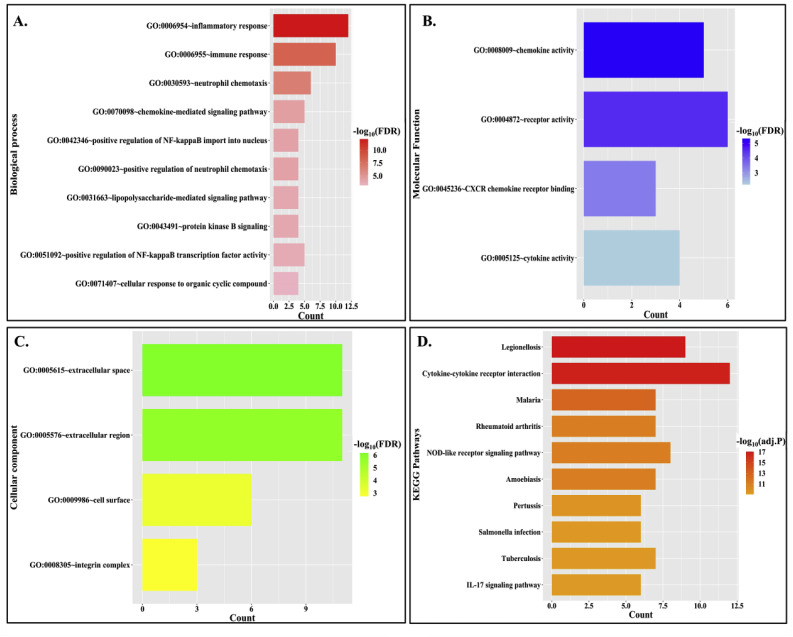
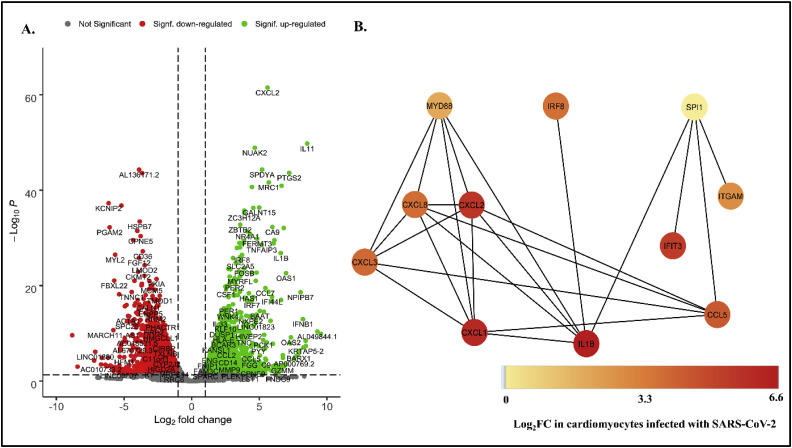
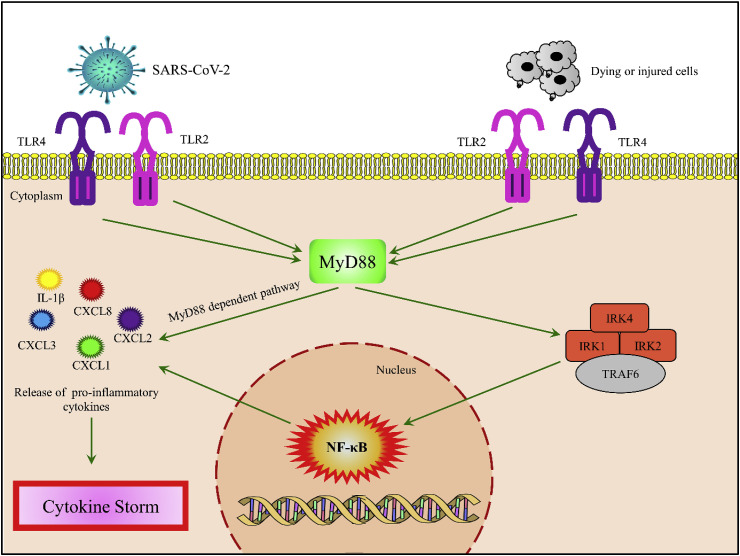
Results: From the atherosclerotic PPIN, we have identified 6 hubs (TLR2, TLR4, EGFR, SPI1, MYD88 and IRF8) as differentially expressed TFs that might control the expression of their 17 targets in COVID-19 PPIN. The important target proteins include IL1B, CCL5, ITGAM, IFIT3, CXCL1, CXCL2, CXCL3 and CXCL8. Consequent functional enrichment analysis of these TGs have depicted inflammatory responses to be overrepresented among the gene sets.
Conclusion: Finally, analyzing the DEGs in cardiomyocytes infected with SARS-CoV-2, we have concluded that MYD88 is a crucial linker of atherosclerosis and COVID-19, the co-existence of which lead to fatal outcomes. Anti-inflammatory therapy targeting MYD88 could be a potent strategy for combating this comorbidity.
Keywords: Atherosclerosis; COVID-19; Differentially expressed genes; Protein-protein interaction network; SARS-CoV-2; Transcription factors.
Copyright © 2021 Elsevier Ltd. All rights reserved.
Conflict of interest statement
The authors declare that there isn't any conflict of interest with any organization or financial entity.
Figures
Similar articles
-
Unraveling the molecular crosstalk and immune landscape between COVID-19 infections and ischemic heart failure comorbidity: New insights into diagnostic biomarkers and therapeutic approaches.Cell Signal. 2023 Dec;112:110909. doi: 10.1016/j.cellsig.2023.110909. Epub 2023 Sep 28. Cell Signal. 2023. PMID: 37777104
-
Bioinformatics Approaches to Identify the Comorbidity Complexities of <em>SARS-CoV-2</em> Infection with Crohn's Disease.J Coll Physicians Surg Pak. 2023 Oct;33(10):1093-1099. doi: 10.29271/jcpsp.2023.10.1093. J Coll Physicians Surg Pak. 2023. PMID: 37804012
-
Bioinformatics and system biology approaches to identify the diseasome and comorbidities complexities of SARS-CoV-2 infection with the digestive tract disorders.Brief Bioinform. 2021 Nov 5;22(6):bbab126. doi: 10.1093/bib/bbab126. Brief Bioinform. 2021. PMID: 33993223 Free PMC article.
-
Change of gene expression profiles in human cardiomyocytes and macrophages infected with SARS-CoV-2 and its significance.Zhong Nan Da Xue Xue Bao Yi Xue Ban. 2021 Nov 28;46(11):1203-1211. doi: 10.11817/j.issn.1672-7347.2021.210221. Zhong Nan Da Xue Xue Bao Yi Xue Ban. 2021. PMID: 34911854 Free PMC article. Chinese, English.
-
Identification of common molecular signatures of SARS-CoV-2 infection and its influence on acute kidney injury and chronic kidney disease.Front Immunol. 2023 Mar 21;14:961642. doi: 10.3389/fimmu.2023.961642. eCollection 2023. Front Immunol. 2023. PMID: 37026010 Free PMC article.
Cited by
-
Using bioinformatics and systems biology methods to identify the mechanism of interaction between COVID-19 and nonalcoholic fatty liver disease.Medicine (Baltimore). 2023 Jun 9;102(23):e33912. doi: 10.1097/MD.0000000000033912. Medicine (Baltimore). 2023. PMID: 37335656 Free PMC article.
-
Atherosclerosis and Inflammation: Insights from the Theory of General Pathological Processes.Int J Mol Sci. 2023 Apr 26;24(9):7910. doi: 10.3390/ijms24097910. Int J Mol Sci. 2023. PMID: 37175617 Free PMC article. Review.
-
Proteomic and metabolomic profiling of plasma uncovers immune responses in patients with Long COVID-19.Front Microbiol. 2024 Dec 27;15:1470193. doi: 10.3389/fmicb.2024.1470193. eCollection 2024. Front Microbiol. 2024. PMID: 39802657 Free PMC article.
-
Atherosclerosis, Cardiovascular Disorders and COVID-19: Comorbid Pathogenesis.Diagnostics (Basel). 2023 Jan 28;13(3):478. doi: 10.3390/diagnostics13030478. Diagnostics (Basel). 2023. PMID: 36766583 Free PMC article. Review.
-
Integrated analysis and exploration of potential shared gene signatures between carotid atherosclerosis and periodontitis.BMC Med Genomics. 2022 Oct 31;15(1):227. doi: 10.1186/s12920-022-01373-y. BMC Med Genomics. 2022. PMID: 36316672 Free PMC article.
References
-
- Xu Z., Shi L., Wang Y., Zhang J., Huang L., Zhang C., Liu S., Zhao P., Liu H., Zhu L., Tai Y., Bai C., Gao T., Song J., Xia P., Dong J., Zhao J., Wang F.S. Pathological findings of COVID-19 associated with acute respiratory distress syndrome. Lancet Respir. Med. 2020;8:420–422. doi: 10.1016/S2213-2600(20)30076-X. - DOI - PMC - PubMed
-
- Coperchini F., Chiovato L., Croce L., Magri F., Rotondi M. Cytokine and Growth Factor Reviews the cytokine storm in COVID-19 : an overview of the involvement of the chemokine/chemokine-receptor system. Cytokine Growth Factor Rev. 2020;53:25–32. doi: 10.1016/j.cytogfr.2020.05.003. - DOI - PMC - PubMed
MeSH terms
LinkOut - more resources
Full Text Sources
Other Literature Sources
Medical
Research Materials
Miscellaneous
