

Associations of circulating choline and its related metabolites with cardiometabolic biomarkers: an international pooled analysis
- PMID: 34020444
- PMCID: PMC8408854
- DOI: 10.1093/ajcn/nqab152
Associations of circulating choline and its related metabolites with cardiometabolic biomarkers: an international pooled analysis
Abstract
Background: Choline is an essential nutrient; however, the associations of choline and its related metabolites with cardiometabolic risk remain unclear.
Objective: We examined the associations of circulating choline, betaine, carnitine, and dimethylglycine (DMG) with cardiometabolic biomarkers and their potential dietary and nondietary determinants.
Methods: The cross-sectional analyses included 32,853 participants from 17 studies, who were free of cancer, cardiovascular diseases, chronic kidney diseases, and inflammatory bowel disease. In each study, metabolites and biomarkers were log-transformed and standardized by means and SDs, and linear regression coefficients (β) and 95% CIs were estimated with adjustments for potential confounders. Study-specific results were combined by random-effects meta-analyses. A false discovery rate <0.05 was considered significant.
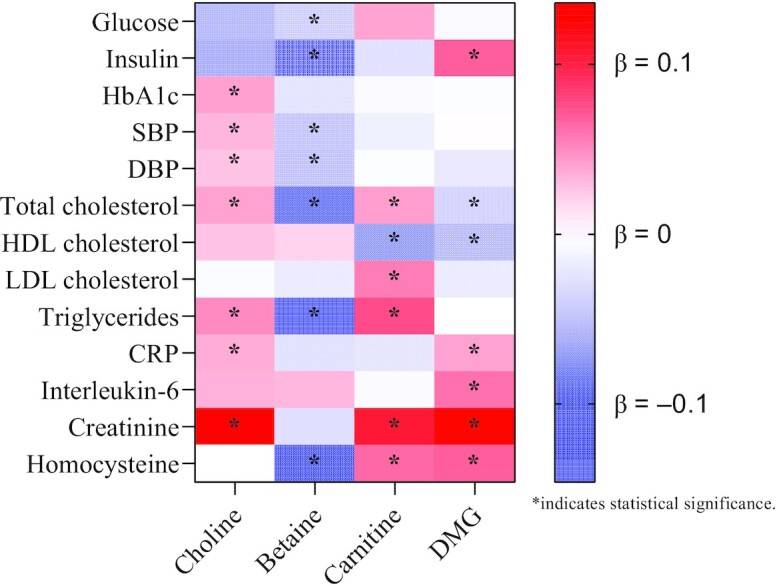
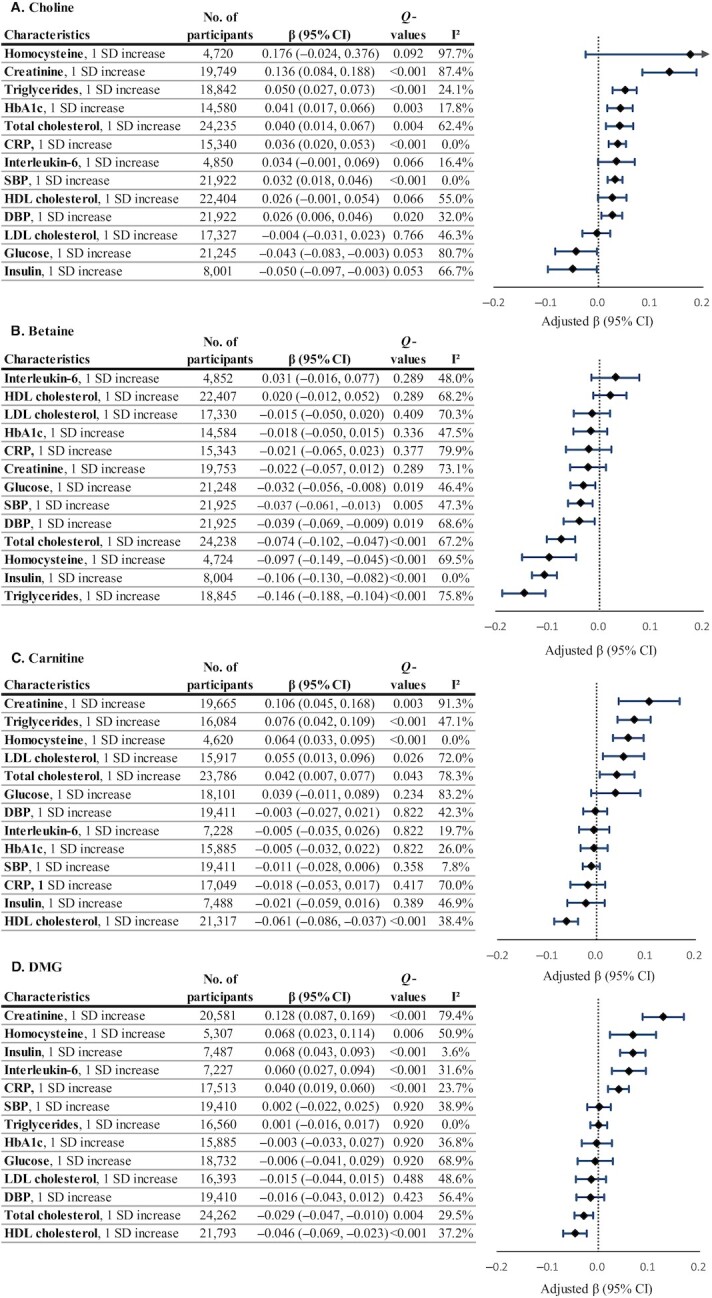
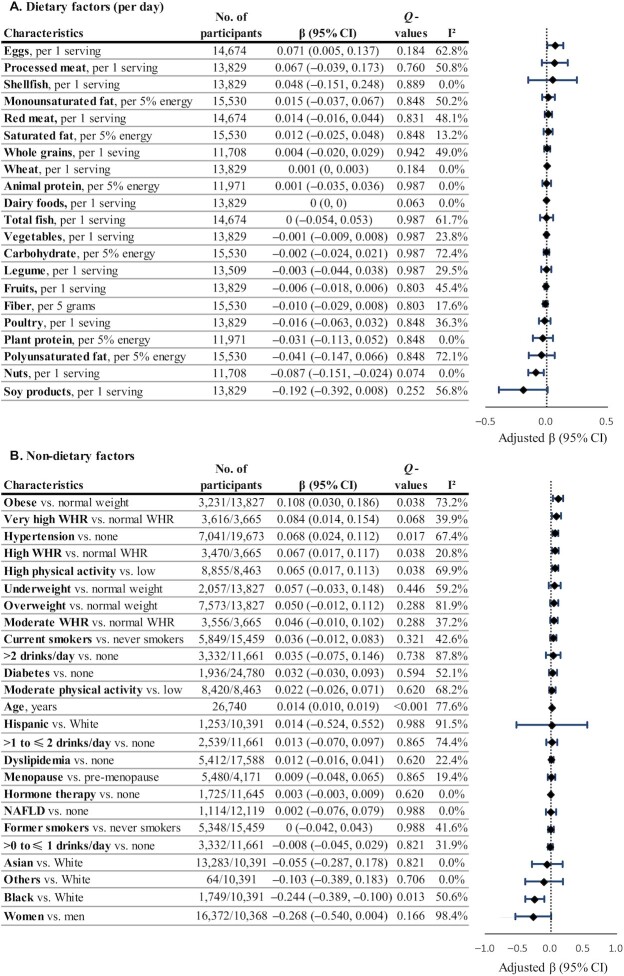
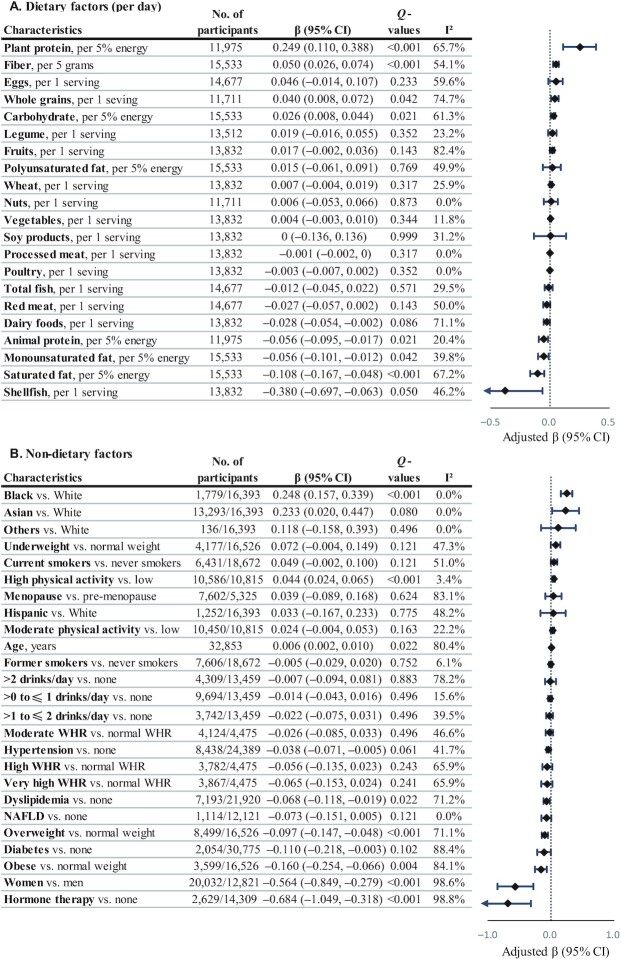
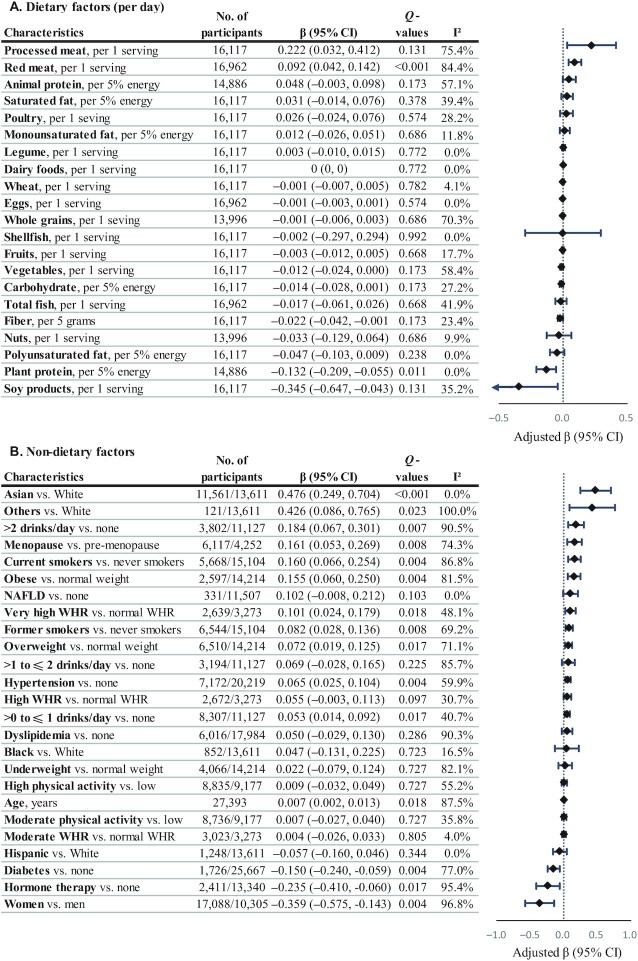
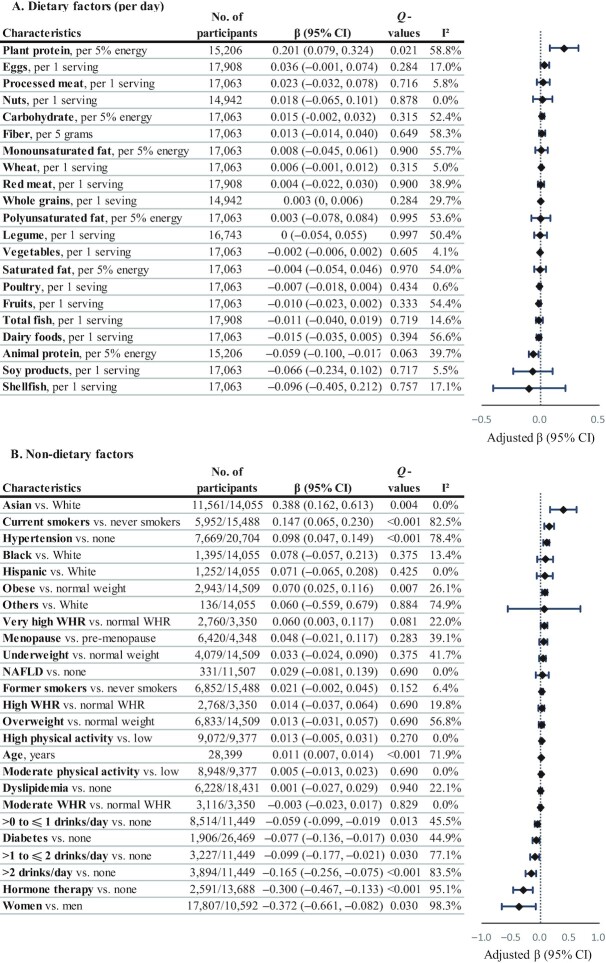
Results: We observed moderate positive associations of circulating choline, carnitine, and DMG with creatinine [β (95% CI): 0.136 (0.084, 0.188), 0.106 (0.045, 0.168), and 0.128 (0.087, 0.169), respectively, for each SD increase in biomarkers on the log scale], carnitine with triglycerides (β = 0.076; 95% CI: 0.042, 0.109), homocysteine (β = 0.064; 95% CI: 0.033, 0.095), and LDL cholesterol (β = 0.055; 95% CI: 0.013, 0.096), DMG with homocysteine (β = 0.068; 95% CI: 0.023, 0.114), insulin (β = 0.068; 95% CI: 0.043, 0.093), and IL-6 (β = 0.060; 95% CI: 0.027, 0.094), but moderate inverse associations of betaine with triglycerides (β = -0.146; 95% CI: -0.188, -0.104), insulin (β = -0.106; 95% CI: -0.130, -0.082), homocysteine (β = -0.097; 95% CI: -0.149, -0.045), and total cholesterol (β = -0.074; 95% CI: -0.102, -0.047). In the whole pooled population, no dietary factor was associated with circulating choline; red meat intake was associated with circulating carnitine [β = 0.092 (0.042, 0.142) for a 1 serving/d increase], whereas plant protein was associated with circulating betaine [β = 0.249 (0.110, 0.388) for a 5% energy increase]. Demographics, lifestyle, and metabolic disease history showed differential associations with these metabolites.
Conclusions: Circulating choline, carnitine, and DMG were associated with unfavorable cardiometabolic risk profiles, whereas circulating betaine was associated with a favorable cardiometabolic risk profile. Future prospective studies are needed to examine the associations of these metabolites with incident cardiovascular events.
Keywords: betaine; biomarkers; cardiometabolic disease; carnitine; choline; dimethylglycine.
© The Author(s) 2021. Published by Oxford University Press on behalf of the American Society for Nutrition.
Figures
Similar articles
-
Associations of plasma trimethylamine N-oxide, choline, carnitine, and betaine with inflammatory and cardiometabolic risk biomarkers and the fecal microbiome in the Multiethnic Cohort Adiposity Phenotype Study.Am J Clin Nutr. 2020 Jun 1;111(6):1226-1234. doi: 10.1093/ajcn/nqaa015. Am J Clin Nutr. 2020. PMID: 32055828 Free PMC article.
-
Choline and its metabolites are differently associated with cardiometabolic risk factors, history of cardiovascular disease, and MRI-documented cerebrovascular disease in older adults.Am J Clin Nutr. 2017 Jun;105(6):1283-1290. doi: 10.3945/ajcn.116.137158. Epub 2017 Mar 29. Am J Clin Nutr. 2017. PMID: 28356272 Free PMC article.
-
Trimethylamine N-oxide, choline and its metabolites are associated with the risk of non-alcoholic fatty liver disease.Br J Nutr. 2024 Jun 14;131(11):1915-1923. doi: 10.1017/S0007114524000631. Epub 2024 Mar 6. Br J Nutr. 2024. PMID: 38443197
-
Serum betaine and dimethylglycine in mid-pregnancy and the risk of gestational diabetes mellitus: a case-control study.Endocrine. 2024 Aug;85(2):649-659. doi: 10.1007/s12020-024-03732-4. Epub 2024 Mar 6. Endocrine. 2024. PMID: 38448678
-
The Relationship of Circulating Choline and Choline-Related Metabolite Levels with Health Outcomes: A Scoping Review of Genome-Wide Association Studies and Mendelian Randomization Studies.Adv Nutr. 2024 Feb;15(2):100164. doi: 10.1016/j.advnut.2023.100164. Epub 2023 Dec 20. Adv Nutr. 2024. PMID: 38128611 Free PMC article.
Cited by
-
Plasma metabolomic profile in orthostatic intolerance children with high levels of plasma homocysteine.Ital J Pediatr. 2024 Mar 14;50(1):52. doi: 10.1186/s13052-024-01601-4. Ital J Pediatr. 2024. PMID: 38486257 Free PMC article.
-
Serum metabolomics in chickens infected with Cryptosporidium baileyi.Parasit Vectors. 2021 Jun 26;14(1):336. doi: 10.1186/s13071-021-04834-y. Parasit Vectors. 2021. PMID: 34174965 Free PMC article.
-
Circulating choline pathway nutrients and risk of moyamoya disease.Front Nutr. 2022 Aug 1;9:953426. doi: 10.3389/fnut.2022.953426. eCollection 2022. Front Nutr. 2022. PMID: 35978955 Free PMC article.
-
Trans-omics analyses identify the biochemical network of LPCAT1 associated with coronary artery disease.Biomark Res. 2025 Aug 20;13(1):107. doi: 10.1186/s40364-025-00821-y. Biomark Res. 2025. PMID: 40830908 Free PMC article.
-
Metabolomic data presents challenges for epidemiological meta-analysis: a case study of childhood body mass index from the ECHO consortium.Metabolomics. 2024 Jan 24;20(1):16. doi: 10.1007/s11306-023-02082-y. Metabolomics. 2024. PMID: 38267770 Free PMC article.
References
-
- Ueland PM. Choline and betaine in health and disease. J Inherit Metab Dis. 2011;34:3–15. - PubMed
Publication types
MeSH terms
Substances
Grants and funding
- HHSN268201600003C/HL/NHLBI NIH HHS/United States
- MR/L01341X/1/MRC_/Medical Research Council/United Kingdom
- R21 HL140375/HL/NHLBI NIH HHS/United States
- R01 HL133932/HL/NHLBI NIH HHS/United States
- N01HC95168/HL/NHLBI NIH HHS/United States
- HHSN268201500003I/HL/NHLBI NIH HHS/United States
- N01HC95163/HL/NHLBI NIH HHS/United States
- HHSN268201300008C/HL/NHLBI NIH HHS/United States
- HHSN268201600018C/HL/NHLBI NIH HHS/United States
- HPRU-2012-10141/DH_/Department of Health/United Kingdom
- MR/M016560/1/BHF_/British Heart Foundation/United Kingdom
- U01 CA202979/CA/NCI NIH HHS/United States
- R01 DK108159/DK/NIDDK NIH HHS/United States
- 212904/Z/18/Z/WT_/Wellcome Trust/United Kingdom
- HHSN268201600001C/HL/NHLBI NIH HHS/United States
- R01 HL060944/HL/NHLBI NIH HHS/United States
- HHSN268201800005I/HL/NHLBI NIH HHS/United States
- N01HC95161/HL/NHLBI NIH HHS/United States
- HHSN268201800004I/HL/NHLBI NIH HHS/United States
- N01 HC095169/HL/NHLBI NIH HHS/United States
- HHSN268201500001C/HL/NHLBI NIH HHS/United States
- R01 CA067262/CA/NCI NIH HHS/United States
- N01HC95162/HL/NHLBI NIH HHS/United States
- UM1 CA173640/CA/NCI NIH HHS/United States
- K01 HL127159/HL/NHLBI NIH HHS/United States
- UL1 TR001420/TR/NCATS NIH HHS/United States
- U01 CA067262/CA/NCI NIH HHS/United States
- U01 CA206110/CA/NCI NIH HHS/United States
- N01HC95165/HL/NHLBI NIH HHS/United States
- MR/M016560/1/MRC_/Medical Research Council/United Kingdom
- HHSN268201800003I/HL/NHLBI NIH HHS/United States
- HHSN268201800007I/HL/NHLBI NIH HHS/United States
- N01HC95167/HL/NHLBI NIH HHS/United States
- HHSN268201600002C/HL/NHLBI NIH HHS/United States
- U01 CA167552/CA/NCI NIH HHS/United States
- R01 HL149779/HL/NHLBI NIH HHS/United States
- N01HC95159/HL/NHLBI NIH HHS/United States
- HHSN268201600004C/HL/NHLBI NIH HHS/United States
- HHSN268201500001I/HL/NHLBI NIH HHS/United States
- P30 CA068485/CA/NCI NIH HHS/United States
- N01HC95164/HL/NHLBI NIH HHS/United States
- R01 HL111362/HL/NHLBI NIH HHS/United States
- MR/R023484/1/MRC_/Medical Research Council/United Kingdom
- R01 DK118062/DK/NIDDK NIH HHS/United States
- UL1 TR001079/TR/NCATS NIH HHS/United States
- WT_/Wellcome Trust/United Kingdom
- N01HC95166/HL/NHLBI NIH HHS/United States
- UM1 CA182910/CA/NCI NIH HHS/United States
- N01HC95160/HL/NHLBI NIH HHS/United States
- HHSN268201800006I/HL/NHLBI NIH HHS/United States
- UL1-TR-000040/HB/NHLBI NIH HHS/United States
LinkOut - more resources
Full Text Sources
Other Literature Sources
Medical
