

Trends in junk food consumption among US children and adults, 2001-2018
- PMID: 34020459
- PMCID: PMC8408879
- DOI: 10.1093/ajcn/nqab129
Trends in junk food consumption among US children and adults, 2001-2018
Abstract
Background: Trends in junk food consumption, a risk for obesity, are not well established.
Objectives: We examined national trends in types of junk food (excluding beverages) and their sources (grocery, restaurants, schools, etc.), overall and in population subgroups.
Methods: We assessed 29,970 children (aged 2-19 y) and 44,501 adults (aged ≥20 y) with 24-h dietary recall data from 9 NHANES cycles (2001-2002 to 2017-2018). Trends in junk food were assessed over time using 1-d values for individuals with single recalls and 2-d means for others.
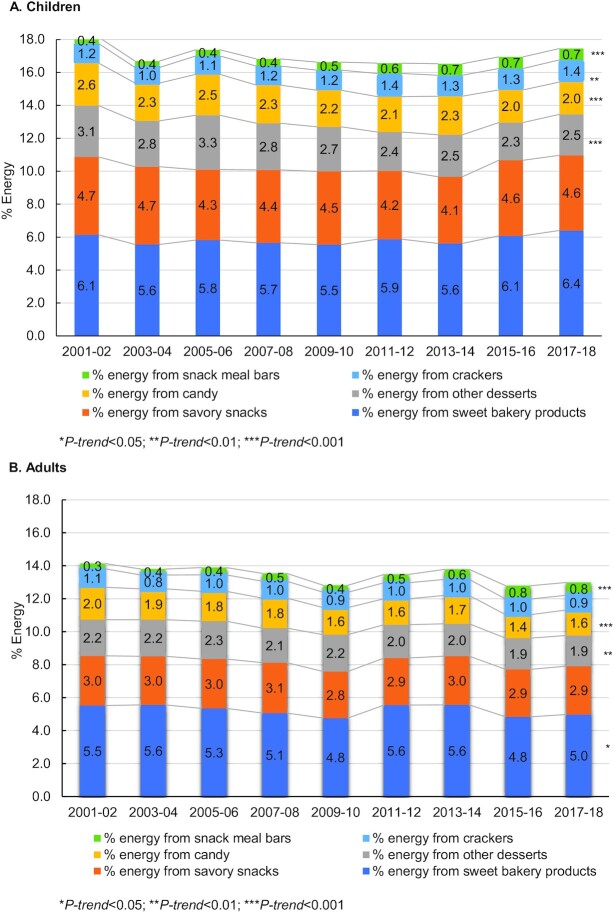
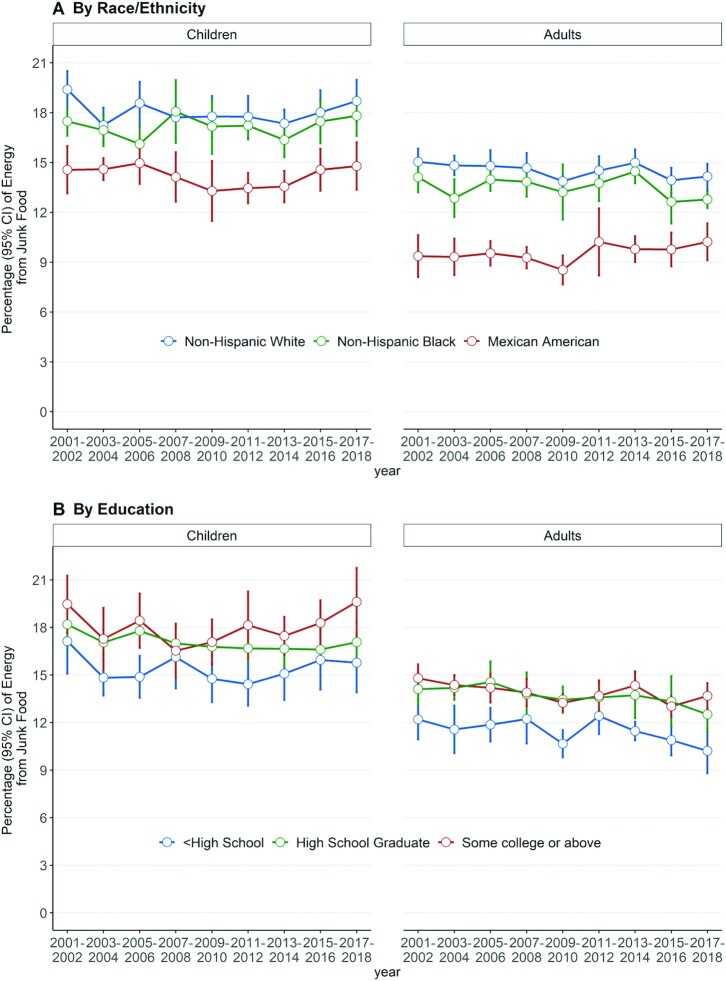
Results: From 2001 to 2018, percent energy (%E) from junk food remained stable for children (from 18.1% to 17.5%, P-trend = 0.25) and decreased for adults (14.1% to 13.0%, P-trend = 0.002). Among children, increases occurred in %E from crackers (1.19% to 1.35%) and snack/meal bars (0.38% to 0.69%) and decreases in candy (2.58% to 1.96%) and other desserts (3.11% to 2.48%) (all P-trends < 0.01). Among adults, increases occurred in snack/meal bars (0.31% to 0.78%, P-trend < 0.001) and decreases in candy (1.97% to 1.55%; P-trend < 0.001), sweet bakery products (5.52% to 4.98%; P-trend = 0.04), and other desserts (2.19% to 1.86%; P-trend = 0.001). In 2017-2018, grocery stores provided the largest proportion of junk food (72.7% for children, 77.1% for adults), followed by other sources (13.1%, 12.1%), restaurants (8.05%, 9.11%), schools (4.86%), and worksites (1.99%). In both children and adults, junk food intake was higher among non-Hispanic white and black Americans compared with Mexican Americans, among those with higher compared with lower education, among women compared with men, and among older compared with younger adults. In sensitivity analyses using only 1-d recalls, mean junk food intake each cycle was ∼0.8-1.0 and 0.3-0.4%E units higher in children and adults, respectively, with otherwise similar trends and subgroup differences over time.
Conclusions: From 2001 to 2018, %E from junk food represented nearly 1 in 5 calories among children, without change, and nearly 1 in 7 calories, with modest decrease, among adults, with disparities in subgroups.
Keywords: % of energy (%E); NHANES; adults; children; grocery stores; junk food; restaurants; school; worksite.
© The Author(s) 2021. Published by Oxford University Press on behalf of the American Society for Nutrition.
Figures
Comment in
-
Junk food consumption trends point to the need for retail policies.Am J Clin Nutr. 2021 Sep 1;114(3):837-838. doi: 10.1093/ajcn/nqab189. Am J Clin Nutr. 2021. PMID: 34236389 No abstract available.
References
-
- Luscher TF. Nutrition, obesity, diabetes, and cardiovascular outcomes: a deadly association. Eur Heart J. 2020;41(28):2603–7. - PubMed
Publication types
MeSH terms
Grants and funding
LinkOut - more resources
Full Text Sources
Other Literature Sources
