Review
. 2021 May 20;22(3):bbaa190.
doi: 10.1093/bib/bbaa190.

A comprehensive survey of regulatory network inference methods using single cell RNA sequencing data

Affiliations
Review

A comprehensive survey of regulatory network inference methods using single cell RNA sequencing data

Hung Nguyen et al. Brief Bioinform. .

Abstract

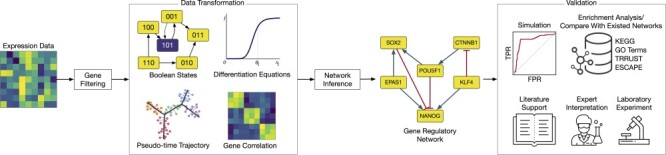
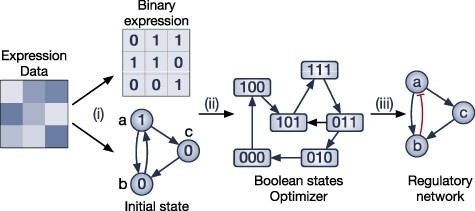
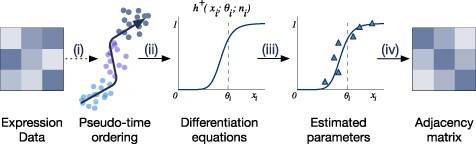
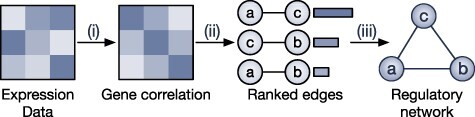
Gene regulatory network is a complicated set of interactions between genetic materials, which dictates how cells develop in living organisms and react to their surrounding environment. Robust comprehension of these interactions would help explain how cells function as well as predict their reactions to external factors. This knowledge can benefit both developmental biology and clinical research such as drug development or epidemiology research. Recently, the rapid advance of single-cell sequencing technologies, which pushed the limit of transcriptomic profiling to the individual cell level, opens up an entirely new area for regulatory network research. To exploit this new abundant source of data and take advantage of data in single-cell resolution, a number of computational methods have been proposed to uncover the interactions hidden by the averaging process in standard bulk sequencing. In this article, we review 15 such network inference methods developed for single-cell data. We discuss their underlying assumptions, inference techniques, usability, and pros and cons. In an extensive analysis using simulation, we also assess the methods' performance, sensitivity to dropout and time complexity. The main objective of this survey is to assist not only life scientists in selecting suitable methods for their data and analysis purposes but also computational scientists in developing new methods by highlighting outstanding challenges in the field that remain to be addressed in the future development.

Keywords: RNA sequencing; gene regulatory network; scRNA-seq; simulation studies; single-cell data.


Figures

Figure 1
Figure 1
The overall workflow of GRN inference methods. The methods start with filtering genes based on their variability or a priori knowledge. They next construct intermediate data depending on the modeling and data assumption and then infer the network. The output of these methods can be either co-expression networks which are undirected from top selected connections or directed networks with regulatory relationships between genes. To evaluate the constructed networks, each method adopts different validation techniques, including using simulation, enrichment analysis, literature support, and expert interpretation and conducting additional laboratory experiments.
Figure 2
Figure 2
The overall workflow of methods using the boolean model. (i) These methods first binarize the gene expression data and then generate the initial boolean states. (ii) The methods optimize the states of the model with respect to the binary values. (iii) The methods output the GRN with activation and repression edges or a set of boolean functions.
Figure 3
Figure 3
The overall workflow of methods using differential equations. (i) Pseudo-temporal ordering of cells is inferred using external software or embedded functions. (ii) The methods use differential equations to describe the relationship between genes with respect to the inferred time. (iii) Parameters used in the model are estimated using different optimization techniques. (iv) Using the optimized parameters, the relationship between genes are inferred from the declared differential equations to output an affinity matrix of the GRN.
Figure 4
Figure 4
The overall workflow of methods using gene expression correlation. (i) The methods first initialize the weights of the edges by calculating the expression correlation for each gene pair. (ii) The methods perform a hypothesis testing to estimate the significance of each edge and then remove edges that are considered insignificant using a predefined significance threshold. (iii) The methods output the largest connected component.
Figure 5
Figure 5
The overall workflow of methods that calculate genes correlation based on pseudo-time ordering. (i) The methods either infer the pseudo-temporal ordering of the cells or require users to provide the time ordering. (ii) The methods divide the data into smaller time windows and then calculate the gene correlation for each time window. (iii) The methods then aggregate (ensemble strategy) multiple correlation matrices into one single adjacency matrix that represents the GRN.
Figure 6
Figure 6
Performance of 14 GRN inference methods using 100 simulated datasets with 200 samples and varying number of genes (20, 500, 1000, 2000 and 3000). For each specific number of genes, we generated 20 datasets, reconstructed the networks using the GRN inference methods and compared the constructed networks against the ground truth (reference networks). The horizontal axis shows the methods while the vertical axis shows the AUROC values that represent the accuracy of the methods. Only six methods are able to analyze the datasets with 3000 genes: SCODE, Information Measures, NLNET, SCENIC, LEAP and SCIMITAR. In all scenarios, SCENIC has the highest median AUROC values.
Figure 7
Figure 7
Performance of network inference methods with different levels of sparsity using 25 simulated datasets (5 datasets per sparsity level). The horizontal axis shows the methods while the vertical axis shows the AUROC values that represent the quality of the constructed networks. At each level of sparsity, we show the mean AUROC of five datasets for each method. SCOUP is the most stable method. It produces AUROC values that are consistently above 0.5 with very low variability across five sparsity levels.
Figure 8
Figure 8
Running time of network inference methods with varying numbers of genes (panel A) and samples (panel B) in the formula image scale of minutes. Overall, LEAP and NLNET are the fastest methods that can finish every single analysis in minutes.

References

    1. Emmert-Streib F, Dehmer M, Haibe-Kains B. Gene regulatory networks and their applications: understanding biological and medical problems in terms of networks. Front Cell Dev Biol 2014; 2:38. - PMC - PubMed
    1. De Smet R, Marchal K. Advantages and limitations of current network inference methods. Nat Rev Microbiol 2010; 8(10): 717–29. - PubMed
    1. Langfelder P, Horvath S. WGCNA: an R package for weighted correlation network analysis. BMC Bioinformatics 2008; 9(1): 559. - PMC - PubMed
    1. Huynh-Thu VA, Irrthum A, Wehenkel L, et al. Inferring regulatory networks from expression data using tree-based methods. PLoS One 2010; 5(9): 1–10. - PMC - PubMed
    1. Faith JJ, Hayete B, Thaden JT, et al. Large-scale mapping and validation of Escherichia coli transcriptional regulation from a compendium of expression profiles. PLoS Biol 2007; 5(1): 1–13. - PMC - PubMed

Publication types