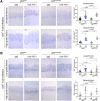
Local Anti-PD-1 Delivery Prevents Progression of Premalignant Lesions in a 4NQO-Oral Carcinogenesis Mouse Model
- PMID: 34021022
- PMCID: PMC8338806
- DOI: 10.1158/1940-6207.CAPR-20-0607
Local Anti-PD-1 Delivery Prevents Progression of Premalignant Lesions in a 4NQO-Oral Carcinogenesis Mouse Model
Abstract
Although the principle of systemic treatment to prevent the progression of oral premalignant lesions (OPL) has been demonstrated, there remains a lack of consensus about an optimal approach that balances clinical efficacy with toxicity concerns. Recent advances in cancer therapy using approaches targeting the tumor immune microenvironment (TIME) including immune-checkpoint inhibitors indicate that these agents have significant clinically activity against different types of cancers, including oral cancer, and therefore they may provide an effective oral cancer prevention strategy for patients with OPLs. Our past work showed that systemic delivery of a monoclonal antibody to the programmed death receptor 1 (PD-1) immune checkpoint can inhibit the progression of OPLs to oral cancer in a syngeneic murine oral carcinogenesis model. Here we report a novel approach of local delivery of a PD-1 immune-checkpoint inhibitor loaded using a hydrogel, which significantly reduces the progression of OPLs to carcinomas. In addition, we detected a significant infiltration of regulatory T cells associated with oral lesions with p53 mutation, and a severe loss of expression of STING, which correlated with a decreased infiltration of dendritic cells in the oral lesions. However, a single local dose of PD-1 inhibitor was found to restore stimulator of interferon response cGAMP interactor 1 (STING) and CD11c expression and increase the infiltration of CD8+ T cells into the TIME irrespective of the p53 mutational status. Overall, we provide evidence for the potential clinical value of local delivery of biomaterials loaded with anti-PD-1 antibodies to prevent malignant progression of OPLs. PREVENTION RELEVANCE: Oral cancer is an aggressive disease, with an overall survival rate of 50%. Preinvasive histologic abnormalities such as tongue dysplasia represent an early stage of oral cancer; however, there are no treatments to prevent oral carcinoma progression. Here, we combined biomaterials loaded with an immunotherapeutic agent preventing oral cancer progression.
©2021 The Authors; Published by the American Association for Cancer Research.
Figures


Similar articles
-
PD-1 Blockade Prevents the Development and Progression of Carcinogen-Induced Oral Premalignant Lesions.Cancer Prev Res (Phila). 2017 Dec;10(12):684-693. doi: 10.1158/1940-6207.CAPR-17-0108. Epub 2017 Oct 10. Cancer Prev Res (Phila). 2017. PMID: 29018057 Free PMC article.
-
Targeting of CD40 and PD-L1 Pathways Inhibits Progression of Oral Premalignant Lesions in a Carcinogen-induced Model of Oral Squamous Cell Carcinoma.Cancer Prev Res (Phila). 2021 Mar;14(3):313-324. doi: 10.1158/1940-6207.CAPR-20-0418. Epub 2020 Dec 4. Cancer Prev Res (Phila). 2021. PMID: 33277316
-
Oral-specific ablation of Klf4 disrupts epithelial terminal differentiation and increases premalignant lesions and carcinomas upon chemical carcinogenesis.J Oral Pathol Med. 2015 Nov;44(10):801-9. doi: 10.1111/jop.12307. Epub 2015 Jan 21. J Oral Pathol Med. 2015. PMID: 25605610
-
ICI-based therapies: A new strategy for oral potentially malignant disorders.Oral Oncol. 2023 May;140:106388. doi: 10.1016/j.oraloncology.2023.106388. Epub 2023 Apr 11. Oral Oncol. 2023. PMID: 37054586 Review.
-
Platinum-based chemotherapy in combination with PD-1/PD-L1 inhibitors: preclinical and clinical studies and mechanism of action.Expert Opin Drug Deliv. 2021 Feb;18(2):187-203. doi: 10.1080/17425247.2021.1825376. Epub 2020 Oct 5. Expert Opin Drug Deliv. 2021. PMID: 32954856 Review.
Cited by
-
Polypodium leucotomos targets multiple aspects of oral carcinogenesis and it is a potential antitumor phytotherapy against tongue cancer growth.Front Pharmacol. 2023 Jan 5;13:1098374. doi: 10.3389/fphar.2022.1098374. eCollection 2022. Front Pharmacol. 2023. PMID: 36686704 Free PMC article.
-
Immunoprevention of non-viral cancers: challenges and strategies for early intervention.Cancer Cell Int. 2025 May 28;25(1):196. doi: 10.1186/s12935-025-03817-8. Cancer Cell Int. 2025. PMID: 40437549 Free PMC article. Review.
-
Applications of Hydrogels in Drug Delivery for Oral and Maxillofacial Diseases.Gels. 2023 Feb 9;9(2):146. doi: 10.3390/gels9020146. Gels. 2023. PMID: 36826316 Free PMC article. Review.
-
Nanofibrous Peptide Hydrogels Leveraging Histidine to Modulate pH-Responsive Supramolecular Assembly and Antibody Release.Biomacromolecules. 2025 Jan 13;26(1):490-502. doi: 10.1021/acs.biomac.4c01296. Epub 2024 Dec 30. Biomacromolecules. 2025. PMID: 39801309
-
Biomaterials for enhanced immunotherapy.APL Bioeng. 2022 Dec 16;6(4):041502. doi: 10.1063/5.0125692. eCollection 2022 Dec. APL Bioeng. 2022. PMID: 36561511 Free PMC article. Review.
References
-
- Califano J, van der RP, Westra W, Nawroz H, Clayman G, Piantadosi S, et al. . Genetic progression model for head and neck cancer: implications for field cancerization. Cancer Res 1996;56:2488–92. - PubMed
-
- Califano J, Westra WH, Meininger G, Corio R, Koch WM, Sidransky D. Genetic progression and clonal relationship of recurrent premalignant head and neck lesions. Clin Cancer Res 2000;6:347–52. - PubMed
-
- Ernani V, Saba NF. Oral cavity cancer: risk factors, pathology, and management. Oncology 2015;89:187–95. - PubMed
Publication types
MeSH terms
Substances
Grants and funding
LinkOut - more resources
Full Text Sources
Other Literature Sources
Medical
Research Materials
Miscellaneous

