. 2021 May 21;6(59):eabe1935.
doi: 10.1126/sciimmunol.abe1935.

Cutaneous innate immune tolerance is mediated by epigenetic control of MAP2K3 by HDAC8/9

Affiliations

Cutaneous innate immune tolerance is mediated by epigenetic control of MAP2K3 by HDAC8/9

Yu Sawada et al. Sci Immunol. .

Abstract

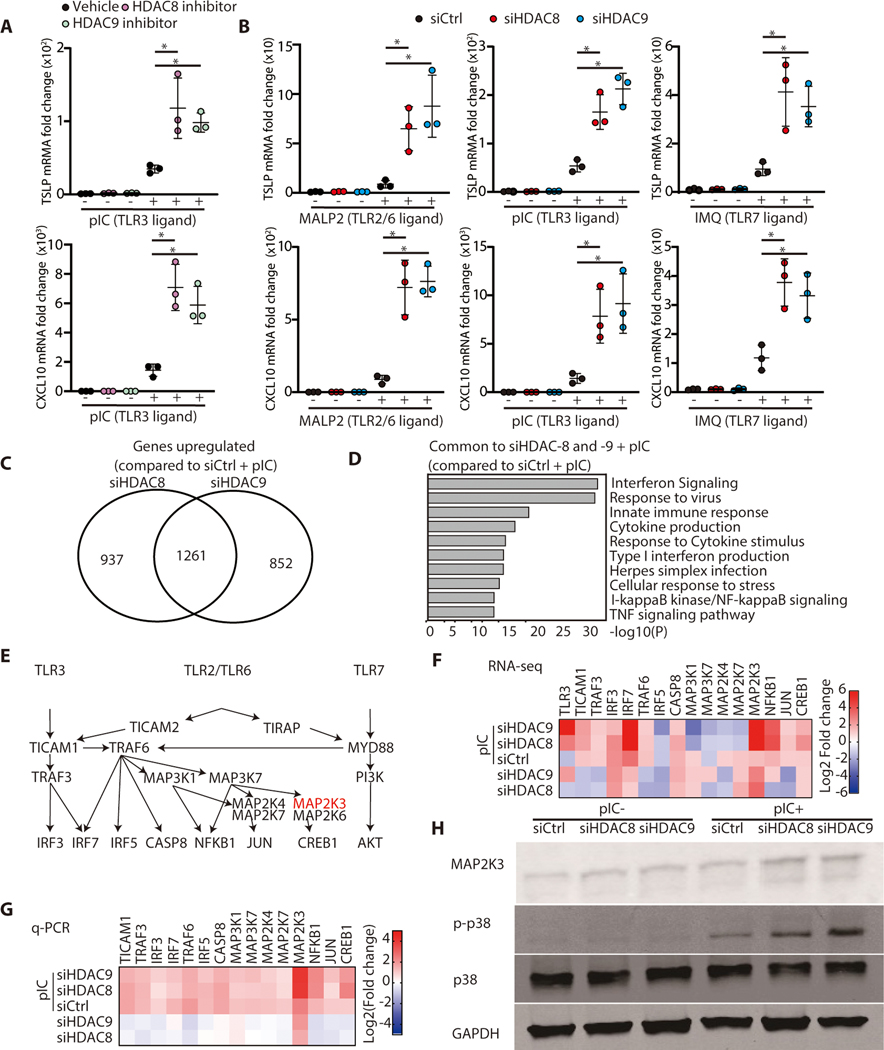
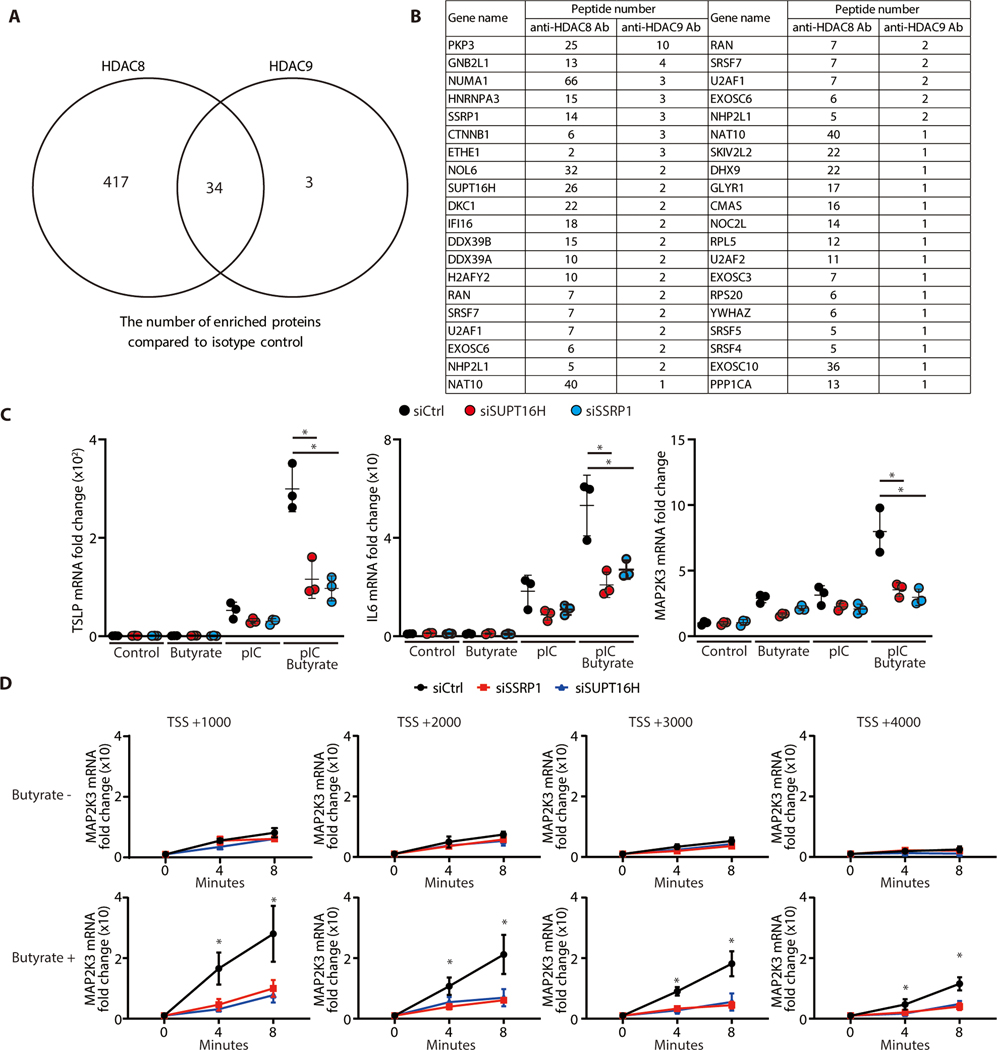
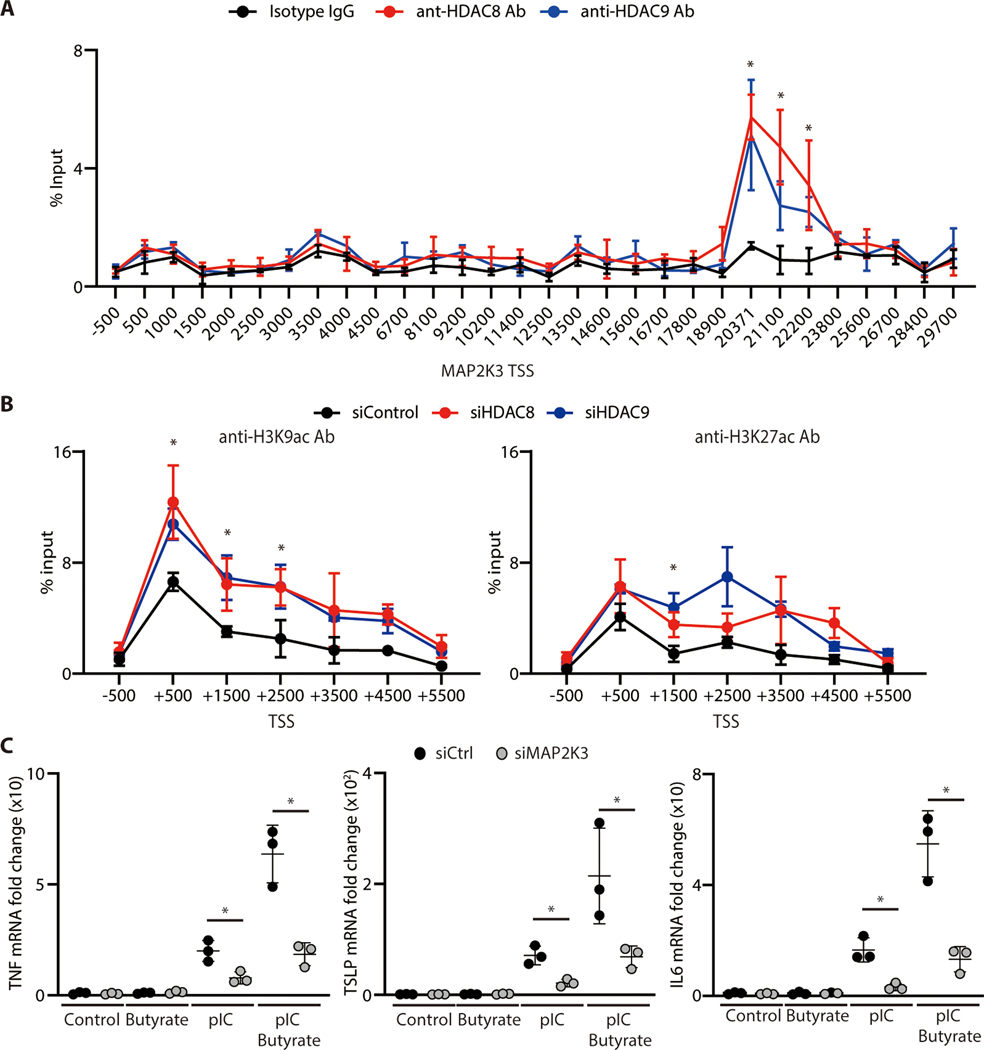
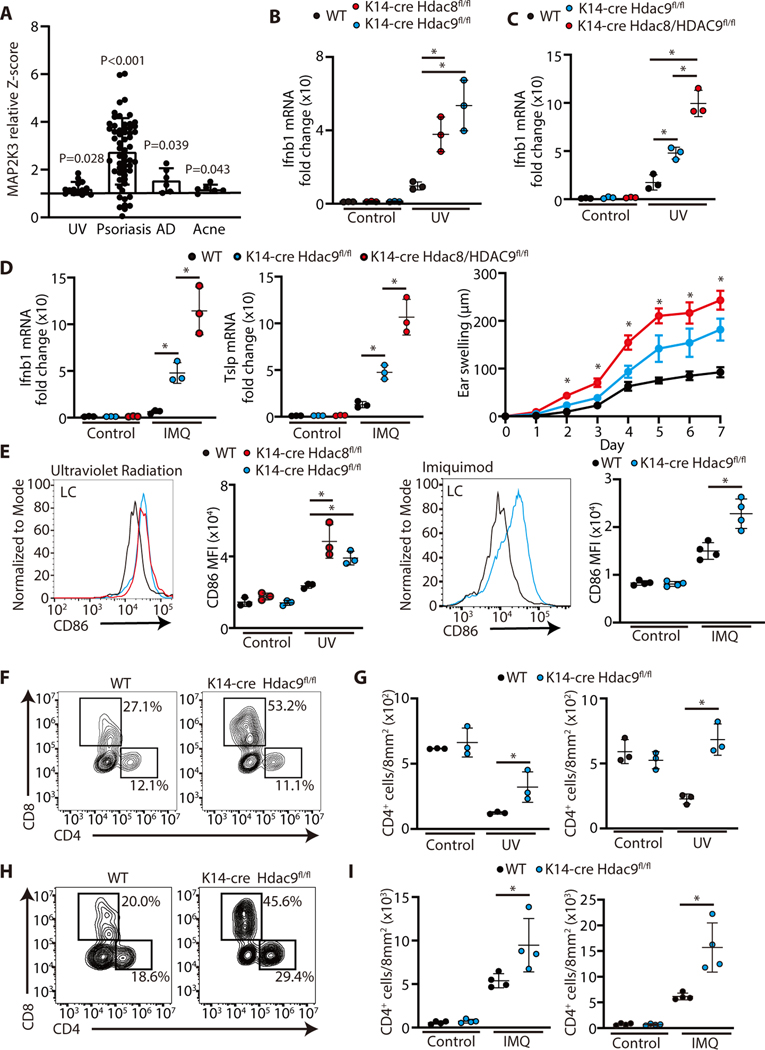
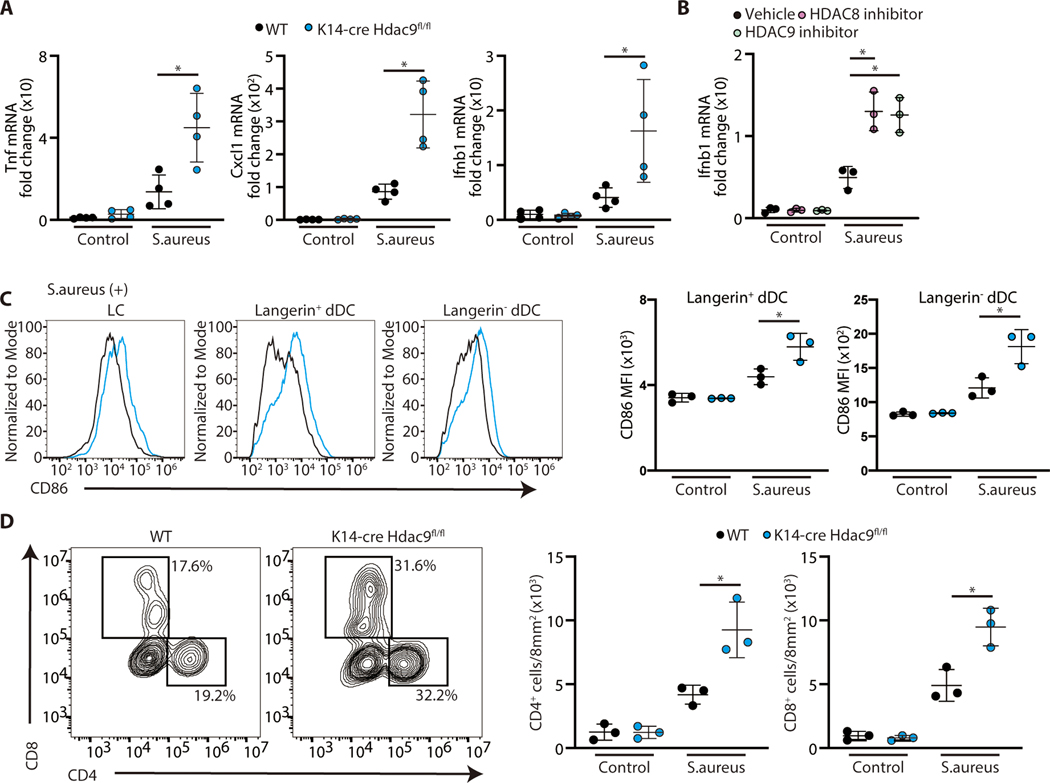
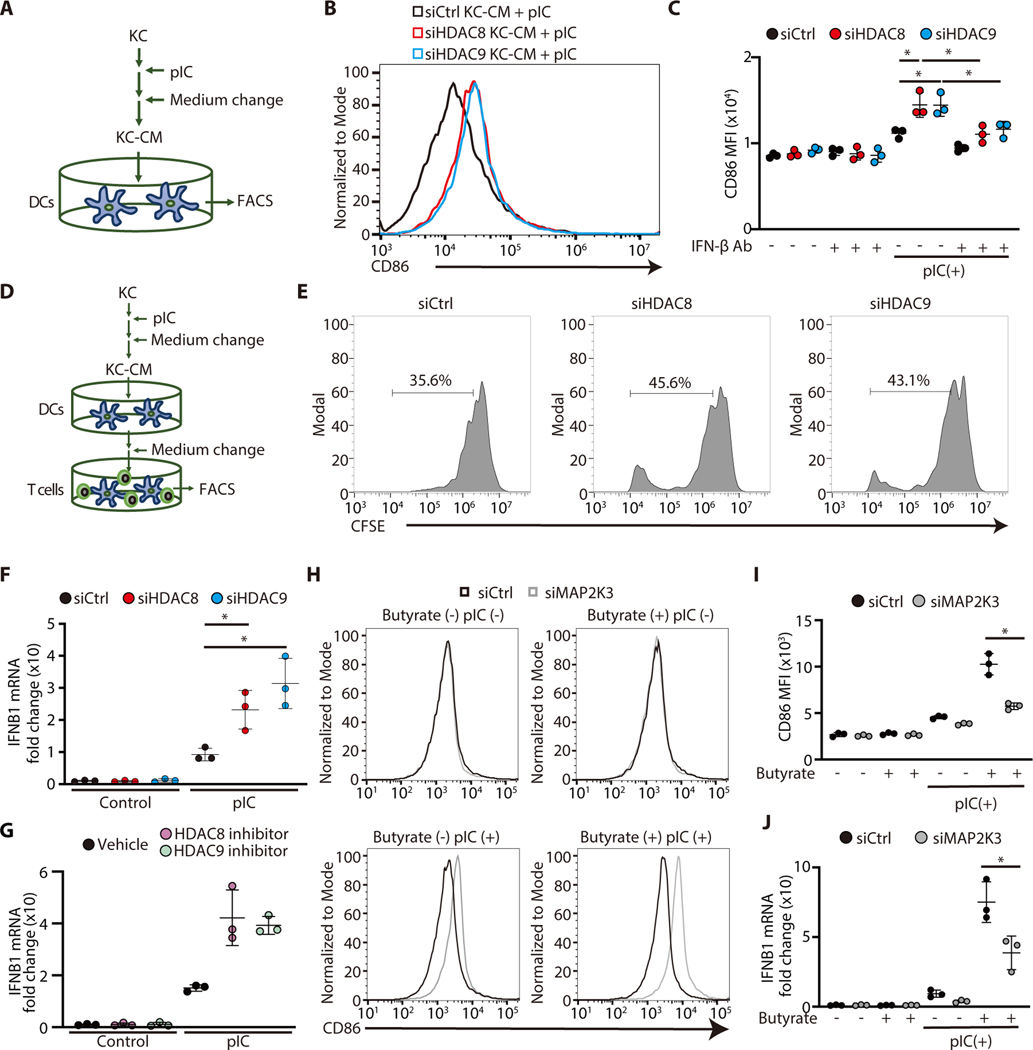
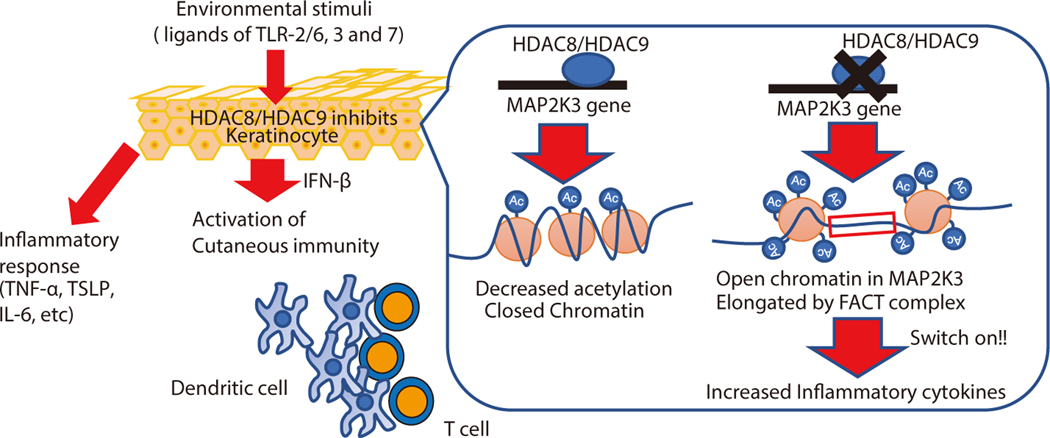
The skin typically tolerates exposure to various microbes and chemicals in the environment. Here, we investigated how the epidermis maintains this innate immune tolerance to stimuli that are recognized by Toll-like receptors (TLRs). Loss of tolerance to TLR ligands occurred after silencing of the histone deacetylases (HDACs) HDAC8 and HDAC9 in keratinocytes. Transcriptional analysis identified MAP2K3 as suppressed by HDAC8/9 activity and a potential key intermediary for establishing this tolerance. HDAC8/9 influenced acetylation at H3K9 and H3K27 marks in the MAP2K3 promoter. Proteomic analysis further identified SSRP1 and SUPT16H as associated with HDAC8/9 and responsible for transcriptional elongation of MAP2K3. Silencing of MAP2K3 blocked the capacity of HDAC8/9 to influence cytokine responses. Relevance in vivo was supported by observations of increased MAP2K3 in human inflammatory skin conditions and the capacity of keratinocyte HDAC8/9 to influence dendritic cell maturation and T cell proliferation. Keratinocyte-specific deletion of HDAC8/9 also increased inflammation in mice after exposure to ultraviolet radiation, imiquimod, or Staphylococcus aureus These findings define a mechanism for the epidermis to regulate inflammation in the presence of ubiquitous TLR ligands.


Conflict of interest statement

Competing Interests: RLG is a co-founder, scientific advisor, consultant and has equity in MatriSys Bioscience and is a consultant, receives income and has equity in Sente Inc. The other authors declare no competing interests.

Figures

Figure 1.
Figure 1.. HDAC8 and HDAC9 inhibit cytokine response to TLR 2, 3 and 7 ligands by suppression of MAP2K3 expression.
(A) Normal human keratinocytes (nHEKs) were pretreated for 1 hour with PCI34051 (10μM) or TMP269 (1μM) as HDAC8 or HDAC9 inhibitors respectively, and then cultured for 4 hours with poly I:C (1 μg/ml). mRNA expression of TSLP or CXCL10 was measured by qPCR. (N=3; one-way ANOVA). (B) nHEKs were treated for 24 hours with silencing RNAs to HDAC8 or HDAC9, or control scrambled siRNA, then cultured for 3 hours with MALP2 (200 ng/ml) or poly I:C (1 μg/ml) or 4 hours with IMQ (30 μg/ml). mRNA expression of TSLP or CXCL10 was measured by qPCR. (N=3; one-way ANOVA) (C) Total RNA sequencing after silencing of HDAC-8 or HDAC-9 and addition of poly I:C compared to control siRNA and poly I:C. (D) Gene ontology analysis of genes induced by poly I:C after HDAC 8,9 silencing with compared to genes induced by poly I:C after control siRNA. (E) Illustration of signaling pathways for TLR3, TLR2/6 and TLR7. (F) Heat map of TLR signaling-related genes that increased after HDAC8/9 silencing as determined by RNA sequencing and (G) validated by qPCR. (H) Immunoblotting for phospho-p38MAPK, p38MAPK, MAP2K3, or GAPDH from nHEKs treated with poly I:C following HDAC8/9 silencing. Results are expressed as the mean ± standard deviation (SD). *, P < 0.05. Data are representative of three independent experiments.
Figure 2.
Figure 2.. Transcription elongation complex is associated with HDAC 8/9 and is required for MAP2K3 gene expression following HDAC inhibition
(A) Proteins identified by mass spectrometry of nHEK extracts enriched by immunoprecipitation with anti-HDAC8 or HDAC9 compared with control IgG. (B) The common enriched nucleosome proteins precipitated by anti-HDAC8 and HDAC9. (C) Transcriptional elongation FACT proteins SSRP1 and SUPT16H that were identified in B were silenced in nHEKs and then HDAC activity chemically inhibited by butyrate treatment (2 mM) for 1 hour. nHEKs were subsequently cultured with or without poly I:C (1 μg/ml) for 4 hours and gene expression measured by qPCR. (N=3; one-way ANOVA) (D) MAP2K3 transcriptional elongation assay. The transcriptional elongation rate of MAP2K3 was measured after SSRP1 or SUPT16H silencing with or without butyrate treatment (2mM) for 1 hour. Data show relative abundance of pulse-labeled RNA for indicated genes at the indicated times after removal of transcriptional inhibitor 6-Dichlorobenzimidazole 1-β-d-ribofuranoside (DRB). (N=3; one-way ANOVA). The results are expressed as the mean ± standard deviation (SD). *, P < 0.05. Data are representative of three independent experiments.
Figure 3.
Figure 3.. HDAC8/HDAC9 associates with and acetylates MAP2K3 to influence cytokine expression by keratinocytes
(A) ChIP-qPCR for sites within the MAP2K3 gene relative to the transcriptional start site (TSS) following precipitation with anti-HDAC8 or anti-HDAC9. (N=3; one-way ANOVA) (B) ChIP-qPCR for MAP2K3 gene relative to the transcriptional start site (TSS) following precipitation with anti-H3K9ac or anti-H3K27ac. Data are shown in nHEKs after silencing of HDAC8, HDAC9 or control siRNA. (N=3; one-way ANOVA) (C) TNF-α, TSLP or IL-6 mRNA expression in nHEKs measured by qPCR 4 hours after poly I:C stimulation and following silencing of MAP2K3 or control siRNA with or without pretreatment with butyrate (2 mM) for 1 hour. (N=3; Student’s t-test). The results are expressed as the mean ± standard deviation (SD). *, P < 0.05. Data are representative of three independent experiments.
Figure 4.
Figure 4.. Increased inflammatory response to UV light and imiquimod in mice after targeted deletion of HDAC 8 or HDAC9
(A) MAP2K3 expression in human inflammatory skin disorders. Bar plots of Z scores (Y-axis) for skin taken from human healthy controls and lesional skin taken from patients with UV radiation, psoriasis, AD, and Acne Vulgaris were analyzed. Data were obtained from a public data set (GEO accession no. GDS2381, GSE13355, GDS968, and GDS2478). (Student’s t-test, two-sided). (B) Ifnb1 and Tslp gene expression in the skin of K14-Cre Hdac8 fl/fl and K14-Cre Hdac9 fl/fl mice or controls as measured by qPCR 24 hours after UVB exposure (200 mJ/cm2). (N=3; one-way ANOVA). (C) Ifnb1 gene expression in the skin of controls, K14-Cre Hdac9 fl/fl and double knockout K14-Cre Hdac8/9 fl/fl 24 hours after UV radiation. (N=3; one-way ANOVA). (D) Ifnb1 gene expression (N=3; one-way ANOVA) and ear swelling response after 7 days of topical imiquimod application to controls, K14-Cre Hdac9 fl/fl and double knockout K14-Cre Hdac8/9 fl/fl mice. (controls N=3, K14-Cre Hdac9 fl/fl mice N=3 and double knockout K14-Cre Hdac8/9 fl/fl mice N=4; one-way ANOVA). (E) Flow cytometry analysis of CD86 expression in LCs isolated from the skin 24 hours after UVB exposure or after 7 days of IMQ application. Representative flow cytometry plots are shown to the left and the mean fluorescence intensity of CD86 is shown to the right. (UV radiation experiment (N=3); one-way ANOVA, IMQ application experiment (N=4); Student’s t-test) (F,G) Flow cytometry analysis of cells gated from CD45+TCRβ1+ cells in the skin 24 hours after UVB exposure. Representative flow cytometry plots are shown as the number of CD4+ or CD8+ T-cells in the skin is shown to the right (N=3; Student’s t-test). (H,I) Flow cytometry analysis of CD45+TCRβ1+ cells in the skin 24 hours after the final IMQ application on day 7. Representative flow cytometry plots are shown in (H), and the number of CD4+ or CD8+ cells in the skin is shown in (I) (N=4; Student’s t-test).The results are expressed as the mean ± standard deviation (SD). Each dot represents an individual mouse. *, P < 0.05. Data are representative of three independent experiments.
Figure 5.
Figure 5.. Increased inflammatory response to S. aureus after targeted deletion of HDAC 8 or HDAC9
(A) Inflammatory gene expression in skin measured by qPCR 24 hours after topical S. aureus application (N=3; Student’s t-test). (B) IFN-β gene expression in PCI34051 or TMP269 -treated skin by qPCR 24 hours after topical S. aureus application (N=3; one-way ANOVA). (C) Flow cytometry analysis of CD86 expression in skin 24 hours after topical S. aureus application. Representative flow cytometry plots are shown in (C, left), and the mean fluorescence intensity of CD86 is shown in (C, right) (N=3; Student’s t-test). (D) Flow cytometry analysis of CD45+TCRβ1+ cells in the skin 24 hours after topical S. aureus application. Representative flow cytometry plots are shown in (D, left), and the number of CD4+ or CD8+ cells in the skin is shown in (D, right) (N=3; Student’s t-test). The results are expressed as the mean ± standard deviation (SD). Each dot represents an individual mouse. *, P < 0.05. Data are representative of three independent experiments.
Figure 6.
Figure 6.. HDAC8/HDAC9 inhibits DCs activation by keratinocyte IFN-β
(A) Schematic showing experimental approach; nHEKs (KC) were activated by poly I:C, then KC-conditioned media (KC-CM) was transferred to human monocyte-derived DCs for analysis by FACS. (B) Representative FACS histogram of CD86 expression in human monocyte-derived DCs 24 hours after stimulation with KC-CM from HDAC8 or HDAC9 silenced nHEKs. (C) Mean fluorescence intensity from experiments shown in B (N=3; one-way ANOVA). (D) Schematic showing experimental approach: as in A with transfer of DC to CD3+ cells for T cell proliferation assay. (E) The proliferation of CFSE-labeled CD3+ cells as analyzed by flow cytometry. (F, G) IFNB1 gene expression in nHEKs measured by qPCR after silencing of HDAC8/9 in (F) or treatment with PCI34051 (10μM) or TMP269 (1μM) in (G), followed by culture with or without poly I:C (1 μg/ml) (N=3; one-way ANOVA). (H, I) Flow cytometry analysis of CD86+ human monocyte-derived DCs stimulated with CM from nHEK after silencing of MAP2K3. nHEK CM was cocultured with peripheral blood CD3+ cells for 5 days. Representative flow cytometry histogram is shown in (H), and the mean fluorescence intensity is shown in (I) (N=3; Student’s t-test). (J) IFNB1 mRNA expression in nHEK measured by qPCR following MAP2K3 silencing and treatment with Poly I:C for 4 hours and after butyrate treatment (2mM) (N=3; Student’s t-test). The results are expressed as the mean ± standard deviation (SD). *, P < 0.05. Data are representative of three independent experiments.
Figure 7.
Figure 7.. Model for how HDAC8 and 9 maintain immune tolerance in the skin.
HDAC8 and HDAC9 are expressed in keratinocytes and decrease cytokine expression in response to commonly encountered inflammatory stimuli. When these HDACs are inhibited, keratinocytes mount a greater inflammatory response to stimulation by TLR ligands. This response includes release of IFN-β that enables a DC maturation and subsequent T cell proliferation. HDAC8 and HDAC9 act to decrease acetylation of the MAP2K3 gene. Inhibition of HDAC8 and HDAC9 leads to increased acetylation, activation of the FACT complex and subsequent enhanced transcription of MAP2K3. This primes keratinocytes to increase cytokine expression in response to TLR stimuli.

References

    1. Dainichi T. et al., The epithelial immune microenvironment (EIME) in atopic dermatitis and psoriasis. Nat Immunol 19, 1286–1298 (2018). - PubMed
    1. Genuis SJ, Sensitivity-related illness: the escalating pandemic of allergy, food intolerance and chemical sensitivity. Sci Total Environ 408, 6047–6061 (2010). - PubMed
    1. Alferink J. et al., Control of neonatal tolerance to tissue antigens by peripheral T cell trafficking. Science 282, 1338–1341 (1998). - PubMed
    1. Zhang X, Zhivaki D, Lo-Man R, Unique aspects of the perinatal immune system. Nat Rev Immunol 17, 495–507 (2017). - PubMed
    1. Chen YE, Fischbach MA, Belkaid Y, Skin microbiota-host interactions. Nature 553, 427–436 (2018). - PMC - PubMed

Publication types

MeSH terms