. 2021 May 21;6(59):eabe5084.
doi: 10.1126/sciimmunol.abe5084.

IL-6 effector function of group 2 innate lymphoid cells (ILC2) is NOD2 dependent

Affiliations

IL-6 effector function of group 2 innate lymphoid cells (ILC2) is NOD2 dependent

Clare S Hardman et al. Sci Immunol. .

Abstract

Cutaneous group 2 innate lymphoid cells (ILC2) are spatially and epigenetically poised to respond to barrier compromise and associated immunological threats. ILC2, lacking rearranged antigen-specific receptors, are primarily activated by damage-associated cytokines and respond with type 2 cytokine production. To investigate ILC2 potential for direct sensing of skin pathogens and allergens, we performed RNA sequencing of ILC2 derived from in vivo challenged human skin or blood. We detected expression of NOD2 and TLR2 by skin and blood ILC2. Stimulation of ILC2 with TLR2 agonist alone not only induced interleukin-5 (IL-5) and IL-13 expression but also elicited IL-6 expression in combination with Staphylococcus aureus muramyl dipeptide (MDP). Heat-killed skin-resident bacteria provoked an IL-6 profile in ILC2 in vitro that was notably impaired in ILC2 derived from patients with nucleotide-binding oligomerization domain-containing protein 2 (NOD2) mutations. In addition, we show that NOD2 signaling can stimulate autophagy in ILC2, which was also impaired in patients with NOD2 mutations. Here, we have identified a role for ILC2 NOD2 signaling in the differential regulation of ILC2-derived IL-6 and have reported a previously unrecognized pathway of direct ILC2 bacterial sensing.


Conflict of interest statement

Competing interests: G. Ogg has served on advisory boards or holds consultancies or equity with Eli Lilly, Novartis, Janssen, Orbit Discovery and UCB Pharma, and has undertaken clinical trials for Atopix, Regeneron/Sanofi, Roche, Anaptysbio. A. McKenzie has received grant support from Medimmune/AstraZeneca and GSK. The authors declare no further competing financial interests.

Figures

Figure 1
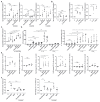
Figure 1. Human ILC2 express pattern recognition receptor NOD2.
A. PRR and B. NOD2 binding partner gene expression of skin blister and blood-derived ILC2 and T cells, as indicated, determined by RNA-Seq and measured in Reads Per Kilobase of transcript per Million mapped reads (RPKM) following 24 hour in vivo HDM blister challenge on the arm of a HDM-sensitive healthy index participant (n=1). C. RT-PCR analysis of NOD2 gene expression by ILC2 or T cells following stimulation with IL-33 (50ng/ml) and/or PGD2 (100nM), or PMA (15ng/ml) and ionomycin (7.5ng/ml) (PI) (n=4-7, one-way ANOVA with Tukey’s, data representative of 3 independent experiments). Gene expression normalized to GAPDH. D. NOD2 protein expression in human blood ILC2 measured by flow cytometry. Pale grey fill: FMO isotype control. Darker grey fill: blood-derived ILC2 donor NOD2 expression (n=4). E. Summary of ILC2 NOD2 expression by human PBMC and skin biopsy samples, analyzed by flow cytometry (n=4-8, data representative of at least 4 independent experiments). F. Summary of NOD2 expression by ILC2 derived from human skin localized within the epidermis and dermis, analyzed by flow cytometry (n=7, data representative of 4 independent experiments). G. Flow cytometry analysis of NOD2 protein expression intensity by ILC2 following stimulation with IL-33 (50ng/ml) and/or PGD2 (100nM) as measured by MFI (n=4, t-test, data representative of 3 independent experiments). *, P < 0.05; **, P < 0.01; ****, P < 0.0001.
Figure 2
Figure 2. ILC2 are capable of functional NOD2 signaling.
A. MDP transporter gene expression of skin blister and blood derived ILC2 and T cells determined by RNA-Seq and measured in RPKM following 24 hour in vivo HDM blister challenge of a HDM-sensitive healthy index participant (n=1). B. MDP-rhodamine (MDP-Rho, 5μg/ml, or Rhodamine B control) uptake measured following 3 hour coculture with ILC2, with/without prior stimulation (1 hour) with Pam3CSK4 (10μg/ml) or IL-33 (50ng/ml) measured by flow cytometry (n=9, paired one-way ANOVA with Dunnett’s, data representative of 3 independent experiments) or C. confocal microscopy (data quantified for n=2 donors, 2 images (5x5 tiles) per donor, one-way ANOVA with Dunnett’s). D. RT-PCR analysis of cytokine gene expression by ILC2 following 6 hour stimulation with panel of PRR agonists. Gene expression normalized to GAPDH (n=6, one-way ANOVA with Dunnett’s multiple comparison test, data representative of at least 4 independent experiments). *, P < 0.05; **, P < 0.01; ***, P < 0.001; ****, P < 0.0001.
Figure 3
Figure 3. ILC2 NOD2 signaling induces an IL-6 effector cytokine bias.
A. The effect of NOD2 signaling inhibition by ponatinib (25nM, 1 hour) on 6 hour stimulation with MDP (1 μg/ml) and/or Pam3CSK4 (10μg/ml) on ILC2 cytokine gene expression, measured by real-time PCR analysis. Gene expression normalized to GAPDH. (n=8, one-way ANOVA with Tukey’s multiple comparison test, data representative of at least 4 independent experiments). B. Real-time PCR analysis of cytokine gene expression by ILC2 following 6 hour stimulation with IL-33 (50ng/ml) and PGD2 (100nM). Gene expression normalized to GAPDH. (n=3-7, one-way ANOVA with Dunnett’s multiple comparison test, data representative of at least 4 independent experiments). C-D. Induction of ILC2 cytokine expression measured by (C.) real-time PCR following 6 hour stimulation or D. ELISA following 5 day stimulation with MDP (1μg/ml), Pam3CSK4 (10μg/ml), and/or IL-33 (50ng/ml) and PGD2 (100nM). (n=4 or 10 respectively, one-way ANOVA with Tukey’s multiple comparison test, data representative of at least 4 independent experiments). E. ILC2 cytokine protein production assessed ex vivo by intracellular flow cytometry after 24 hour stimulation of PBMC (left) and skin biopsy-derived mononuclear cells (right) with MDP (1μg/ml), Pam3CSK4 (10μg/ml), IL-33 (50ng/ml) or PGD2 (100nM). (n=5-7, one-way ANOVA with Dunnett’s multiple comparison test, data representative of at least 4 independent experiments). F. The effect of NOD2 signaling inhibition by ponatinib (25nM, 1 hour) on 24 hour stimulation with MDP (1μg/ml) and/or Pam3CSK4 (10μg/ml) on ILC2 cytokine gene expression measured by intracellular flow cytometry. Expressed as fold changed. (n=5-6, one-way ANOVA with Sidak’s multiple comparison test, data representative of at least 4 independent experiments). *, P < 0.05; **, P < 0.01; ***, P < 0.001; ****, P < 0.0001.
Figure 4
Figure 4. ILC2 sense bacterial components directly via NOD2.
A. The effect of NOD2 signaling inhibition by ponatinib (25nM, 1 hour) on 6 hour stimulation with heat-killed preparations of SA (S. aureus 108cells/ml), SE (S. epidermidis 108cells/ml) or PA (P. aeruginosa 108cells/ml) on ILC2 cytokine gene expression measured by real-time PCR analysis. Gene expression normalized to GAPDH. (n=5-7, one-way ANOVA with Tukey’s multiple comparison test, data representative of at least 4 independent experiments). B-C. Summary of ILC2 cytokine protein production assessed ex vivo by intracellular flow cytometry after 24 hour stimulation of PBMC (B.) and skin biopsy-derived mononuclear cells (C.) with heat-killed preparations of SA, SE or PA (n=5-7, one-way ANOVA with Dunnett’s multiple comparison test, data representative of at least 4 independent experiments). D. The effect of ponatinib (25nM) 1 hour prior to 24 hour stimulation with heat-killed preparations of SA, SE or PA on ILC2 cytokine gene expression measured by intracellular flow cytometry. Expressed as fold change, (n=5-6, one-way ANOVA with Sidak’s multiple comparison test, data representative of at least 4 independent experiments). *, P < 0.05; **, P < 0.01; ***, P < 0.001; ****, P < 0.0001.
Figure 5
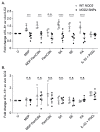
Figure 5. NOD2 mutation reduces ILC2 capacity to produce IL-6.
Induction of ILC2-derived IL-6 (A.) and IL-13 (B.) following 24 hour stimulation with MDP (1μg/ml), Pam3CSK4 (10μg/ml), IL-33 (50ng/ml) or PGD2 (100nM), heat-killed preparations of SA (S. aureus), SE (S. epidermidis) or PA (P. aeruginosa) measured by intracellular flow cytometry in PBMC from healthy volunteers with wild-type NOD2 gene expression (WT NOD2) or patients with loss of function NOD2 mutations (NOD2 SNPs). (n=4-8, one-way ANOVA with Sidak’s multiple comparison test, data representative of at least 6 independent experiments). ***, P < 0.001; ****, P < 0.0001.
Figure 6
Figure 6. Atopic dermatitis patient derived ILC2 exhibit enhanced NOD2 dependent IL-6 production.
A. Induction of ILC2-derived IL-6 (A.) and IL-13 (B.) following 24 hour stimulation with MDP (1μg/ml), Pam3CSK4 (10μg/ml), heat-killed preparations of SA (S. aureus), SE (S. epidermidis) or IL-33 (50ng/ml) and PGD2 (100nM), measured by intracellular flow cytometry in PBMC from healthy volunteers (HC) or patients with atopic dermatitis (AD). (n=4, one-way ANOVA with Sidak’s multiple comparison test, data representative of 3 independent experiments. C. Induction of ILC2-derived IL-6 following 24 hour stimulation with MDP (1μg/ml), Pam3CSK4 (10μg/ml), heat-killed preparations of SA, SE or IL-33 (50ng/ml) and PGD2 (100nM), measured by intracellular flow cytometry in ILC2 isolated and expanded from healthy volunteers (HC) or patients with atopic dermatitis (AD) (n=3-5, one-way ANOVA with Sidak’s multiple comparison test, data representative of 3 independent experiments). D. NOD2 protein expression following 24 hour stimulation with Pam3CSK4 (10μg/ml) or IL-33 (50ng/ml) and PGD2 (100nM), measured by intracellular flow cytometry in PBMC from healthy volunteers (HC) or patients with atopic dermatitis (AD). (n=7, one-way ANOVA with Tukey’s multiple comparison test, data representative of 3 independent experiments. *, P < 0.05; **, P < 0.01; ****, P < 0.0001.
Figure 7
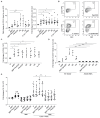
Figure 7. Bacterial stimulation of ILC2 induces autophagy via NOD2.
A. Summary of ILC2 autophagy assessed ex vivo by intracellular flow cytometry staining of LC3-II after 24 hour stimulation of PBMC and skin-biopsy derived mononuclear cells with heat-killed preparations of SA (S. aureus), SE (S. epidermidis) or PA (P. aeruginosa) and B. Representative flow cytometry plots of skin biopsy-derived ILC2. (n=5-9, one-way ANOVA with Dunnett’s multiple comparison test, data representative of at least 5 independent experiments). C. Summary of ILC2 autophagy assessed in purified human blood ILC2 by intracellular flow cytometry staining of LC3-II after 24 hour stimulation with MDP (1μg/ml), Pam3CSK4 (10μg/ml), IL-33 (50ng/ml) or PGD2 (100nM), heat-killed preparations of SA, SE or PA. (n=6, one-way ANOVA with Dunnett’s multiple comparison test, data representative of 3 independent experiments). D. Induction of ILC2-LC3-following 24 hour stimulation with MDP (1μg/ml), Pam3CSK4 (10μg/ml), heat-killed preparations of SA, SE or PA measured by intracellular flow cytometry in PBMC from healthy volunteers with wild-type NOD2 gene expression (WT NOD2) or patients with loss of function NOD2 mutations (NOD2 SNPs) (n=3-6, one-way ANOVA with Sidak’s multiple comparison test, data representative of 3 independent experiments). E. The effect of autophagy inhibition by 3-methyladenine (5mM, 1 hour) on 6 hour stimulation with MDP (1μg/ml), Pam3CSK4 (10μg/ml), IL-33 (50ng/ml) or PGD2 (100nM) on ILC2 IL-13 induction measured by flow cytometry. (n=8 donors, one-way ANOVA with Tukey’s multiple comparison test, data representative of 4 independent experiments). *, P < 0.05; **, P < 0.01; ***, P < 0.001; ****, P < 0.0001.

References

    1. Cherrier DE, Serafini N, Di Santo JP. Innate Lymphoid Cell Development: A T Cell Perspective. Immunity. 2018;48:1091–1103. - PubMed
    1. Barlow JL, McKenzie AN. Type-2 innate lymphoid cells in human allergic disease. Curr Opin Allergy Clin Immunol. 2014;14:397–403. - PMC - PubMed
    1. Kim BS. Innate lymphoid cells in the skin. J Invest Dermatol. 2015;135:673–678. - PMC - PubMed
    1. Mjosberg JM, Trifari S, Crellin NK, Peters CP, van Drunen CM, Piet B, Fokkens WJ, Cupedo T, Spits H. Human IL-25- and IL-33-responsive type 2 innate lymphoid cells are defined by expression of CRTH2 and CD161. Nat Immunol. 2011;12:1055–1062. - PubMed
    1. Xue L, Salimi M, Panse I, Mjosberg JM, McKenzie AN, Spits H, Klenerman P, Ogg G. Prostaglandin D2 activates group 2 innate lymphoid cells through chemoattractant receptor-homologous molecule expressed on TH2 cells. J Allergy Clin Immunol. 2014;133:1184–1194. - PMC - PubMed

Publication types