

Pathways of immune exclusion in metastatic osteosarcoma are associated with inferior patient outcomes
- PMID: 34021032
- PMCID: PMC8144029
- DOI: 10.1136/jitc-2020-001772
Pathways of immune exclusion in metastatic osteosarcoma are associated with inferior patient outcomes
Abstract
Background: Current therapy for osteosarcoma pulmonary metastases (PMs) is ineffective. The mechanisms that prevent successful immunotherapy in osteosarcoma are incompletely understood. We investigated the tumor microenvironment of metastatic osteosarcoma with the goal of harnessing the immune system as a therapeutic strategy.
Methods: 66 osteosarcoma tissue specimens were analyzed by immunohistochemistry (IHC) and immune markers were digitally quantified. Tumor-infiltrating lymphocytes (TILs) from 25 specimens were profiled by functional cytometry. Comparative transcriptomic studies of distinct tumor-normal lung 'PM interface' and 'PM interior' regions from 16 PMs were performed. Clinical follow-up (median 24 months) was available from resection.
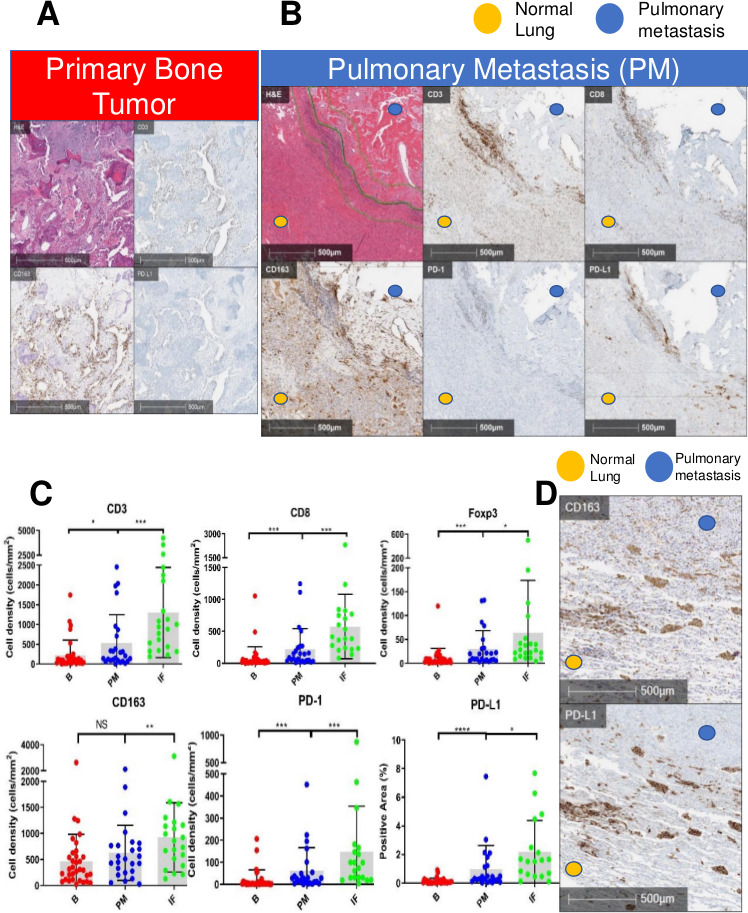
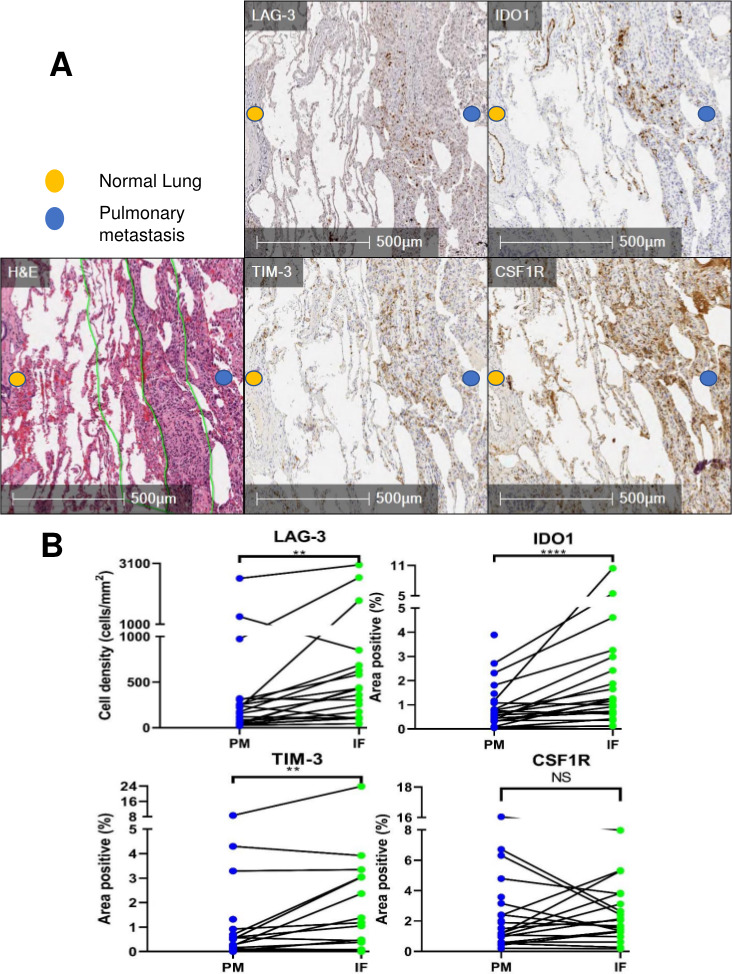
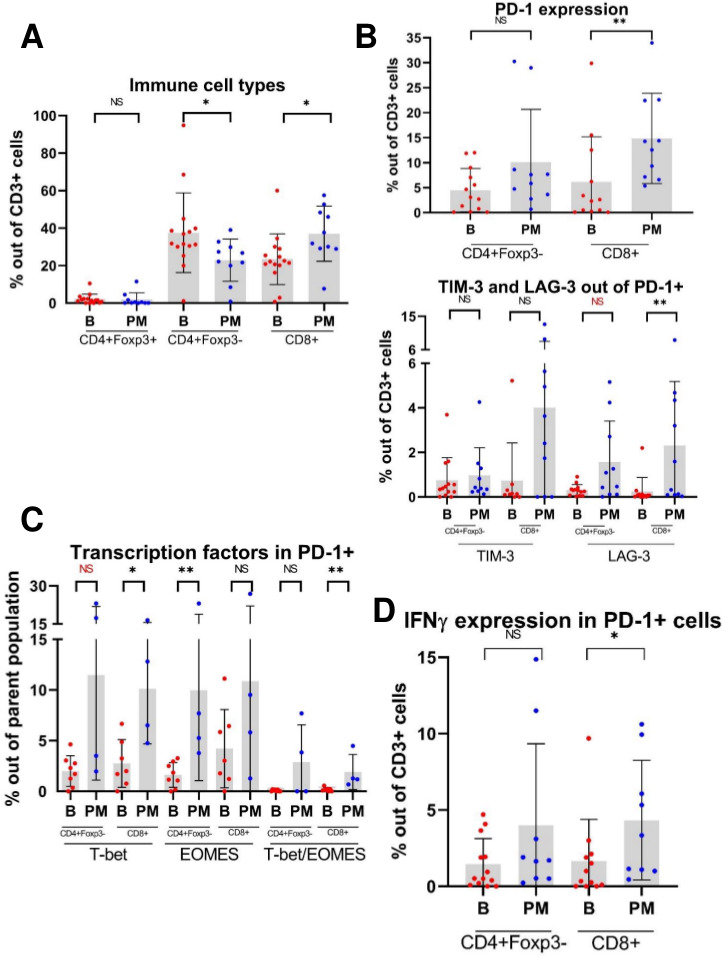
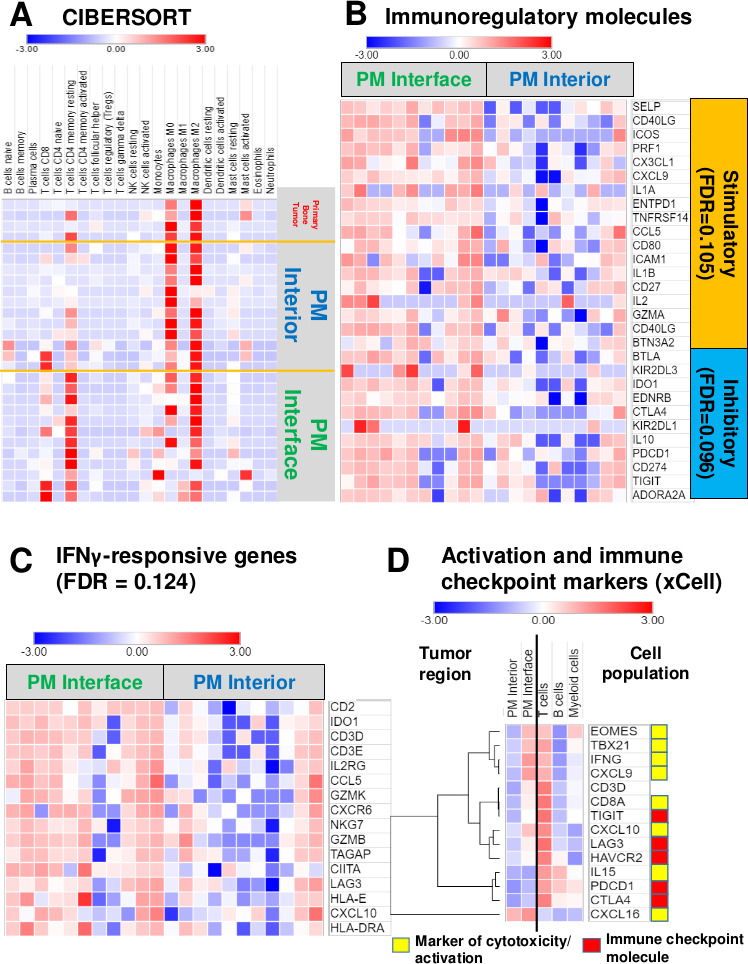
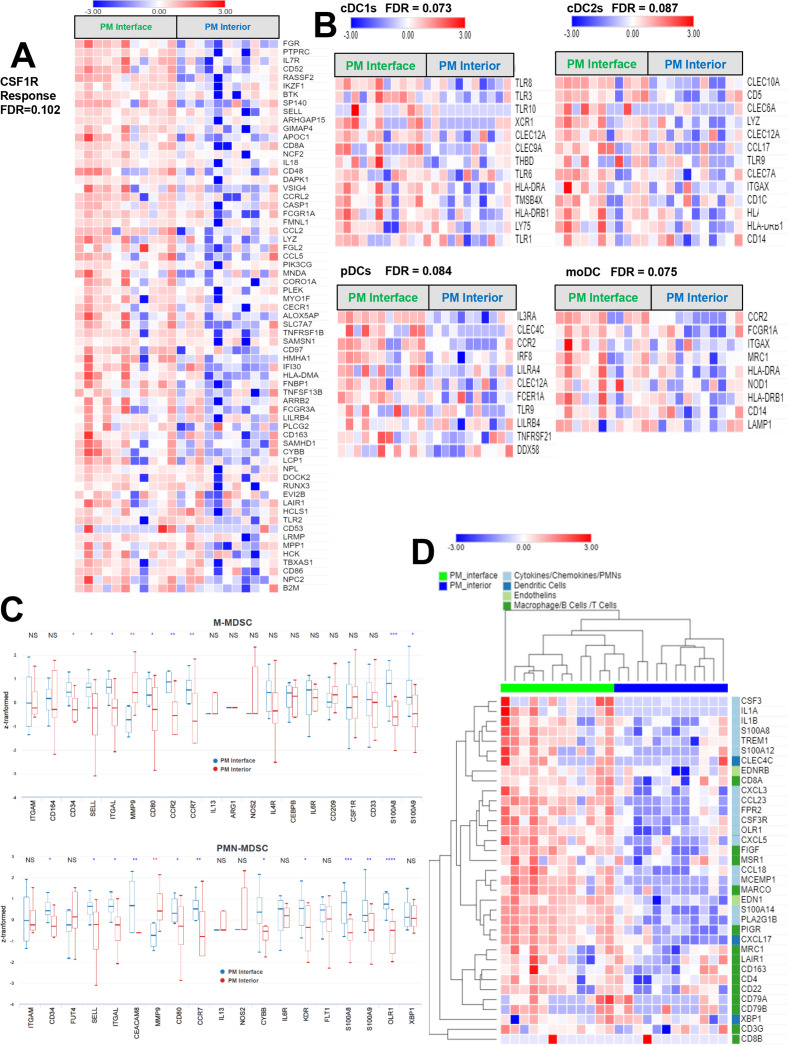
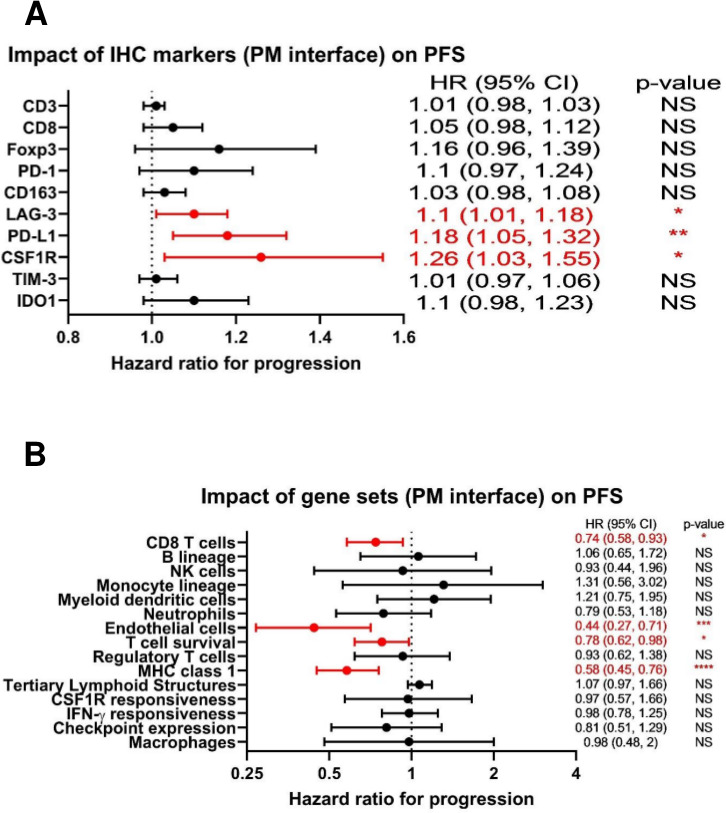
Results: IHC revealed a statistically significantly higher concentration of TILs expressing immune checkpoint and immunoregulatory molecules in PMs compared with primary bone tumors (including programmed cell death 1 (PD-1), programmed death ligand 1 (PD-L1), lymphocyte-activation gene 3 (LAG-3), T-cell immunoglobulin and mucin domain-containing protein 3 (TIM-3), and indoleamine 2,3-dioxygenase (IDO1). Remarkably, these lymphocytes are excluded at the PM interface compared with PM interior. TILs from PMs exhibited significantly higher amounts of PD-1 and LAG-3 and functional cytokines including interferon-γ (IFNγ) by flow cytometry. Gene expression profiling further confirmed the presence of CD8 and CD4 lymphocytes concentrated at the PM interface, along with upregulation of immunoregulatory molecules and IFNγ-driven genes in the same region. We further discovered a strong alternatively activated macrophage signature throughout the entire PMs along with a polymorphonuclear myeloid-derived suppressor cell signature focused at the PM interface. Expression of PD-L1, LAG-3, and colony-stimulating factor 1 receptor (CSF1R) at the PM interface was associated with significantly worse progression-free survival (PFS), while gene sets indicative of productive T cell immune responses (CD8 T cells, T cell survival, and major histocompatibility complex class 1 expression) were associated with significantly improved PFS.
Conclusions: Osteosarcoma PMs exhibit immune exclusion characterized by the accumulation of TILs at the PM interface. These TILs produce effector cytokines, suggesting their capability of activation and recognition of tumor antigens. Our findings suggest cooperative immunosuppressive mechanisms in osteosarcoma PMs including immune checkpoint molecule expression and the presence of immunosuppressive myeloid cells. We identify cellular and molecular signatures that are associated with patient outcomes, which could be exploited for successful immunotherapy.
Keywords: pediatrics; sarcoma; translational medical research; tumor microenvironment.
© Author(s) (or their employer(s)) 2021. Re-use permitted under CC BY-NC. No commercial re-use. See rights and permissions. Published by BMJ.
Conflict of interest statement
Competing interests: GC is an employee/paid consultant for Compugen LTD. DMC reports grant support from AstraZeneca and Rainier Pharmaceuticals. DMP reports grant support from Bristol Myers Squibb.
Figures
Similar articles
-
PD-L1 and IDO1 expression and tumor-infiltrating lymphocytes in osteosarcoma patients: comparative study of primary and metastatic lesions.J Cancer Res Clin Oncol. 2020 Oct;146(10):2607-2620. doi: 10.1007/s00432-020-03242-6. Epub 2020 May 9. J Cancer Res Clin Oncol. 2020. PMID: 32388585 Free PMC article.
-
CSF1/CSF1R Signaling Inhibitor Pexidartinib (PLX3397) Reprograms Tumor-Associated Macrophages and Stimulates T-cell Infiltration in the Sarcoma Microenvironment.Mol Cancer Ther. 2021 Aug;20(8):1388-1399. doi: 10.1158/1535-7163.MCT-20-0591. Epub 2021 Jun 4. Mol Cancer Ther. 2021. PMID: 34088832 Free PMC article.
-
Tumor DNA methylation profiles correlate with response to anti-PD-1 immune checkpoint inhibitor monotherapy in sarcoma patients.J Immunother Cancer. 2021 Mar;9(3):e001458. doi: 10.1136/jitc-2020-001458. J Immunother Cancer. 2021. PMID: 33762319 Free PMC article.
-
Progress in immune microenvironment, immunotherapy and prognostic biomarkers in pediatric osteosarcoma.Front Immunol. 2025 Jan 22;16:1548527. doi: 10.3389/fimmu.2025.1548527. eCollection 2025. Front Immunol. 2025. PMID: 39911380 Free PMC article. Review.
-
New insights into the mechanisms of the immune microenvironment and immunotherapy in osteosarcoma.Front Immunol. 2025 Jan 17;15:1539696. doi: 10.3389/fimmu.2024.1539696. eCollection 2024. Front Immunol. 2025. PMID: 39896817 Free PMC article. Review.
Cited by
-
A comprehensive clinico-pathological review of a series of pediatric, adolescents and young adults with high-grade osteosarcoma: from clinics to biomarker discovery.Clin Transl Oncol. 2025 Sep;27(9):3781-3792. doi: 10.1007/s12094-025-03901-5. Epub 2025 Apr 8. Clin Transl Oncol. 2025. PMID: 40198505
-
Advances in Osteosarcoma.Curr Osteoporos Rep. 2023 Aug;21(4):330-343. doi: 10.1007/s11914-023-00803-9. Epub 2023 Jun 17. Curr Osteoporos Rep. 2023. PMID: 37329384 Free PMC article. Review.
-
Digging Through the Complexities of Immunological Approaches in Emerging Osteosarcoma Therapeutics: A Comprehensive Narrative Review with Updated Clinical Trials.Biomedicines. 2025 Mar 8;13(3):664. doi: 10.3390/biomedicines13030664. Biomedicines. 2025. PMID: 40149640 Free PMC article. Review.
-
Targeting Regnase-1 unleashes CAR T cell antitumor activity for osteosarcoma and creates a proinflammatory tumor microenvironment.bioRxiv [Preprint]. 2025 May 23:2025.05.20.650777. doi: 10.1101/2025.05.20.650777. bioRxiv. 2025. PMID: 40475601 Free PMC article. Preprint.
-
Dissecting the effect of sphingolipid metabolism gene in progression and microenvironment of osteosarcoma to develop a prognostic signature.Front Endocrinol (Lausanne). 2022 Oct 14;13:1030655. doi: 10.3389/fendo.2022.1030655. eCollection 2022. Front Endocrinol (Lausanne). 2022. PMID: 36313783 Free PMC article.
References
-
- Lagmay JP, Krailo MD, Dang H, et al. . Outcome of patients with recurrent osteosarcoma enrolled in seven phase II trials through children's cancer group, pediatric Oncology group, and children's Oncology group: learning from the past to move forward. J Clin Oncol 2016;34:3031–8. 10.1200/JCO.2015.65.5381 - DOI - PMC - PubMed
Publication types
MeSH terms
Substances
LinkOut - more resources
Full Text Sources
Other Literature Sources
Medical
Research Materials
Miscellaneous