. 2022 May;71(5):991-1005.
doi: 10.1136/gutjnl-2020-323126. Epub 2021 May 21.

RNA helicase DDX5 enables STAT1 mRNA translation and interferon signalling in hepatitis B virus replicating hepatocytes

Affiliations

RNA helicase DDX5 enables STAT1 mRNA translation and interferon signalling in hepatitis B virus replicating hepatocytes

Jiazeng Sun et al. Gut. 2022 May.

Abstract

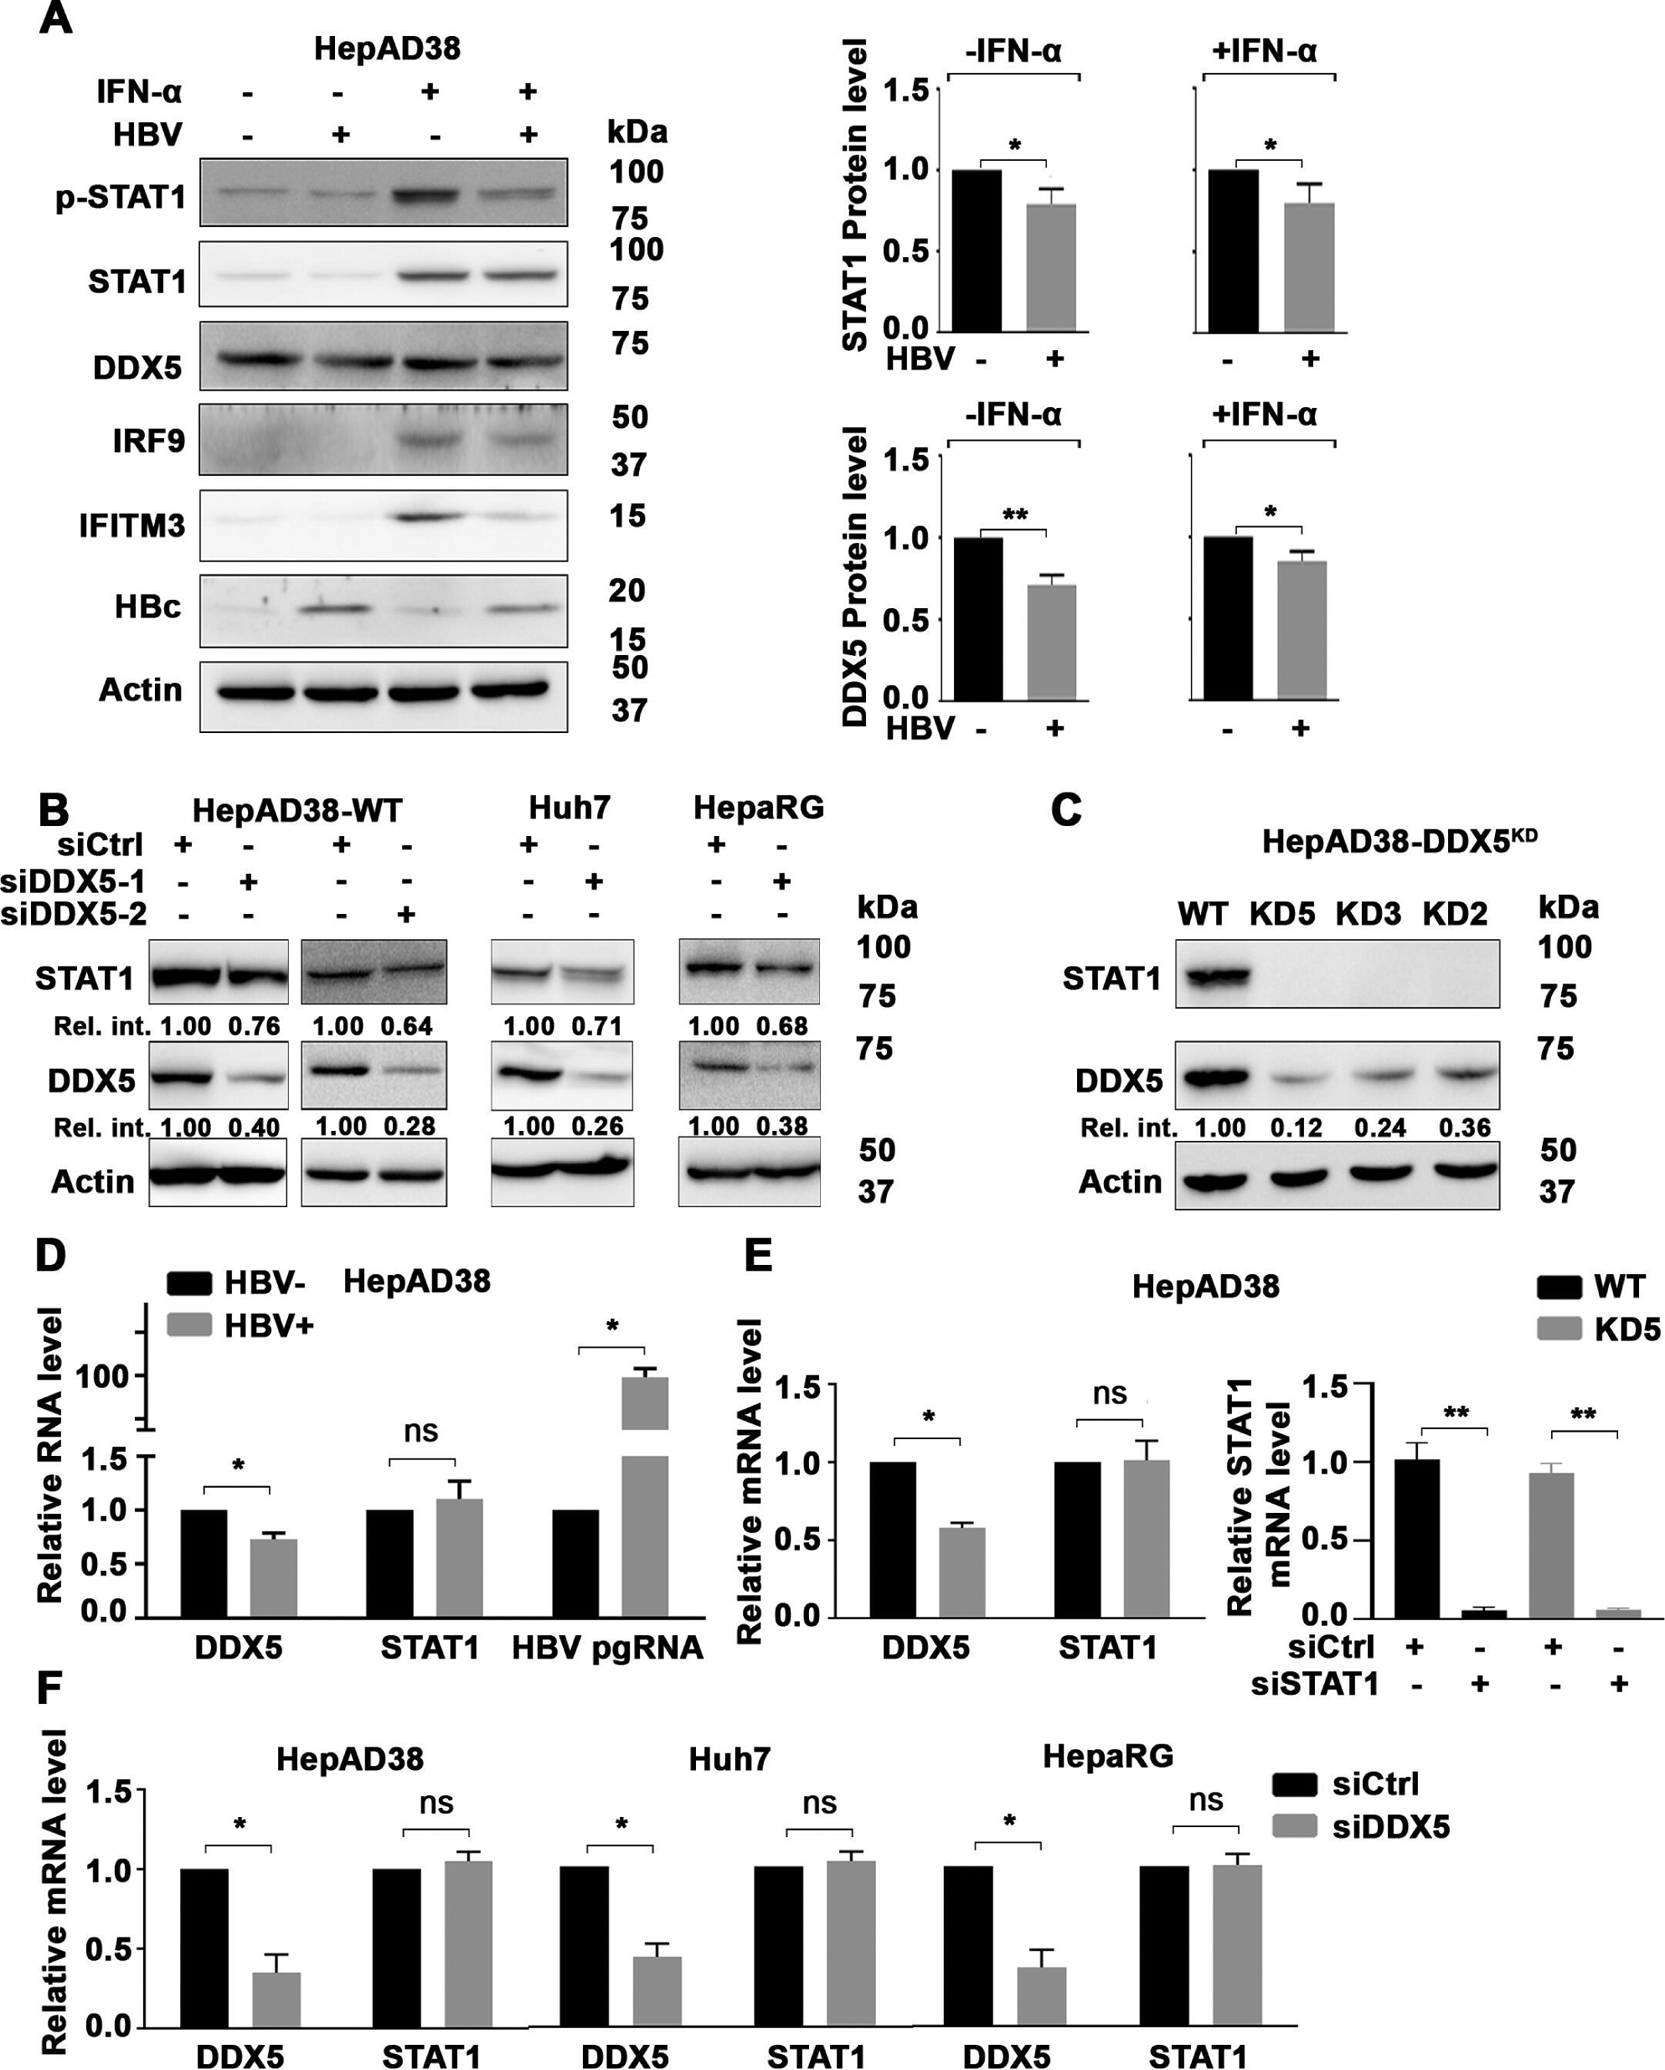
Objective: RNA helicase DDX5 is downregulated during HBV replication and poor prognosis HBV-related hepatocellular carcinoma (HCC). The objective of this study is to investigate the role of DDX5 in interferon (IFN) signalling. We provide evidence of a novel mechanism involving DDX5 that enables translation of transcription factor STAT1 mediating the IFN response.

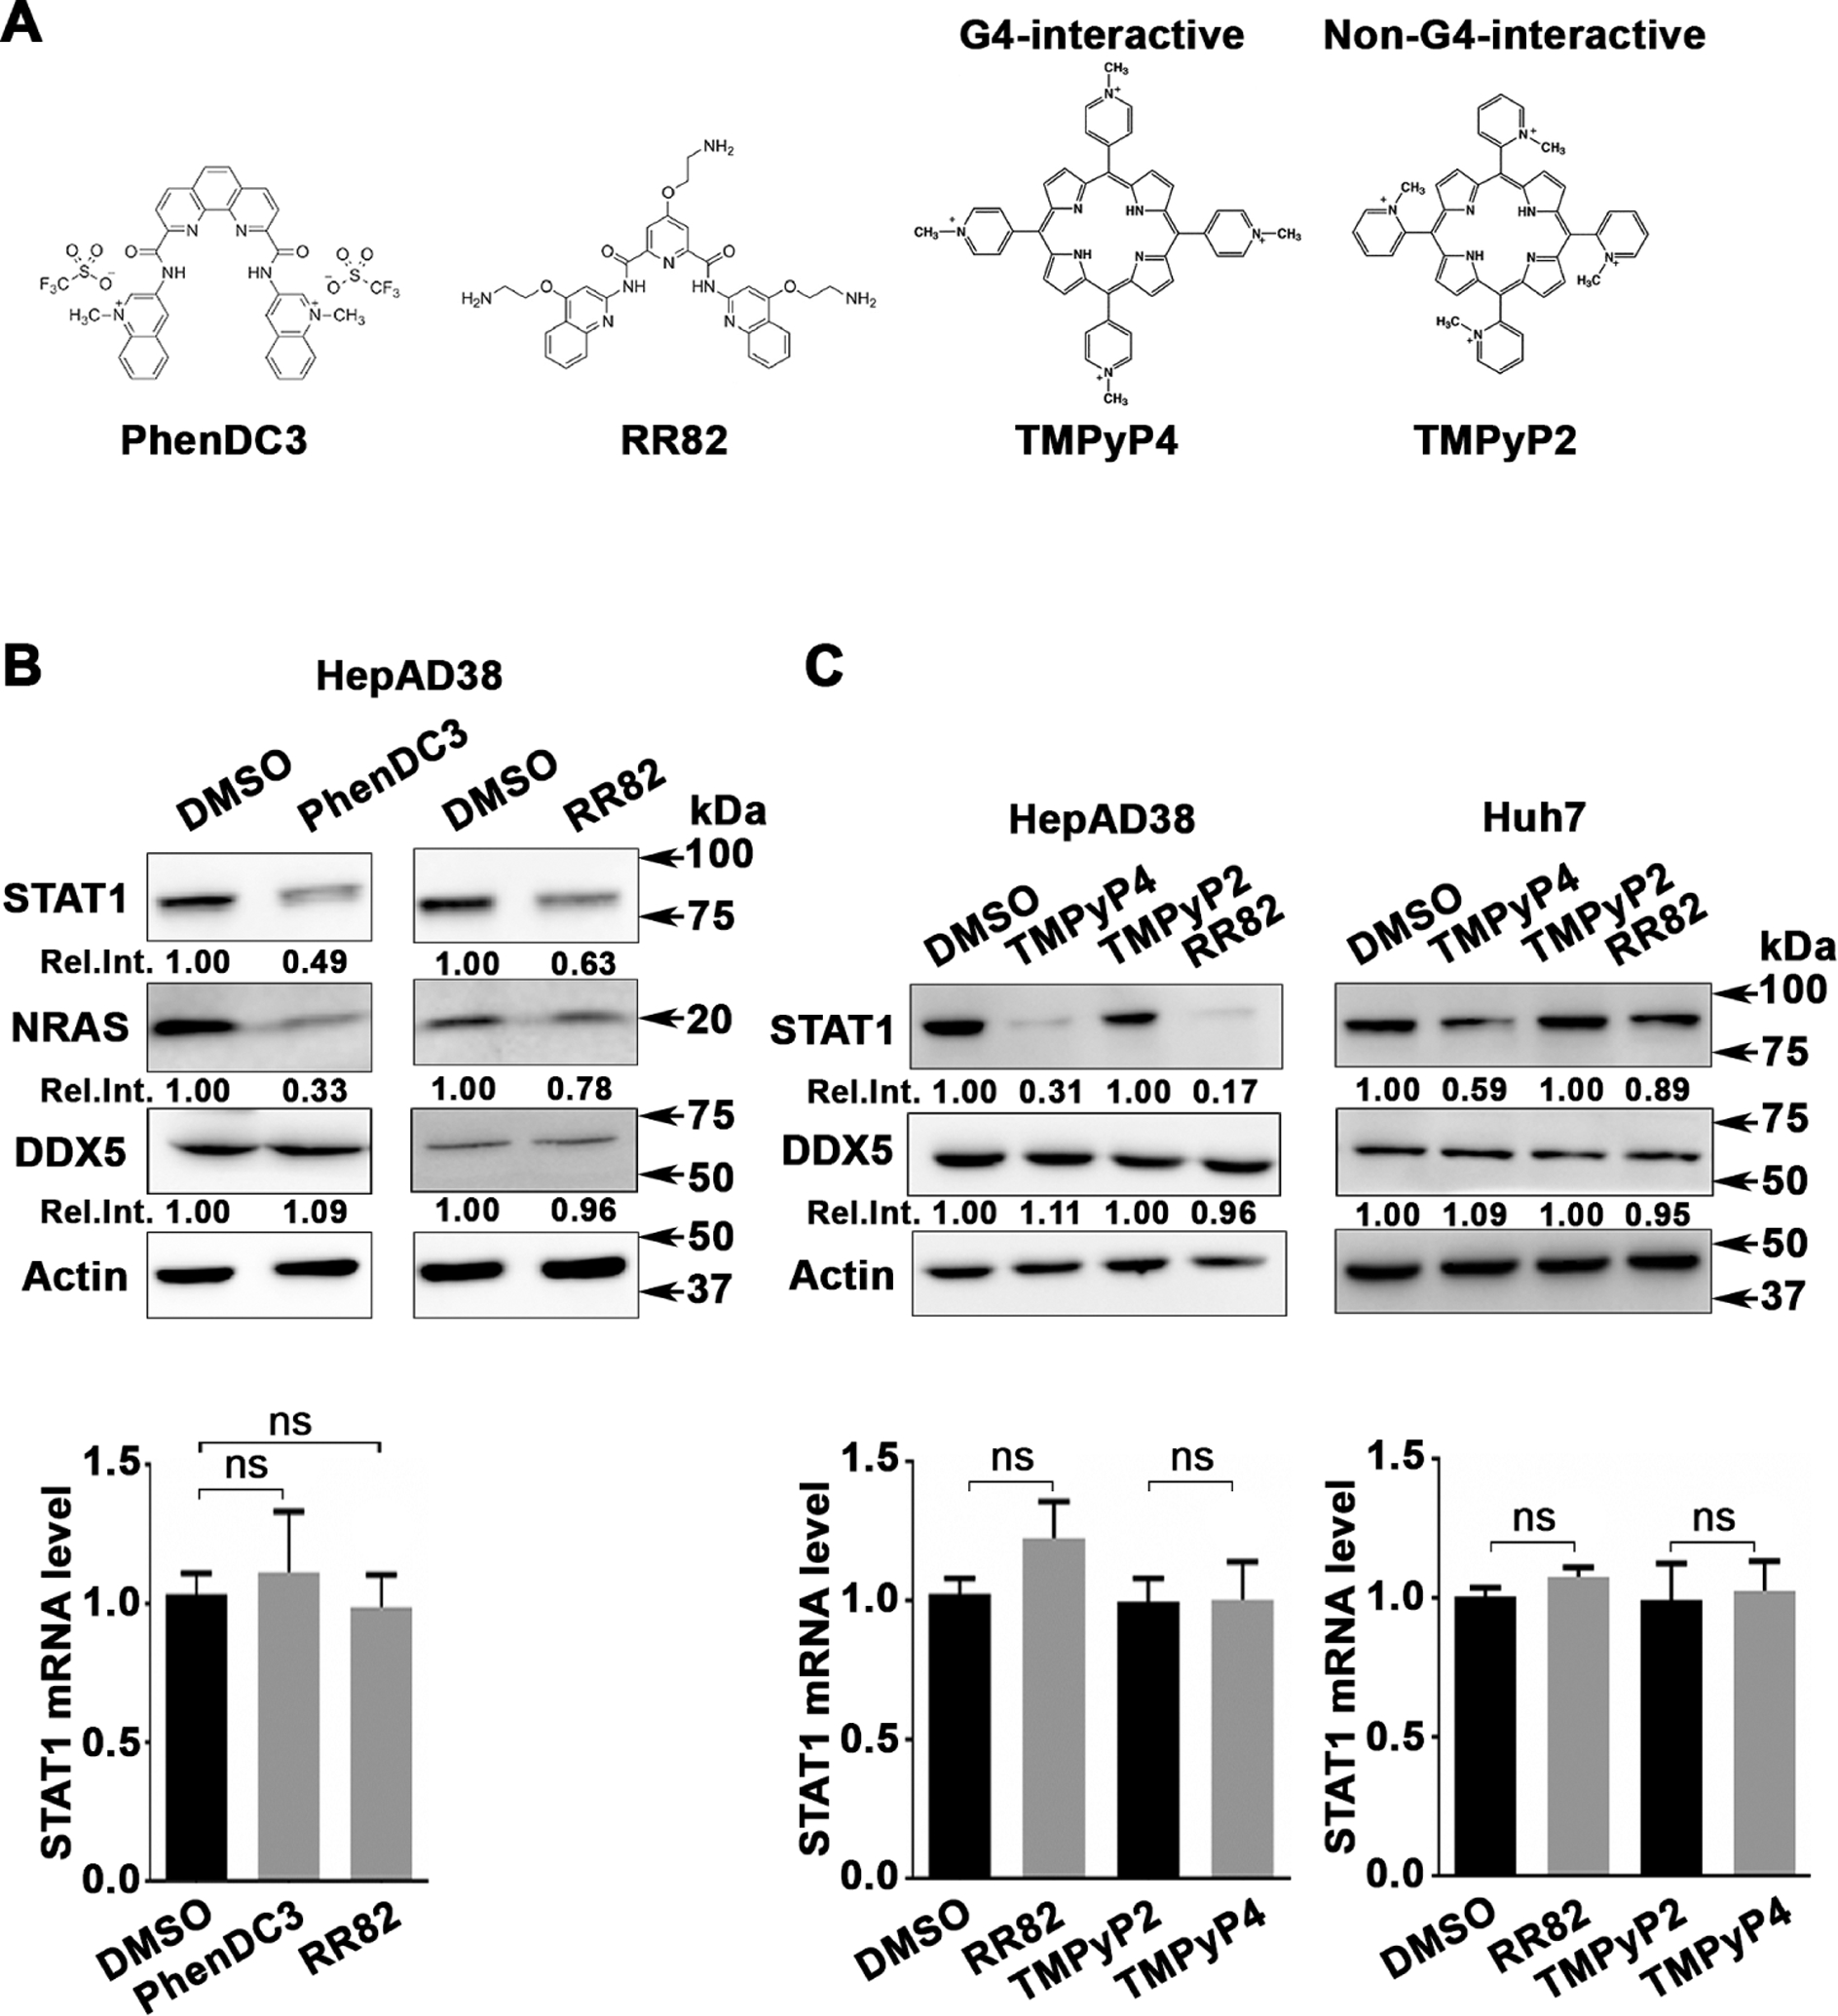
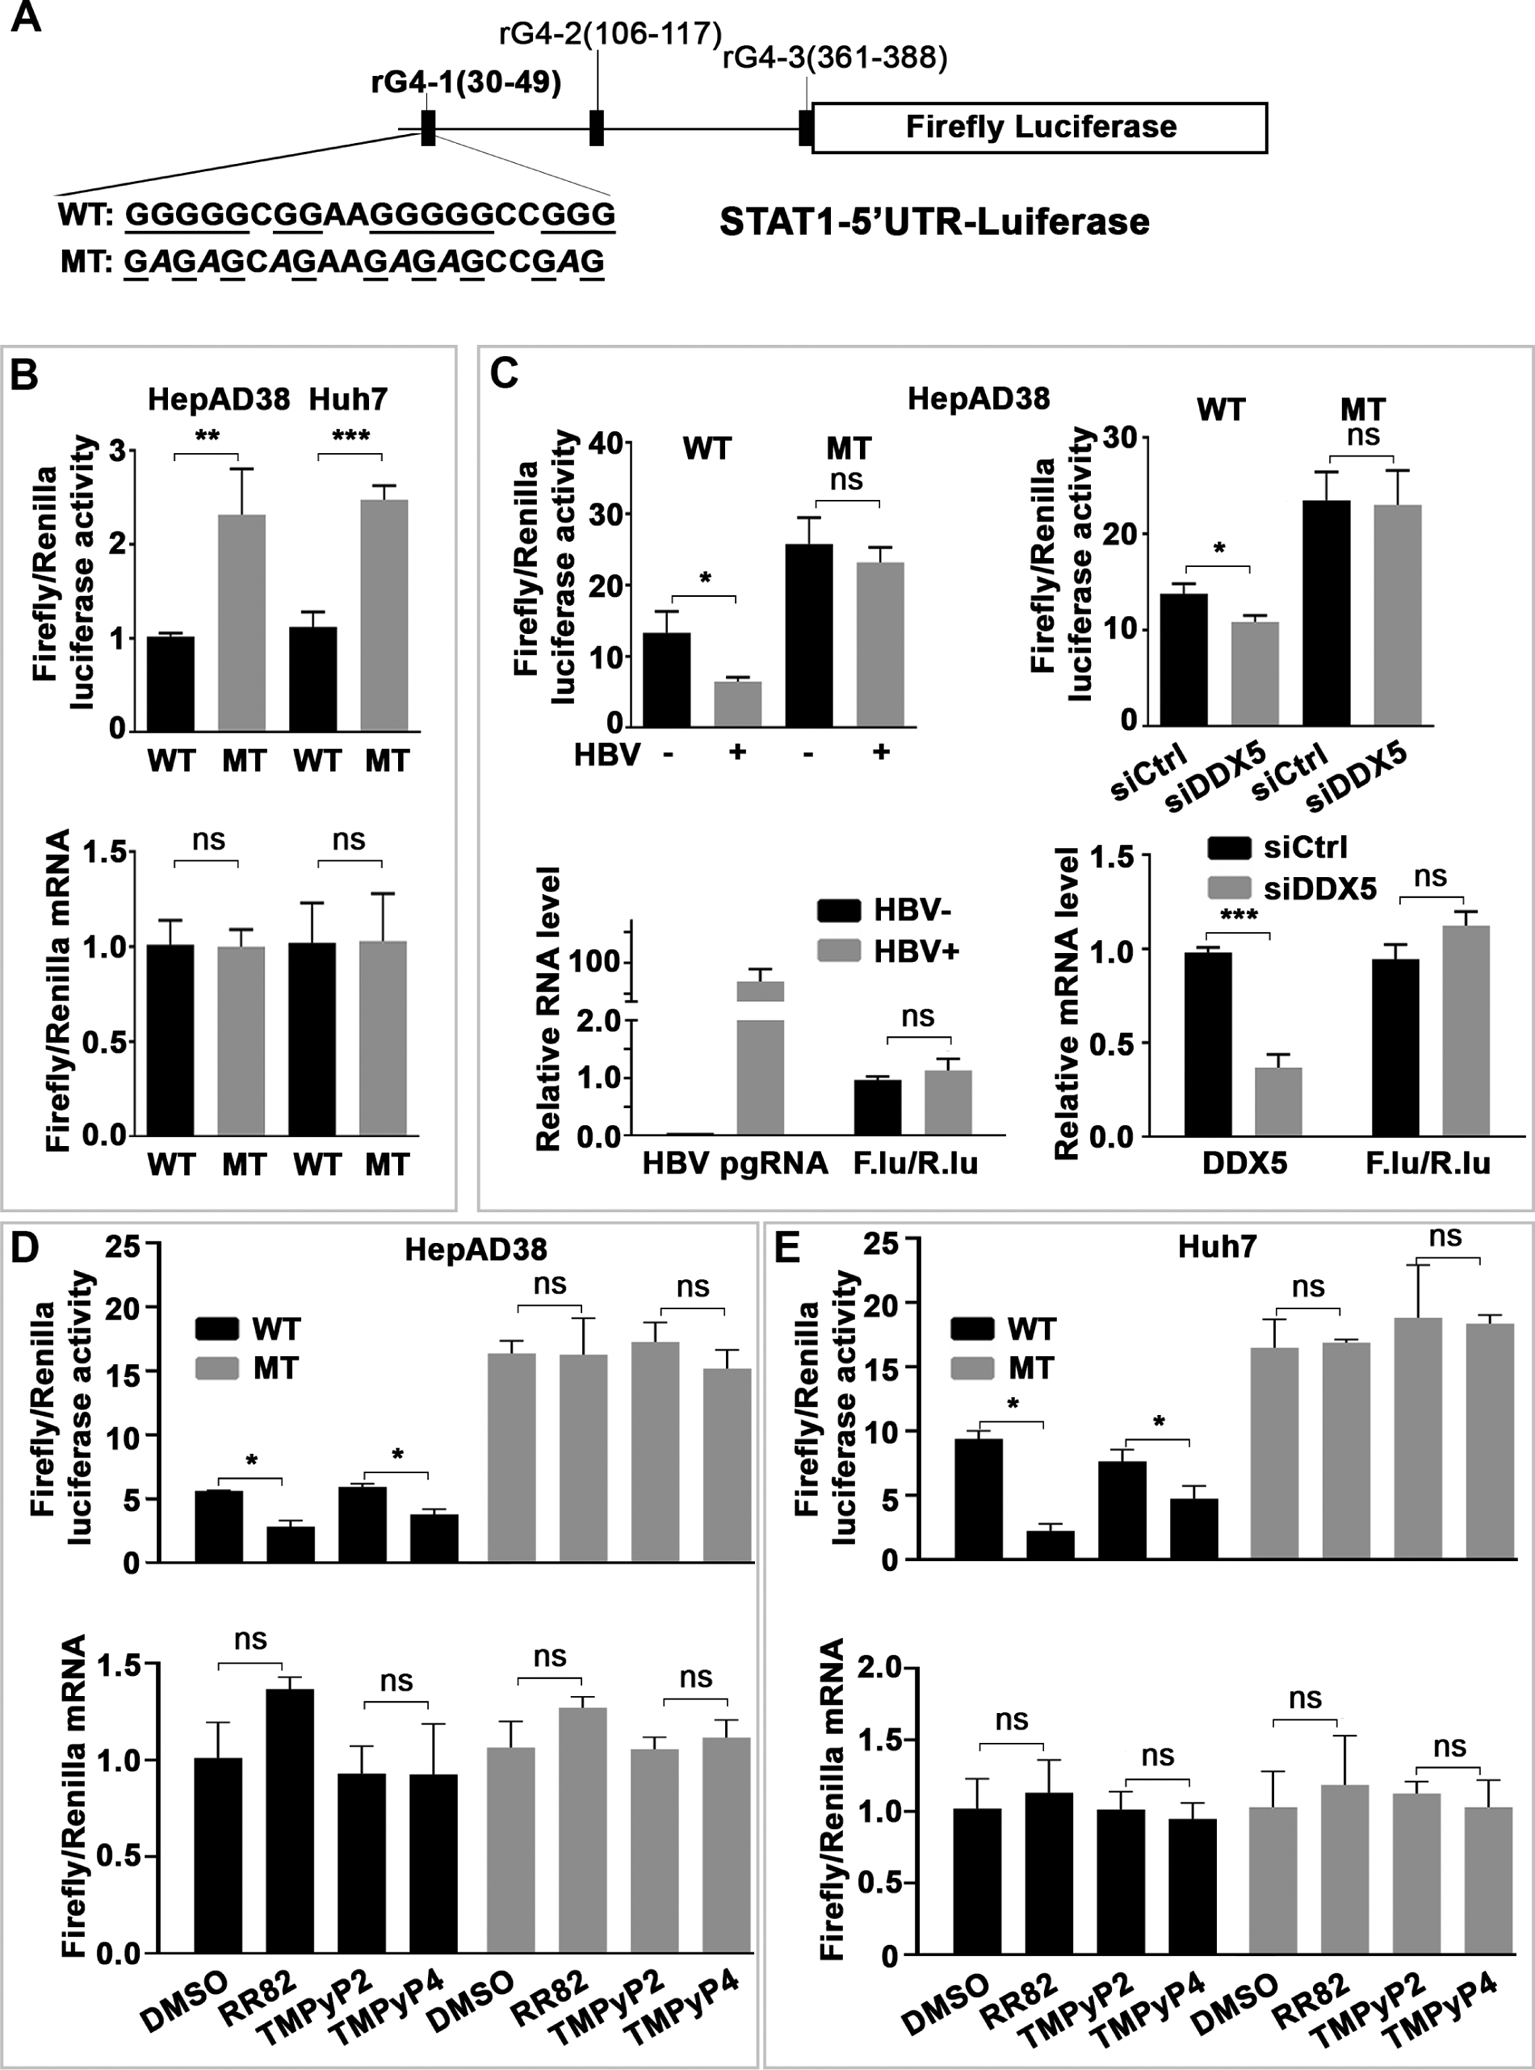
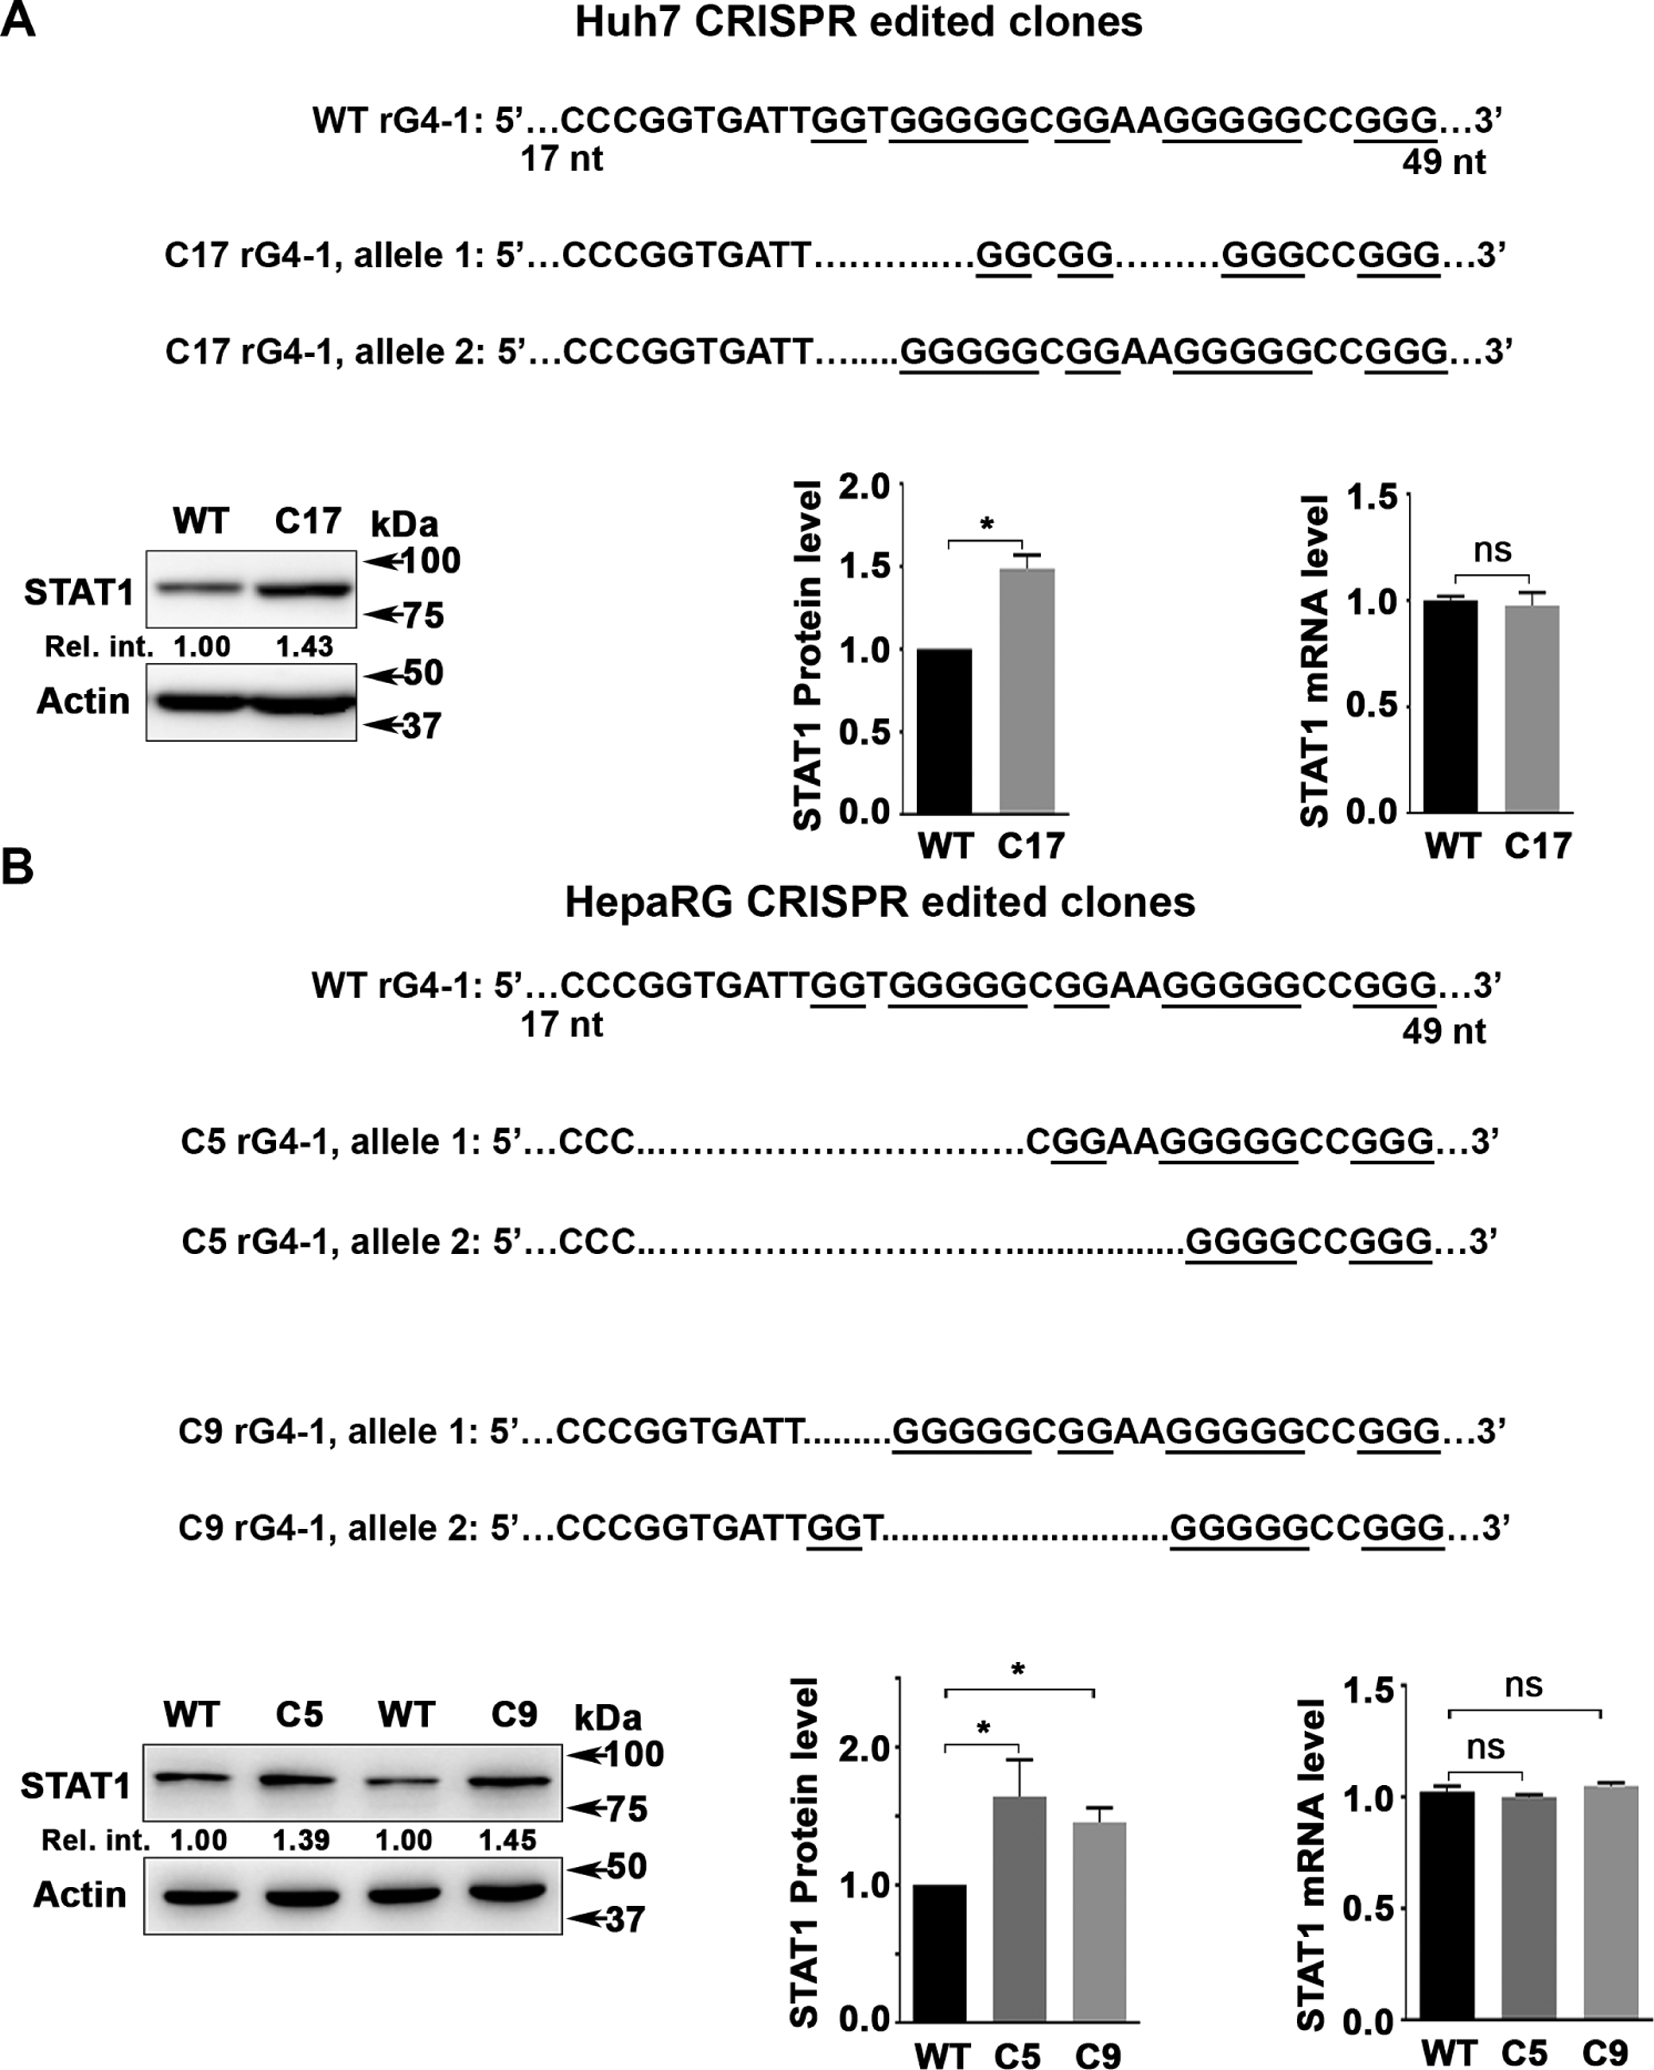
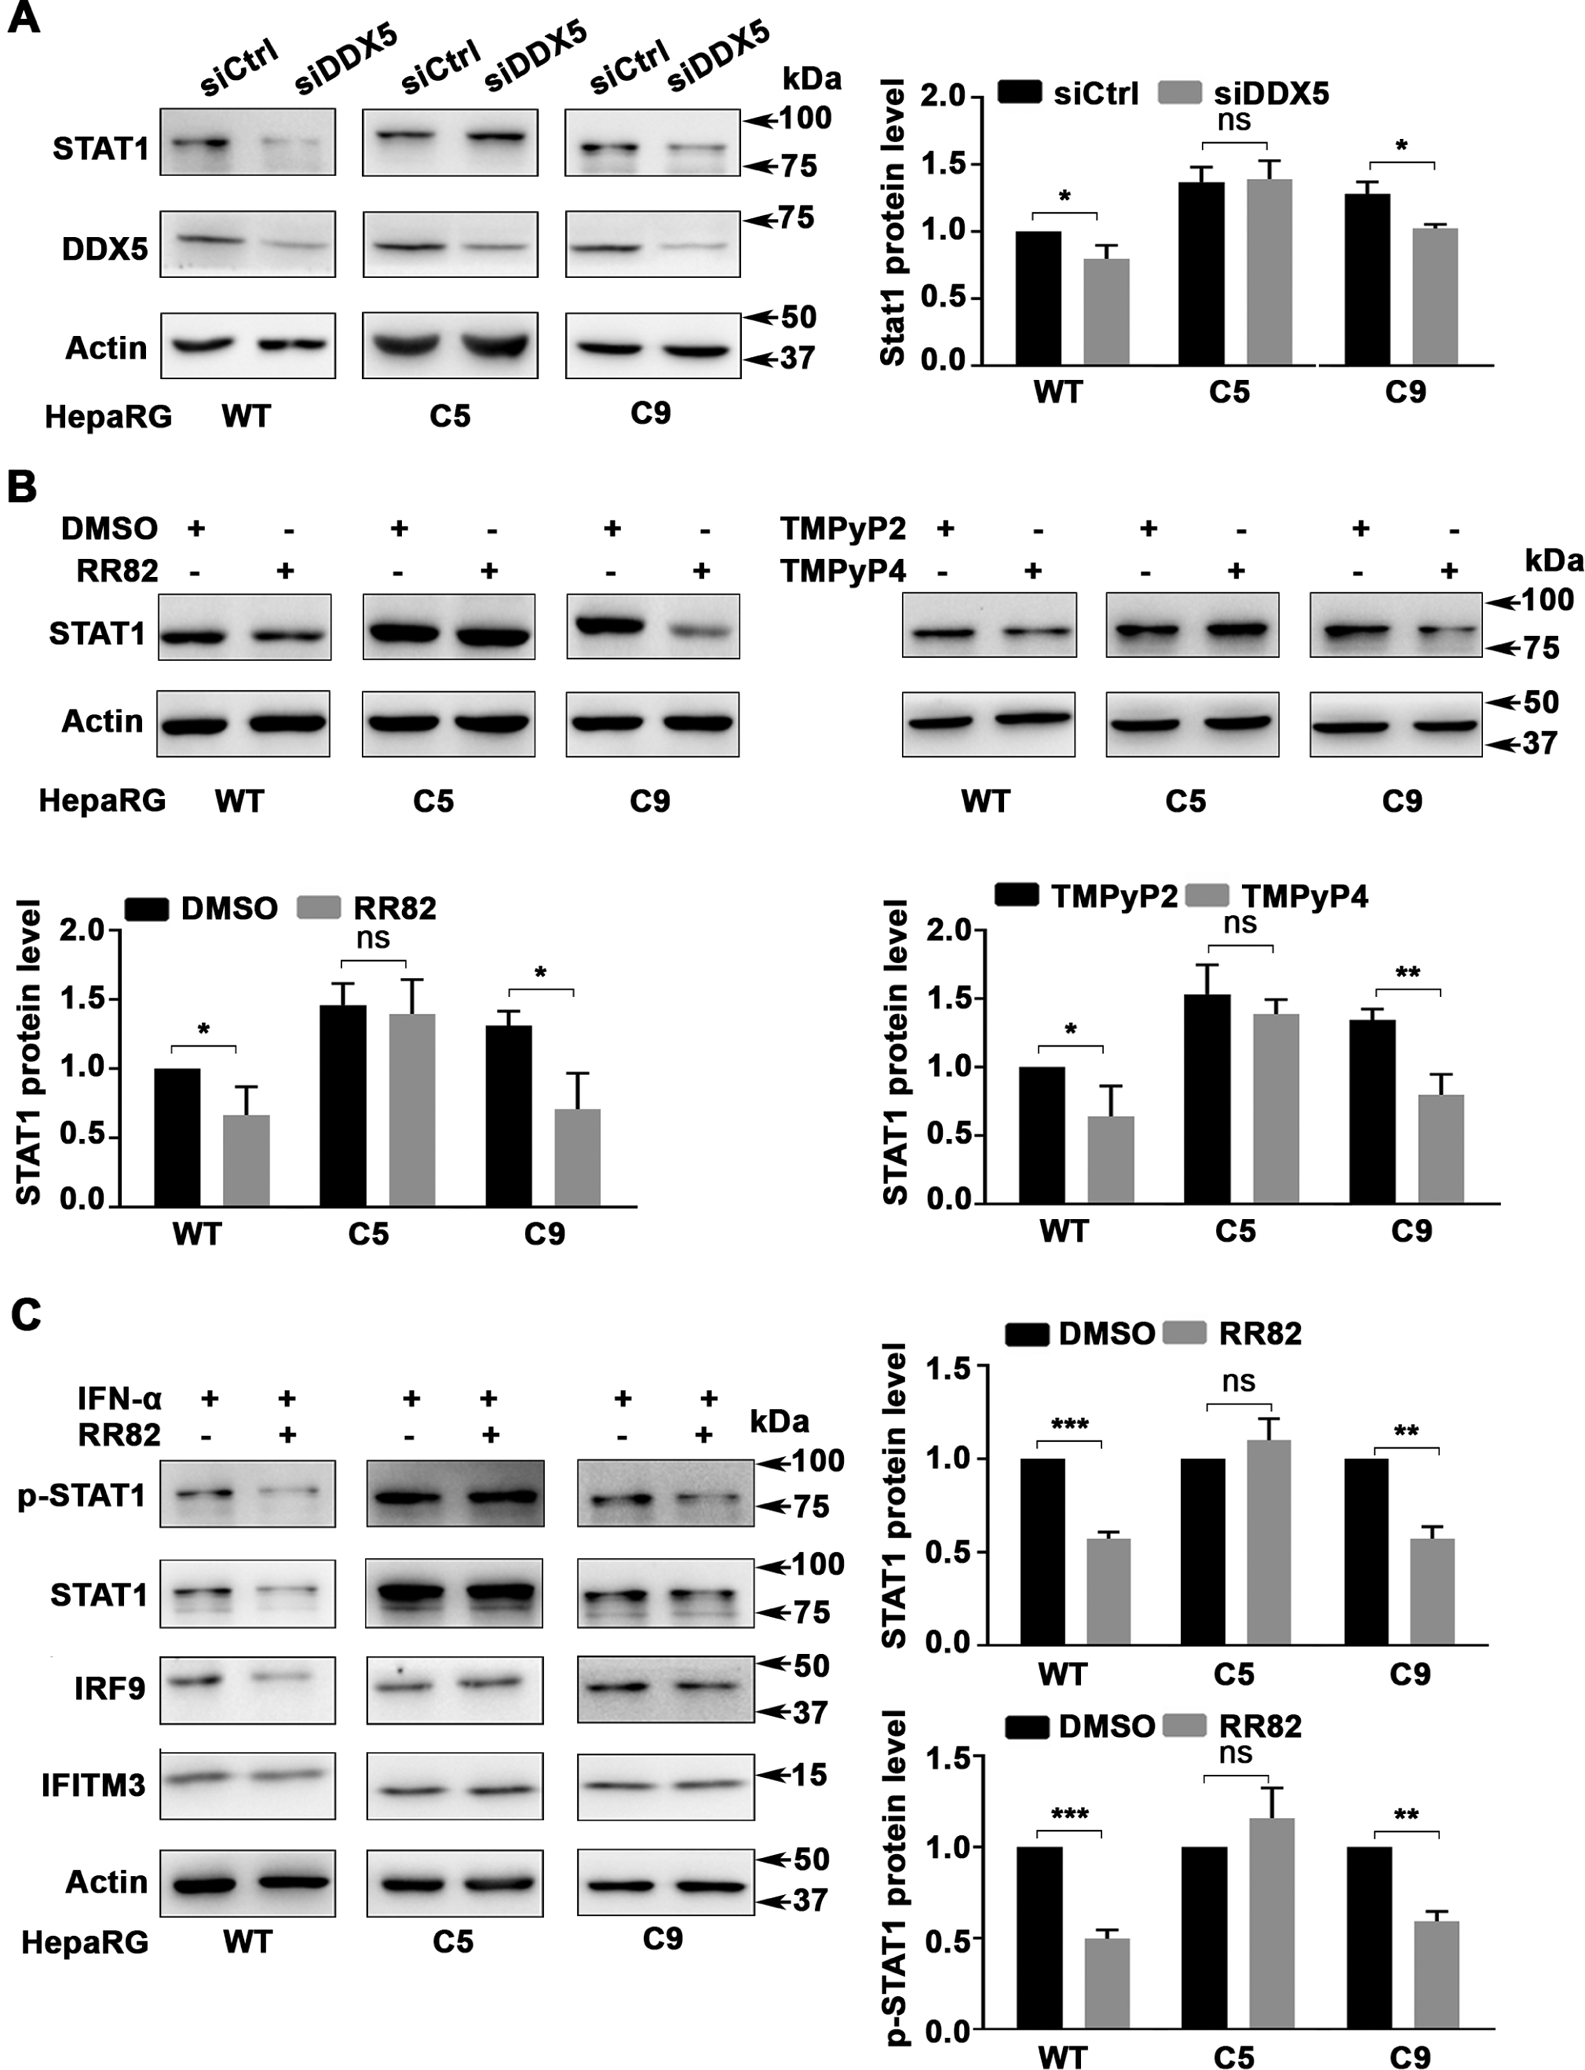
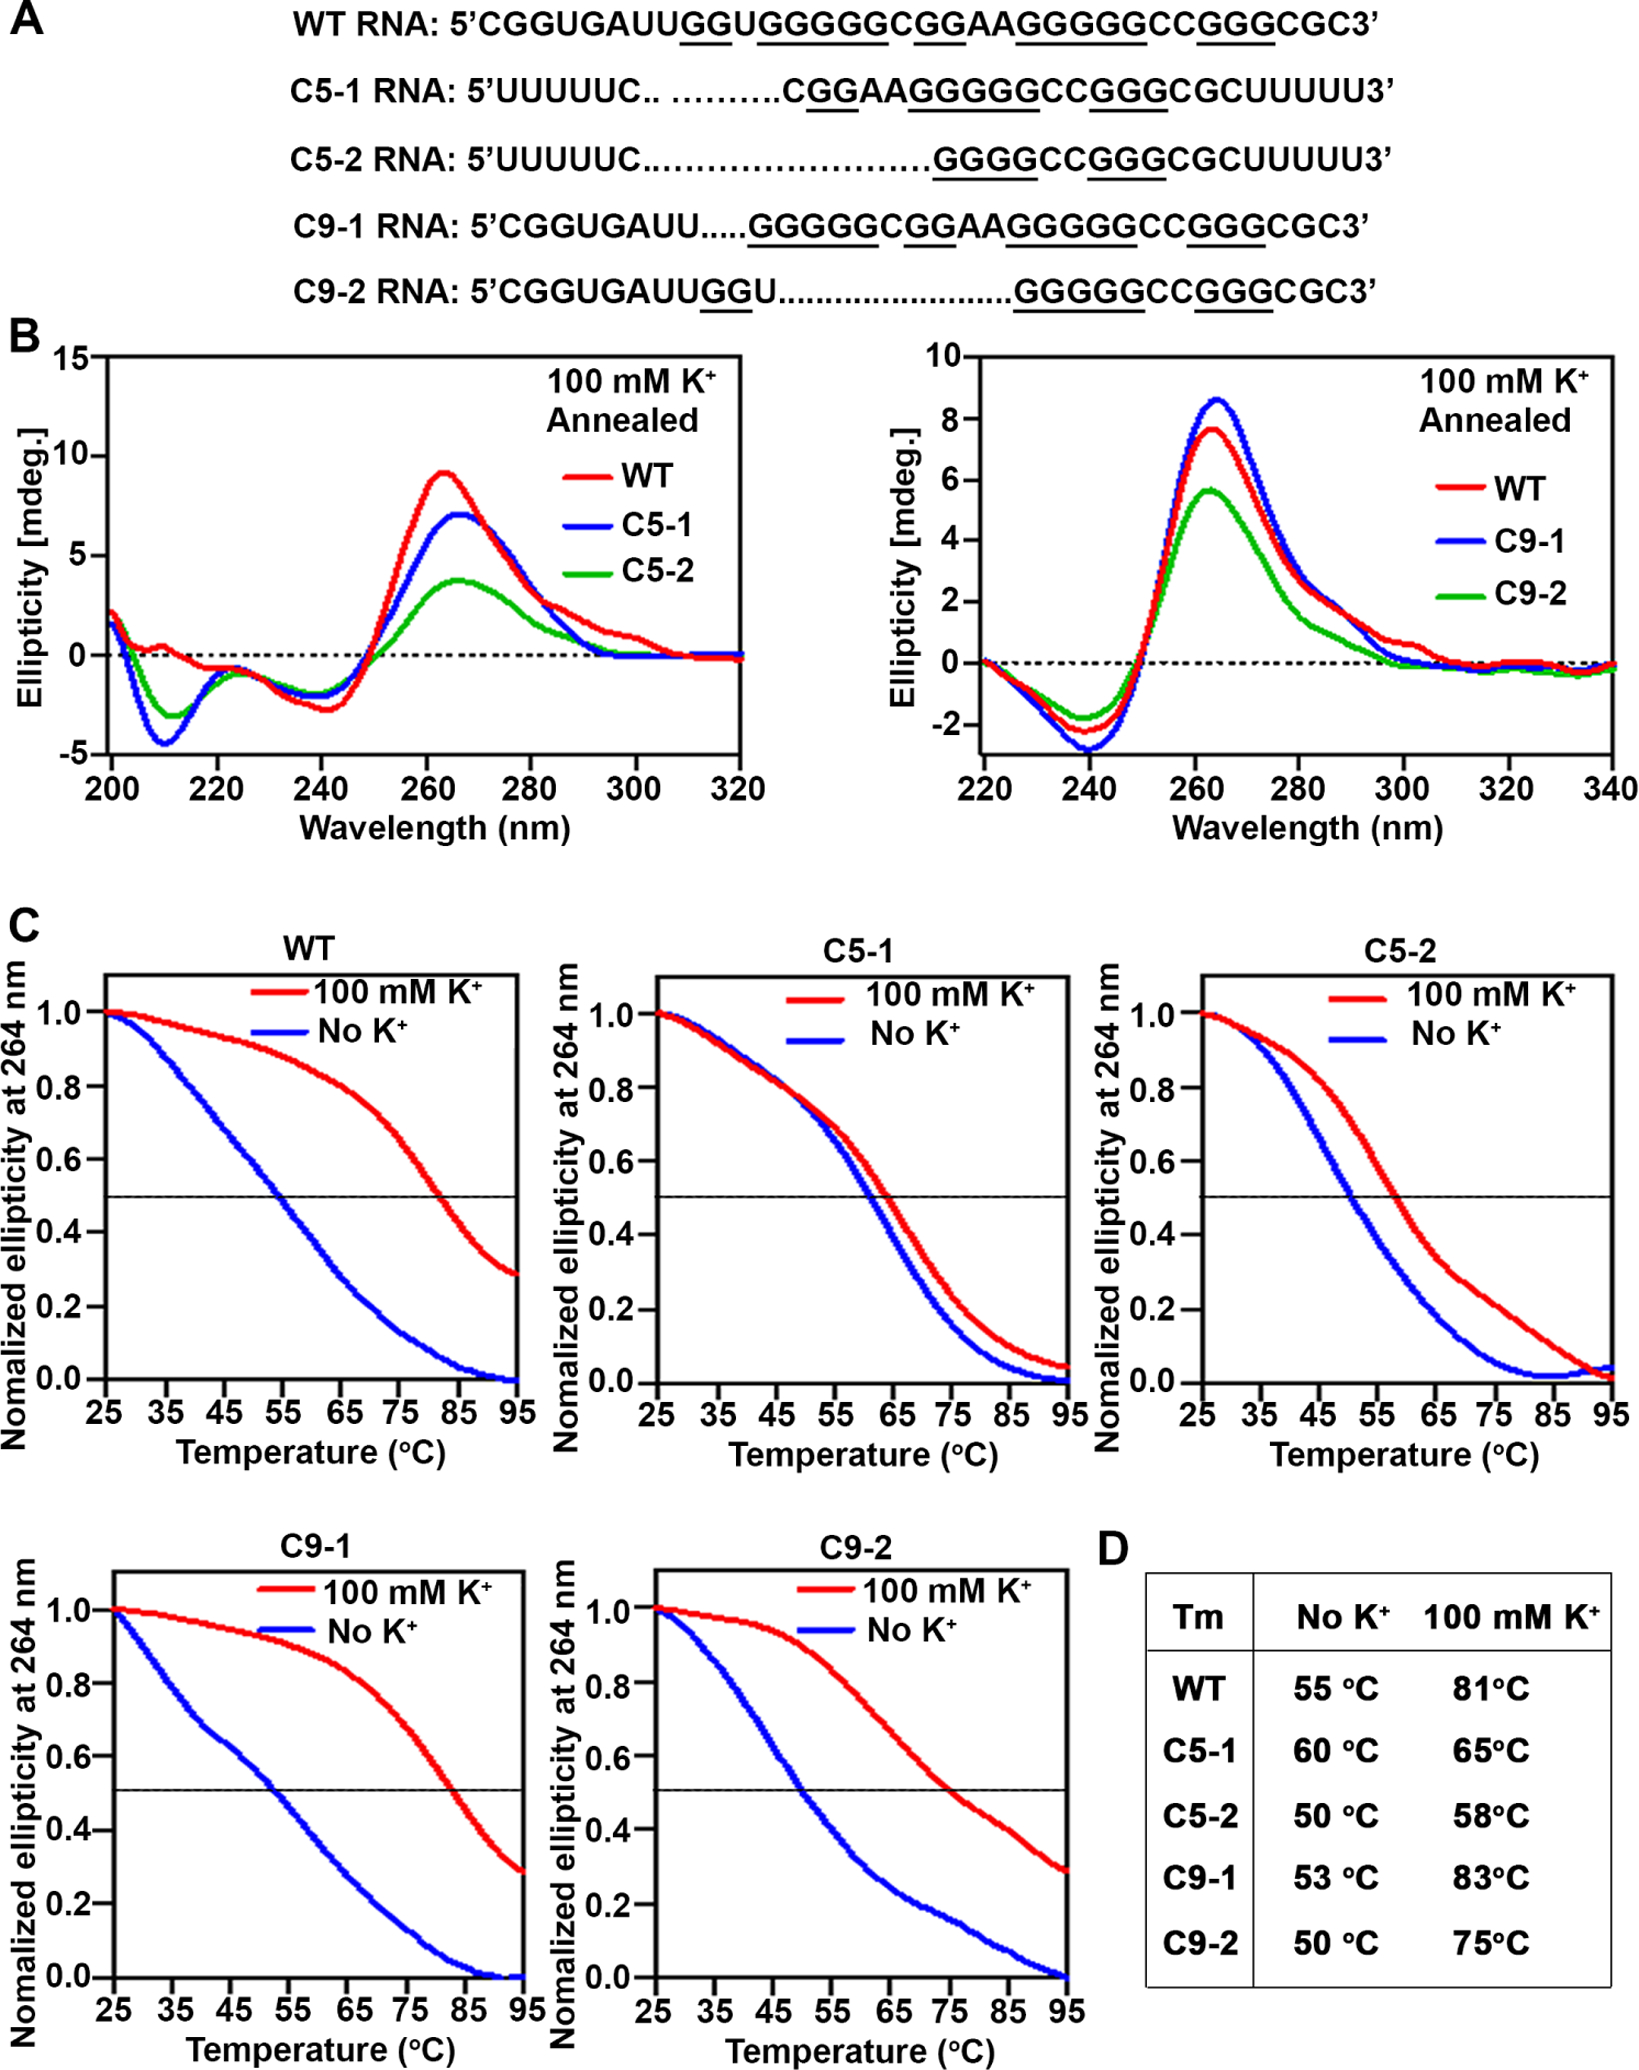
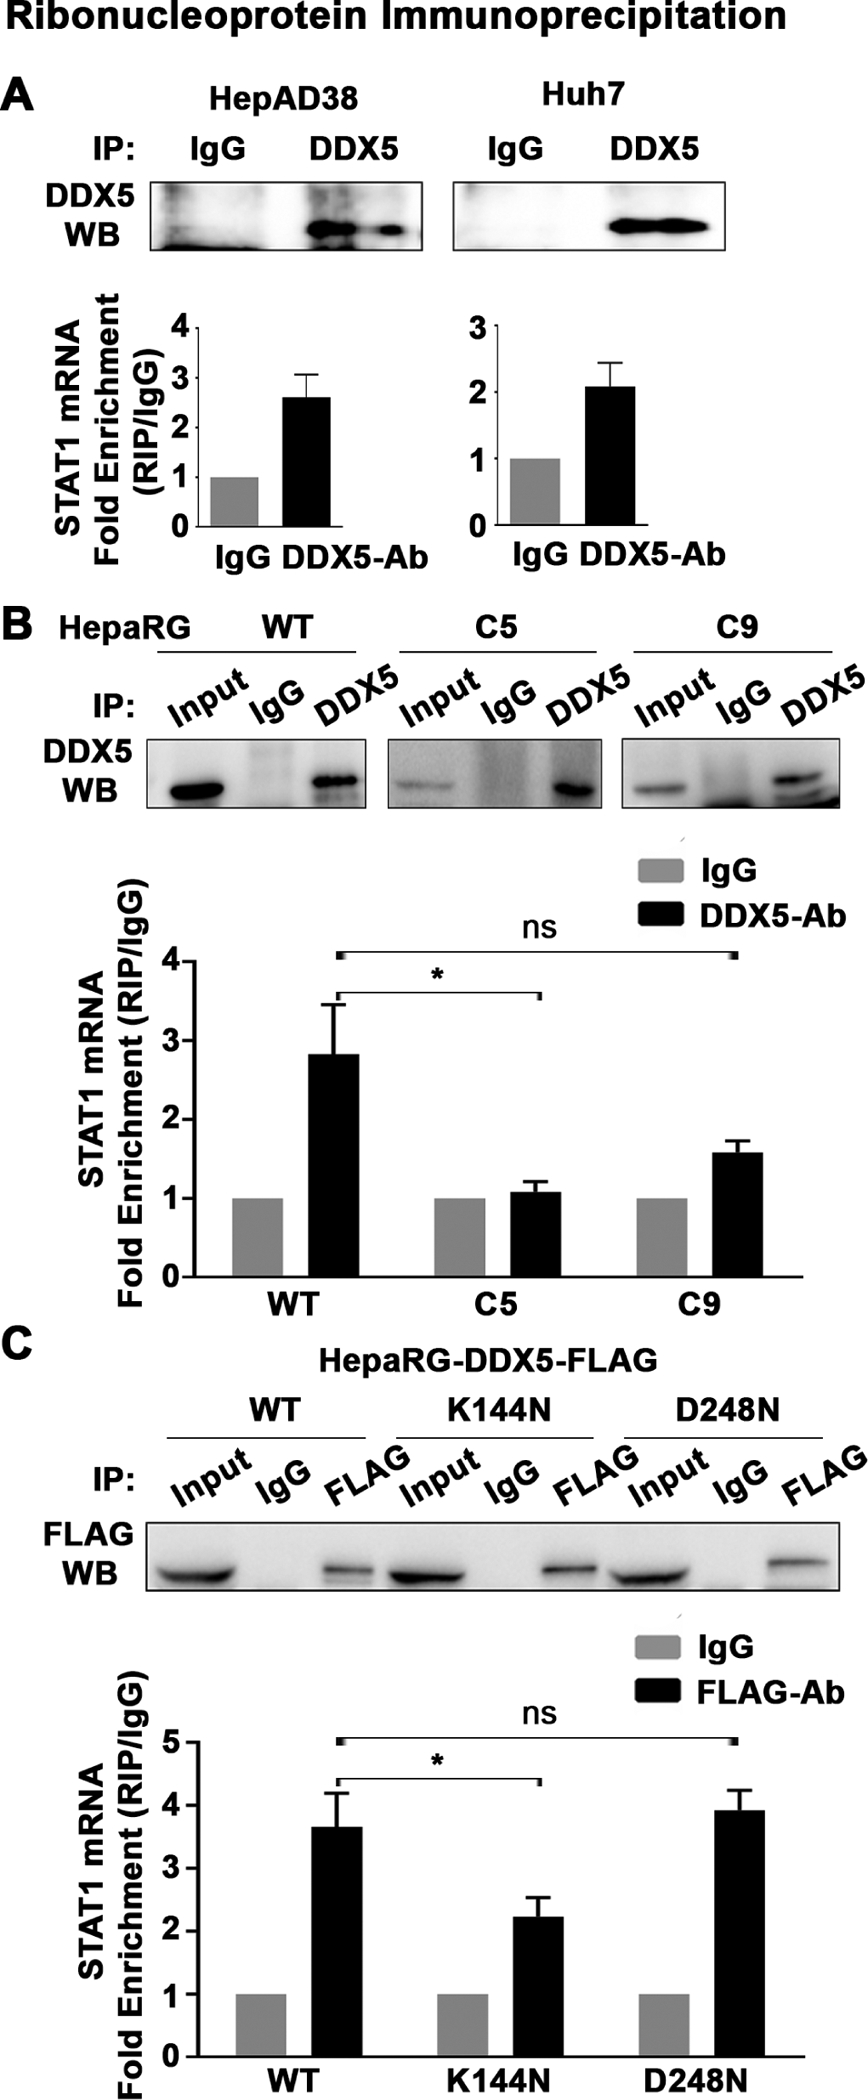
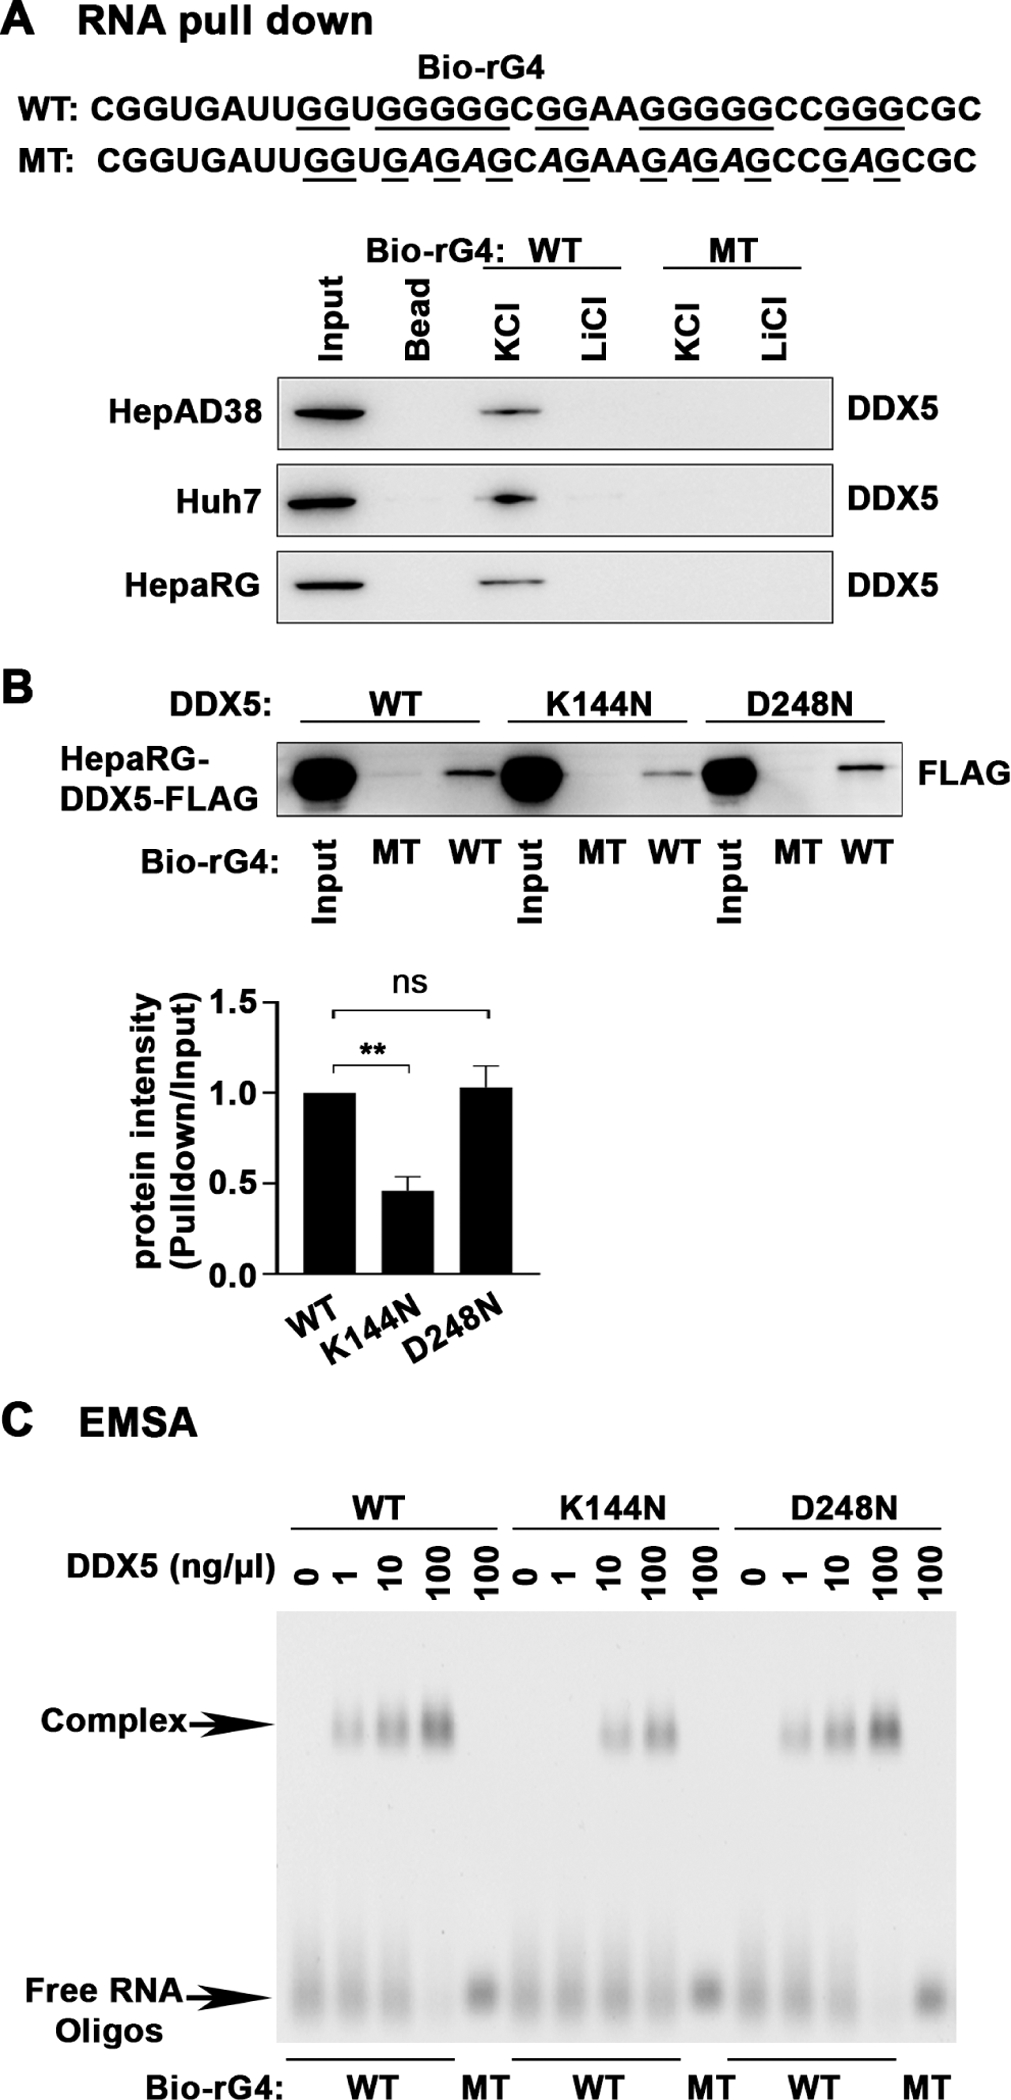
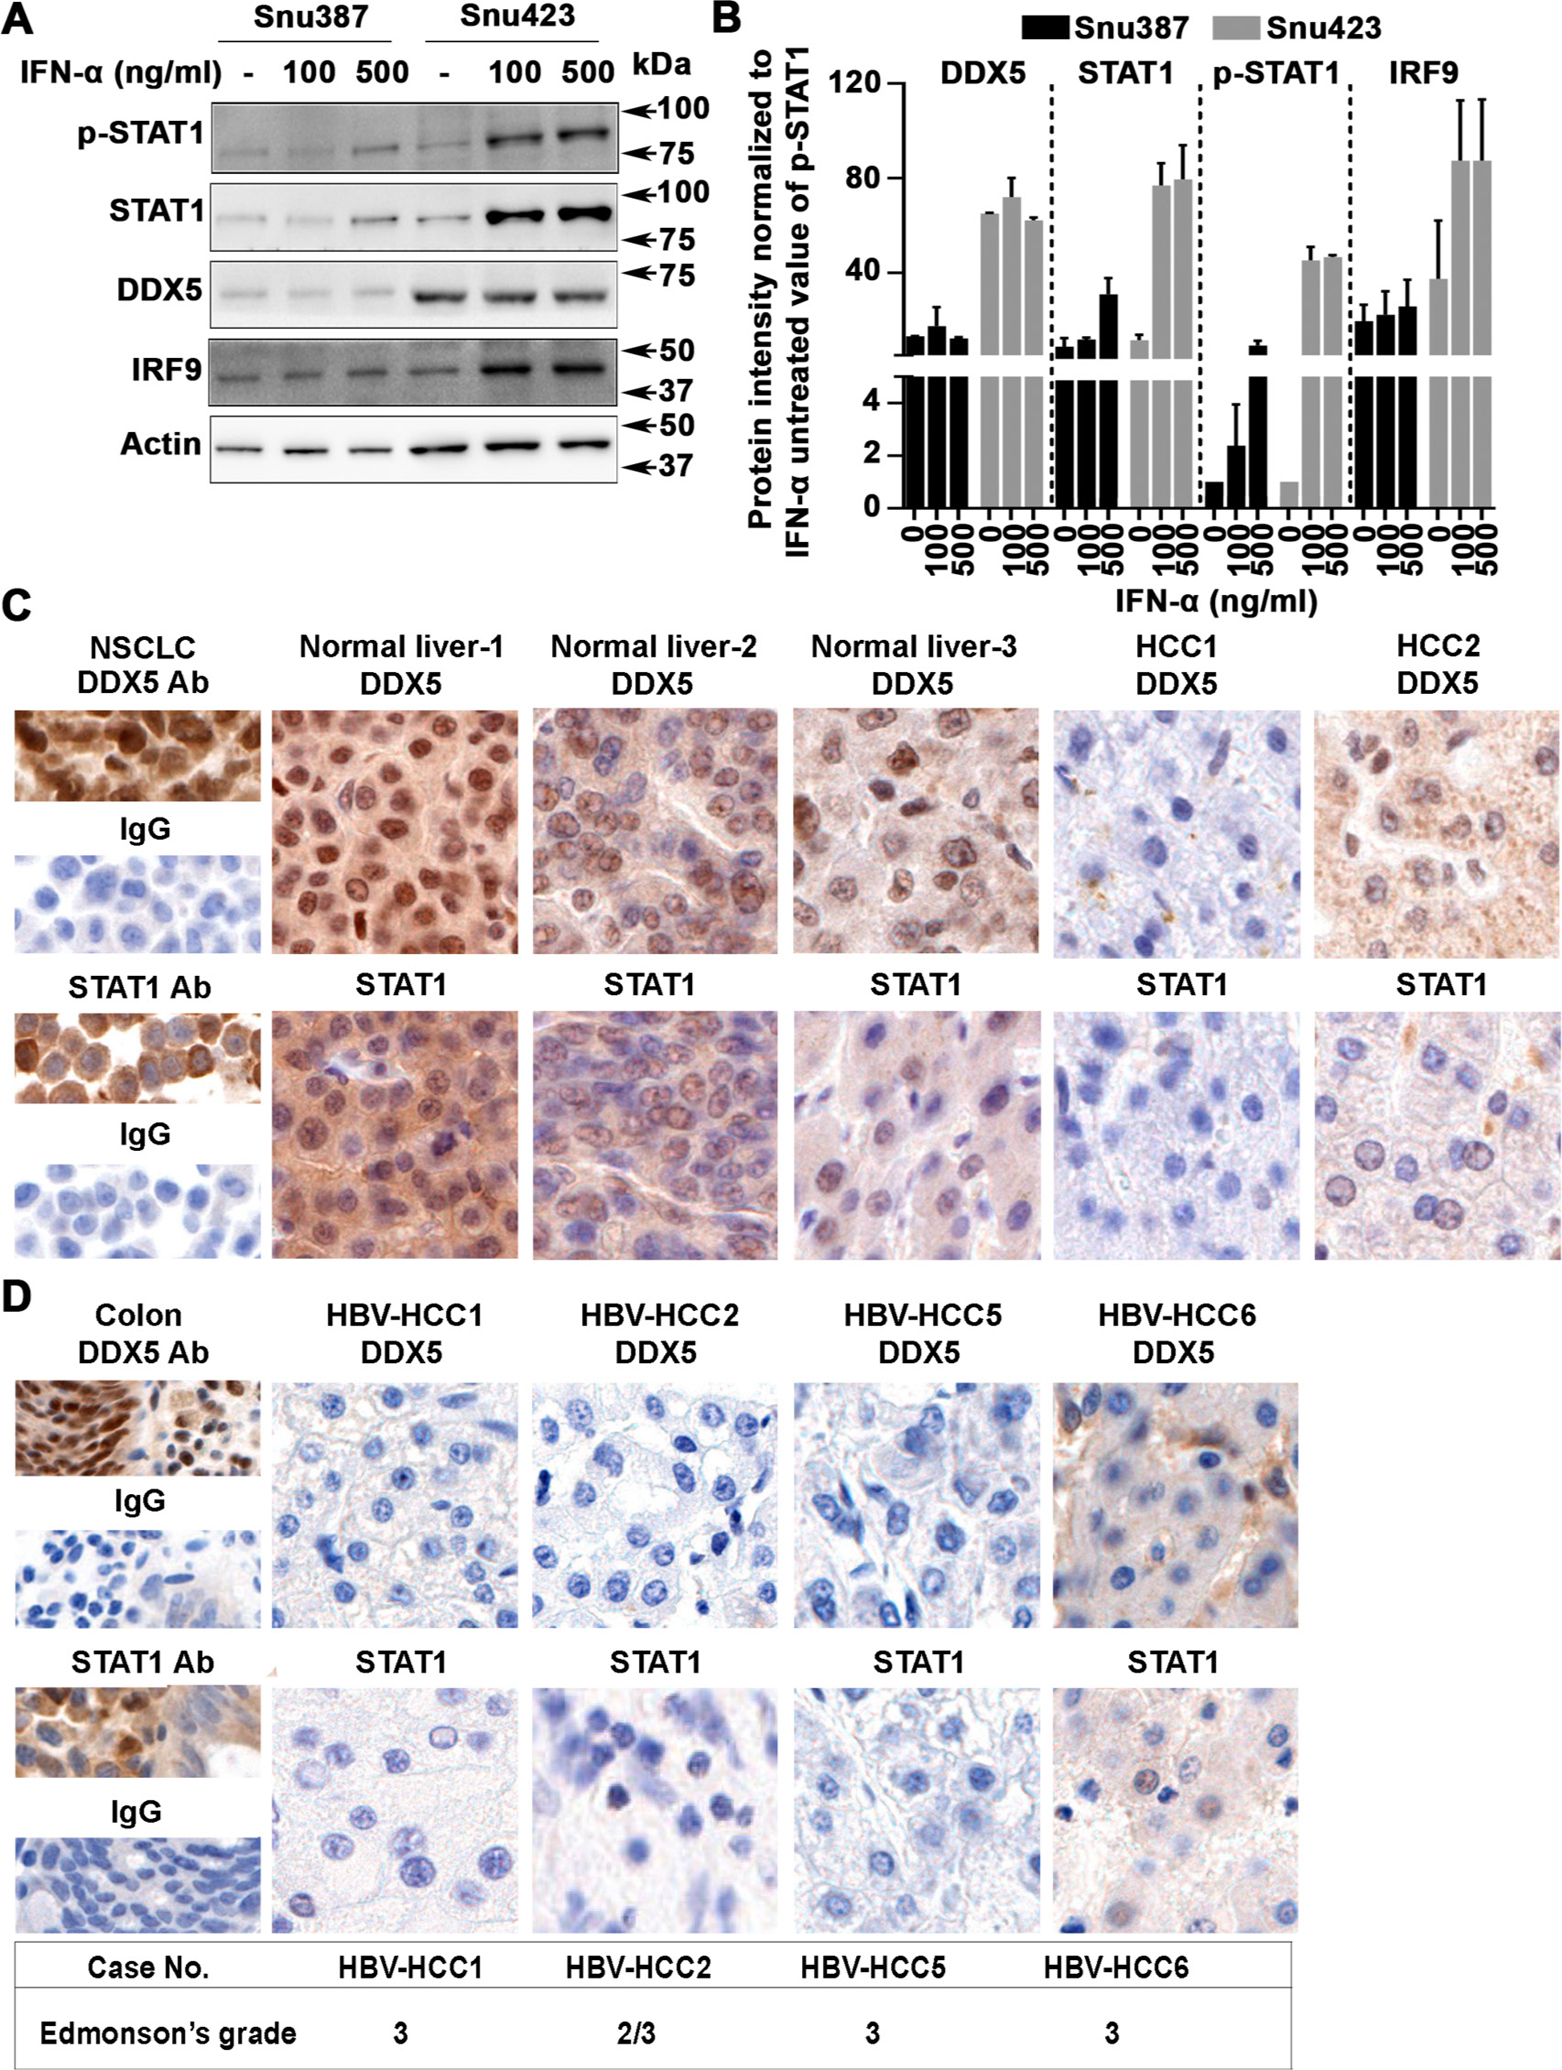
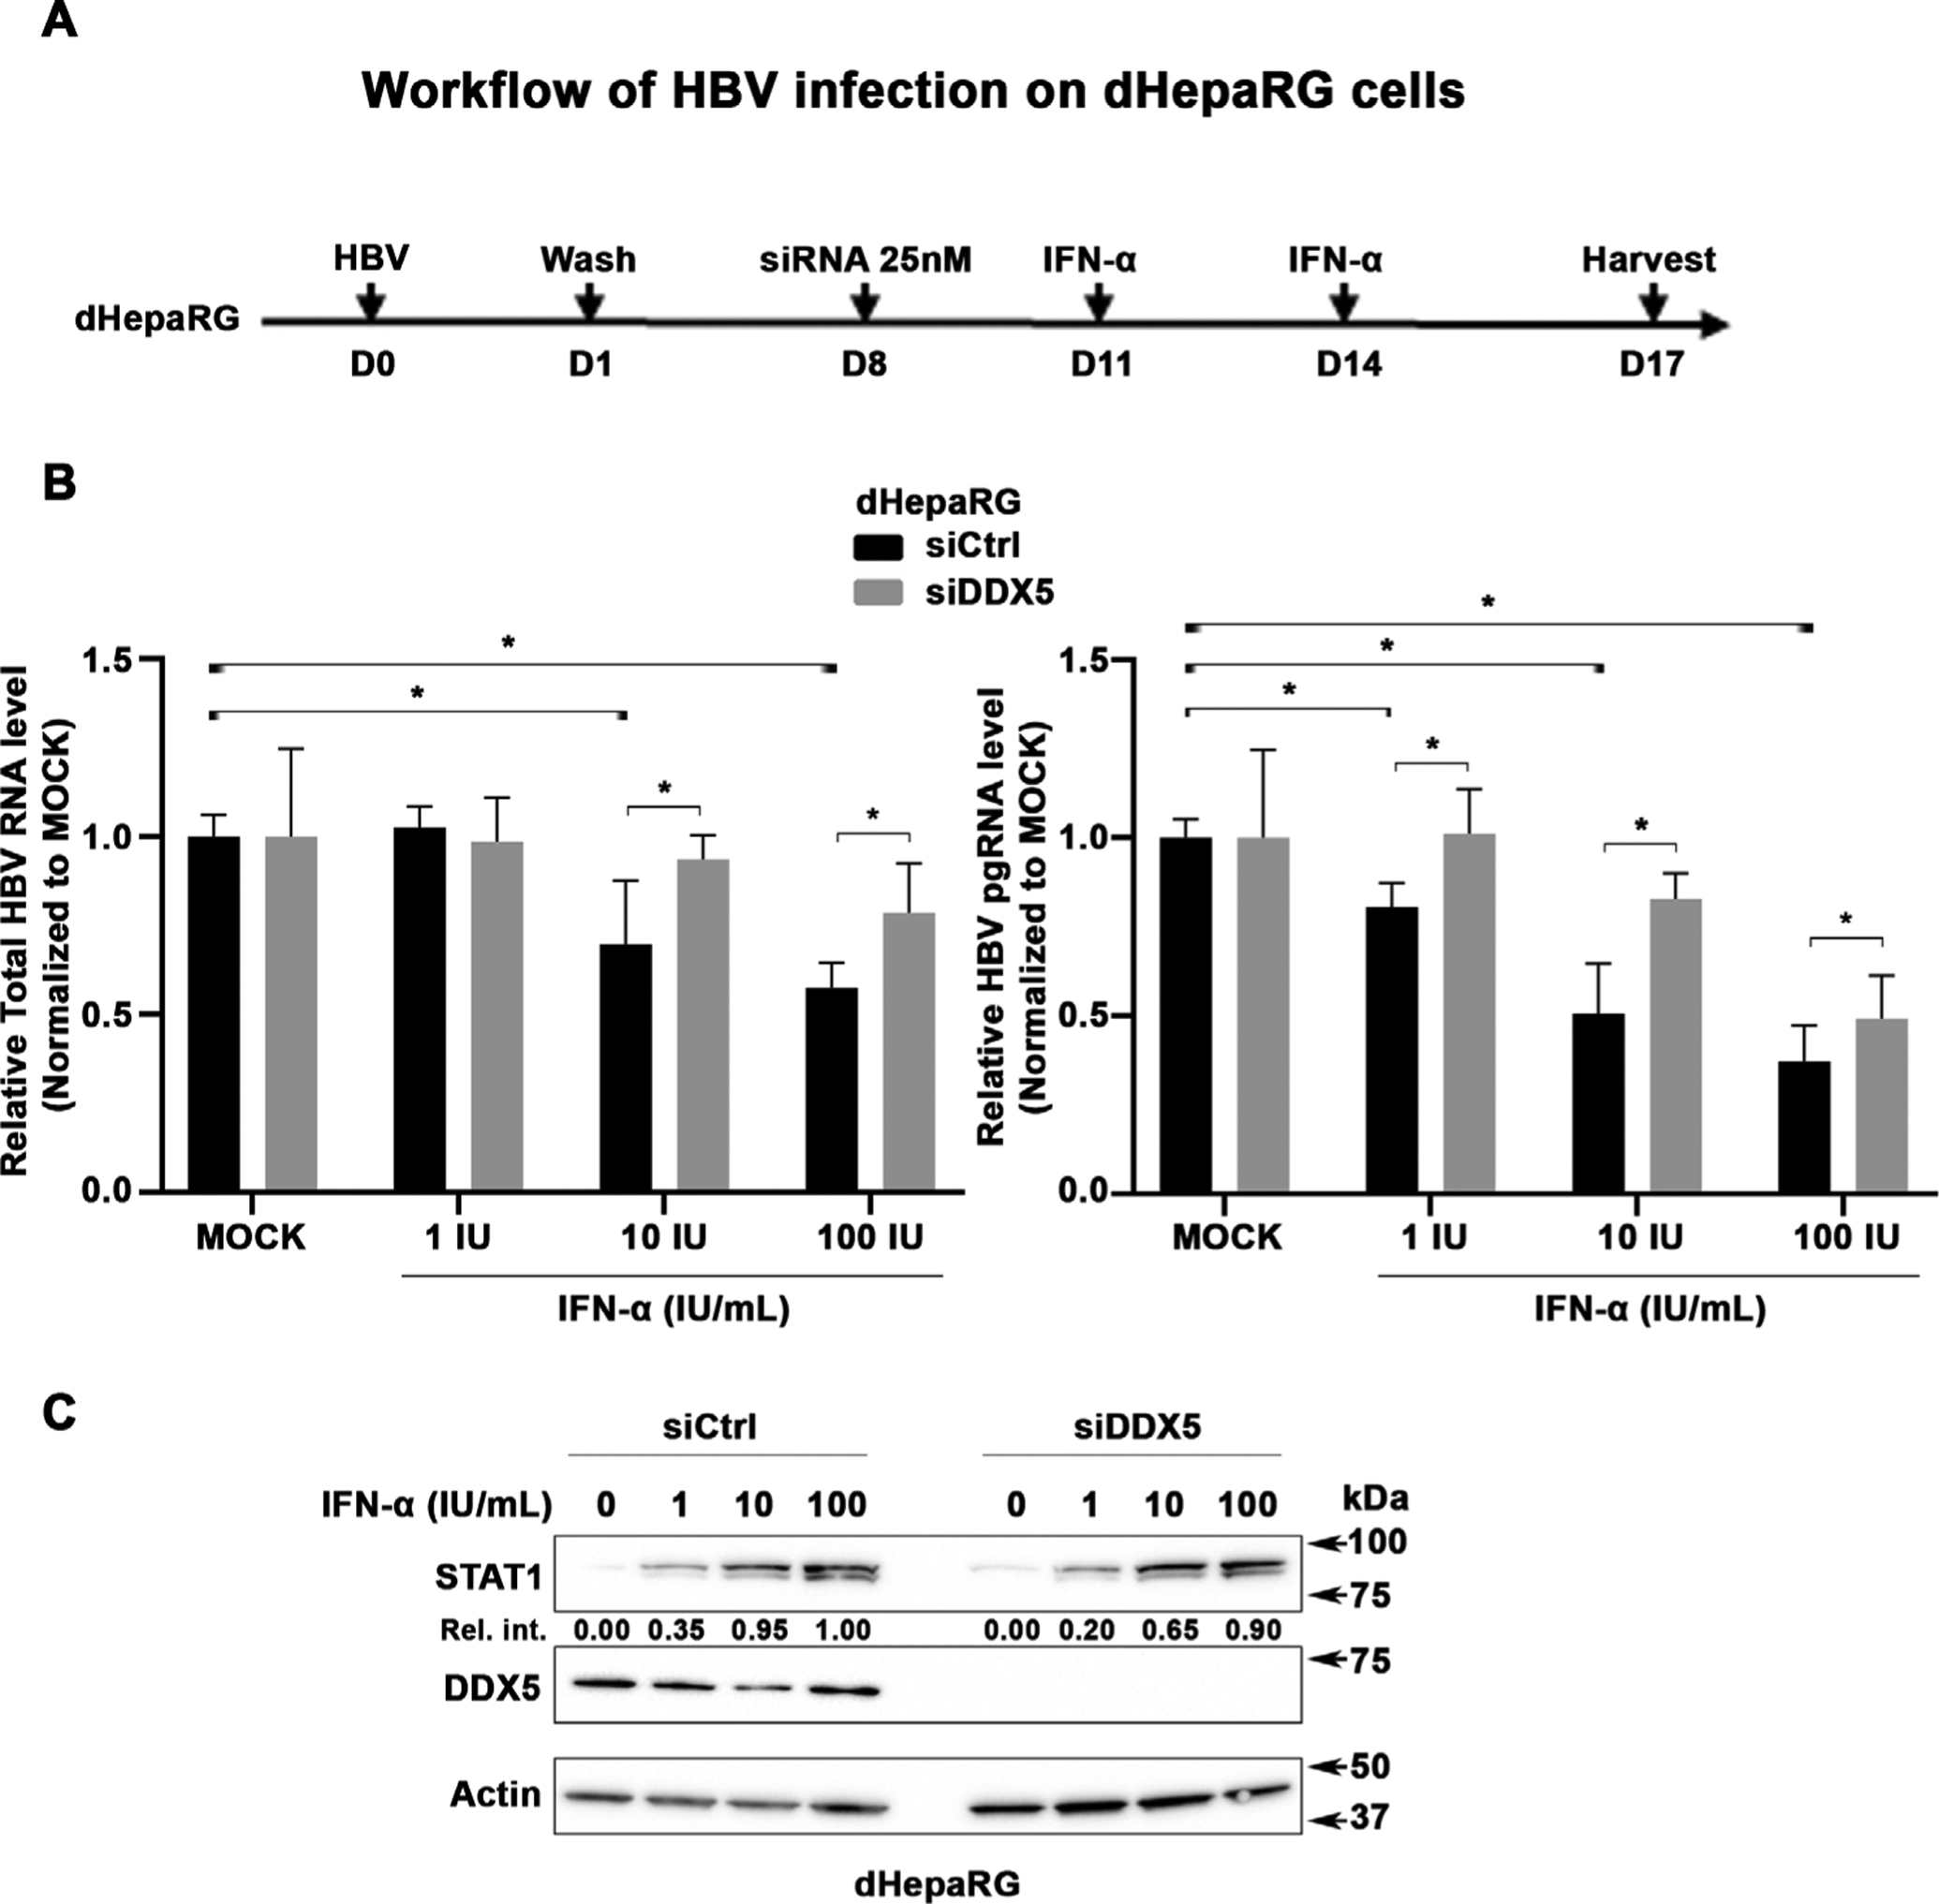
Design and results: Molecular, pharmacological and biophysical assays were used together with cellular models of HBV replication, HCC cell lines and liver tumours. We demonstrate that DDX5 regulates STAT1 mRNA translation by resolving a G-quadruplex (rG4) RNA structure, proximal to the 5' end of STAT1 5'UTR. We employed luciferase reporter assays comparing wild type (WT) versus mutant rG4 sequence, rG4-stabilising compounds, CRISPR/Cas9 editing of the STAT1-rG4 sequence and circular dichroism determination of the rG4 structure. STAT1-rG4 edited cell lines were resistant to the effect of rG4-stabilising compounds in response to IFN-α, while HCC cell lines expressing low DDX5 exhibited reduced IFN response. Ribonucleoprotein and electrophoretic mobility assays demonstrated direct and selective binding of RNA helicase-active DDX5 to the WT STAT1-rG4 sequence. Immunohistochemistry of normal liver and liver tumours demonstrated that absence of DDX5 corresponded to absence of STAT1. Significantly, knockdown of DDX5 in HBV infected HepaRG cells reduced the anti-viral effect of IFN-α.

Conclusion: RNA helicase DDX5 resolves a G-quadruplex structure in 5'UTR of STAT1 mRNA, enabling STAT1 translation. We propose that DDX5 is a key regulator of the dynamic range of IFN response during innate immunity and adjuvant IFN-α therapy.

Keywords: hepatitis B; hepatocellular carcinoma; hepatocyte; interferon-alpha; molecular mechanisms.


Conflict of interest statement

Competing interests: None declared.

Figures

Figure 1
Figure 1
DDX5 knockdown regulates STAT1 mRNA translation. (A) Immunoblots of IFN-α induced proteins using lysates from HepAD38 cells with (+) or without (−) HBV replication for 5 days as a function of IFN-α (500 ng/mL) treatment for the last 24 hours. (Right panel) Quantification of DDX5 and STAT1 protein level, by ImageJ software, from three independent biological replicates. *P<0.05, **p<0.01; error bars indicate mean±SEM. Immunoblot of indicated proteins in: (B) HepAD38, Huh7 and HepaRG cells transfected with DDX5 siRNAs (siDDX5-1 or siDDX5-2) or negative control siRNA (siCtrl) for 48 hours and (C) in WT and DDX5 knockdown (DDX5KD) HepAD38 cell lines KD2, KD3 and KD5. (D–F) qRT-PCR of HBV pgRNA and STAT1 mRNA, as indicated, using RNA from: (D) HepAD38 cells with (+) or without (−) HBV replication for 5 days; (E) WT and KD5 HepAD38 cells (left panel), and WT and KD5 HepAD38 cells transfected with siSTAT1 or siCtrl for 48 hours (right panel); and (F) HepAD38, Huh7 and HepaRG cells transfected with siDDX5 or siCtrl for 48 hours. Statistical analysis of DDX5 and STAT1 mRNA levels from three biological replicates. *P<0.05. Error bars indicate mean±SEM. IFN, interferon; NS, not significant.
Figure 2
Figure 2
G-quadruplex-stabilising drugs reduce STAT1 protein levels. (A) Chemical structure of G4-stabilising compounds PhenDC3, RR82, TMPyP4 and TMPyP2. (B) Immunoblots of STAT1, NRAS and DDX5, using lysates from HepAD38 cells treated for 48 hours with PhenDC3 (5 μM) or RR82 (5 μM). (Lower panel) qRT-PCR of STAT1 mRNA using RNA from HepAD38 cells treated with DMSO, PhenDC3 (5 μM) or RR82 (5 μM) for 48 hours. (C) Immunoblots of STAT1 from lysates of HepAD38 and Huh7 cells treated with TMPyP4 (5 μM) or TMPyP2 (5 μM) for 48 hours. (Lower panel) qRT-PCR of STAT1 mRNA from HepAD38 and Huh7 cells, treated as indicated. Statistical analysis of STAT1 mRNA is from three biological replicates. Error bars indicate mean±SEM. NS, not significant.
Figure 3
Figure 3
G-quadruplex (rG4) regulates STAT1 expression post-transcriptionally. (A) Human STAT1 5’UTR upstream of Firefly (F.) luciferase reporter, driven from SV40 promoter. Putative rG4 sequences in 5’UTR indicated as rG4-1, rG4-2 and rG4-3. WT rG4-1 nucleotide sequence is shown. Italics indicate site-directed changes in mutant MT-rG4-1. (B–E) Ratio of Firefly/Renilla luciferase activity at 24 hours after cotransfection of WT or MT STAT1-5’UTR-F. Luciferase and Renilla-Luciferase expression plasmids. (Lower panels) Ratio of Firefly/Renilla luciferase mRNAs quantified by qRT-PCR. (B) HepAD38 and Huh7 cells. (C) HepAD38 cells with (+) or without (−) HBV replication for 5 days. (D) HepAD38 cells and (E) Huh7 cells treated with indicated G-quadruplex stabilising drugs (5 μM) for 24 hours. Statistical analysis from three independent biological replicates. *P<0.05, **p<0.01, ***p<0.001. 5′UTR, 5′untranslated region; NS, not significant.
Figure 4
Figure 4
Genomic editing of rG4-1 increases STAT1 protein levels. (A) Sequence of CRIPSR/Cas9 edited rG4-1 sequence in (A) Huh7 and (B) HepaRG cells. Immunoblot of STAT1 in indicated cell lines. Right panels, quantification of STAT1 protein by ImageJ software, and qRT-PCR of STAT1 mRNA, from three independent biological replicates. Error bars indicate mean±SEM. *P<0.05. NS, not significant.
Figure 5
Figure 5
Effect of G-quadruplex stabilising drugs on rG4-1 edited HepaRG cells. Immunoblots of indicated proteins using lysates from indicated HepaRG cells (WT, C5 and C9). (A) After transfection of siCtrl or siDDX5 RNA for 48 hours, (B) following treatment with RR82 (5 μM), TMPyP4 (5 μM) or TMPyP2 (5 μM) for 48 hours and (C) treatment with RR82 (5 μM) for 48 hours in combination with IFN-α (500 ng/mL) for the last 24 hours. quantification (A–C) from three independent biological replicates. Error bars indicate mean±SEM. *P<0.05, **p<0.01, ***p<0.001. IFN, interferon; NS, not significant.
Figure 6
Figure 6
The rG4-1 sequence in 5’UTR of STAT1 mRNA forms G-quadruplex. (A) Synthetic RNA oligonucleotides of WT STAT1 rG4-1 and corresponding mutants in HepaRG clones C5 and C9. (B) CD spectroscopy measurement and (C) melting curves of RNA oligonucleotides annealed by heating to 95°C and slowly cooled down to room temperature. (D) Melting temperature (TM), without and with (100 mM) KCl, calculated from A to C.
Figure 7
Figure 7
DDX5 binds STAT1 mRNA. Ribonucleoprotein immunoprecipitation (RIP) assays with DDX5 antibody performed in (A) HepAD38, Huh7, and (B) HepaRG WT, C5 and C9 cells. DDX5 enriched RNAs quantified by qRT-PCR using STAT1 primers. Results are from three biological replicates. *P<0.05. (C) RIP assays with FLAG antibody performed using HepaRG-DDX5-WT-FLAG, HepaRG-DDX5-K144N-FLAG and HepaRG-DDX5-D248N-FLAG expressing cell lines. FLAG antibody immunoprecipitated RNAs quantified by qRT-PCR using STAT1 primers. Results are from three biological replicates. *P<0.05. NS, not significant.
Figure 8
Figure 8
DDX5 binds rG4-1 structure of 5’UTR of STAT1 mRNA. (A) (Upper panel) Sequence of synthetic biotinylated RNA oligonucleotides, Bio-rG4 WT and MT. (Lower panel) RNA pull-down assays using Bio-rG4 WT and MT in 100 mM KCl or 100 mM LiCl, bound to lysates from indicated cell lines, followed by immunoblots with DDX5 antibody. (B) RNA pull-down assays using Bio-rG4 WT and MT in 100 mM KCl, bound to lysates from HepaRG-DDX5-WT-FLAG, HepaRG-DDX5-K144N-FLAG and HepaRG-DDX5-D248N-FLAG expressing cell lines, followed by immunoblots with FLAG antibody. A representative assay is shown from three independent experiments. Band intensities quantified by ImageJ. Results are from three biological replicates. **P<0.01. (C) EMSA using Bio-rG4 WT and MT RNA oligonucleotides, in binding reactions containing indicated amount of immunoaffinity purified DDX5-WT, DDX5-K144N and DDX5-D248N, analysed by native gel electrophoresis in 1.5% agarose gels and visualised by staining with SYBR-Gold dye (ThermoFisher) and ChemiDoc touch imaging system. 5’UTR, 5′untranslated region; EMSA, electrophoretic mobility shift assay; ns, not significant.
Figure 9
Figure 9
DDX5 expression level in liver cancer cell lines and liver tumours. (A) Immunoblots using lysates from indicated cell lines treated with IFN-α (100 and 500 ng/mL) for 12 hours. (B) Quantification shows ratio of DDX5, STAT1, p-STAT1 and IRF9 relative to level of p-STAT1 in IFN-α untreated cells. Results are average from three independent experiments. (C) Immunohistochemistry of normal liver, HCCs, and (D) HBV-related HCCs, was performed as described. Non-small cell lung cancer (NSCLC) tissue and normal human colon tissue were used as positive controls, as indicated, with DDX5 and STAT1 antibodies versus IgG. IFN, interferon.
Figure 10
Figure 10
DDX5 knockdown reduces antiviral IFN-α effect on HBV replication. (A) Diagram illustrates the workflow of HBV infection using dHepaRG cells; infection with HBV was carried out at moi=500 in the presence of 4% Peg8000, in triplicates. siRNAs (25 nM final concentration) control (siCtrl) or DDX5 (Dharmacon) were transfected on day 8 p.i.; IFN-α added on days 11 and 14 p.i. (B) Quantification of total HBV RNA and pgRNA by qRT-PCR as previously described. Results are from two independent experiments performed in triplicates. *P<0.05. (C) Immunoblots of whole cell extracts (WCE) from HBV-infected cells, with indicated antibodies. Relative intensity (Rel. Int.) is the ratio of STAT1/actin, quantified by ImageJ software. A representative assay is shown from two independent experiments. IFN, interferon; moi, multiplicity of infection; p.i., postinfection.

References

    1. Stark GR, Darnell JE. The JAK-STAT pathway at twenty. Immunity 2012;36:503–14. - PMC - PubMed
    1. Stanifer ML, Pervolaraki K, Boulant S. Differential regulation of type I and type III interferon signaling. Int J Mol Sci 2019;20:20. - PMC - PubMed
    1. Chen K, Liu J, Liu S, et al. Methyltransferase SETD2-Mediated methylation of STAT1 is critical for interferon antiviral activity. Cell 2017;170:492–506. - PubMed
    1. Krämer OH, Knauer SK, Greiner G, et al. A phosphorylation-acetylation switch regulates STAT1 signaling. Genes Dev 2009;23:223–35. - PMC - PubMed
    1. Liu S, Jiang M, Wang W, et al. Nuclear RNF2 inhibits interferon function by promoting K33-linked STAT1 disassociation from DNA. Nat Immunol 2018;19:41–52. - PubMed

MeSH terms