. 2021 May 25;118(21):e2025085118.
doi: 10.1073/pnas.2025085118.

Elementary mechanisms of calmodulin regulation of NaV1.5 producing divergent arrhythmogenic phenotypes

Affiliations

Elementary mechanisms of calmodulin regulation of NaV1.5 producing divergent arrhythmogenic phenotypes

Po Wei Kang et al. Proc Natl Acad Sci U S A. .

Abstract

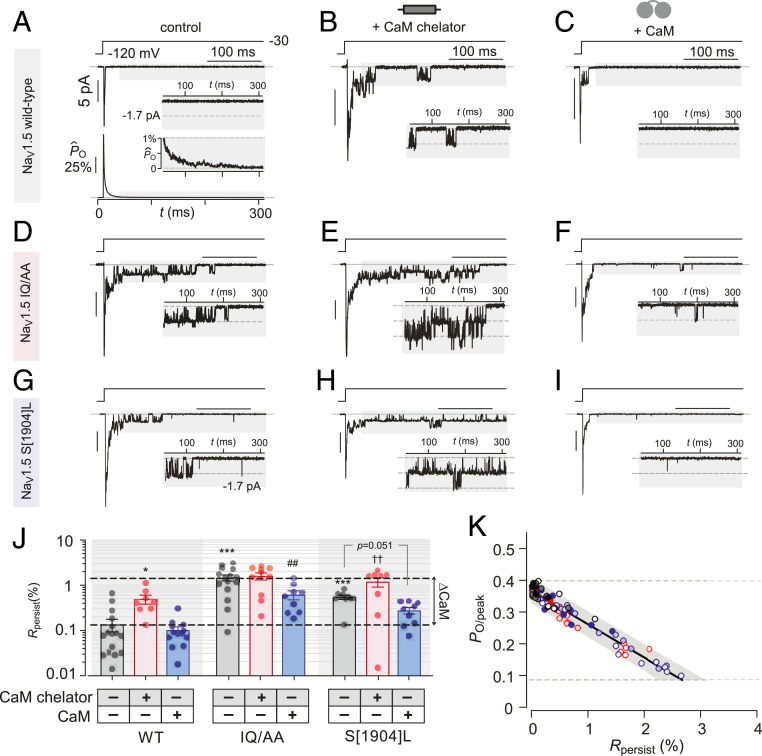
In cardiomyocytes, NaV1.5 channels mediate initiation and fast propagation of action potentials. The Ca2+-binding protein calmodulin (CaM) serves as a de facto subunit of NaV1.5. Genetic studies and atomic structures suggest that this interaction is pathophysiologically critical, as human mutations within the NaV1.5 carboxy-terminus that disrupt CaM binding are linked to distinct forms of life-threatening arrhythmias, including long QT syndrome 3, a "gain-of-function" defect, and Brugada syndrome, a "loss-of-function" phenotype. Yet, how a common disruption in CaM binding engenders divergent effects on NaV1.5 gating is not fully understood, though vital for elucidating arrhythmogenic mechanisms and for developing new therapies. Here, using extensive single-channel analysis, we find that the disruption of Ca2+-free CaM preassociation with NaV1.5 exerts two disparate effects: 1) a decrease in the peak open probability and 2) an increase in persistent NaV openings. Mechanistically, these effects arise from a CaM-dependent switch in the NaV inactivation mechanism. Specifically, CaM-bound channels preferentially inactivate from the open state, while those devoid of CaM exhibit enhanced closed-state inactivation. Further enriching this scheme, for certain mutant NaV1.5, local Ca2+ fluctuations elicit a rapid recruitment of CaM that reverses the increase in persistent Na current, a factor that may promote beat-to-beat variability in late Na current. In all, these findings identify the elementary mechanism of CaM regulation of NaV1.5 and, in so doing, unravel a noncanonical role for CaM in tuning ion channel gating. Furthermore, our results furnish an in-depth molecular framework for understanding complex arrhythmogenic phenotypes of NaV1.5 channelopathies.

Keywords: Brugada syndrome; Nav1.5; calmodulin; ion channels; long QT syndrome.


Conflict of interest statement

The authors declare no competing interest .

Figures

Fig. 1.
Fig. 1.
Absence of dynamic Ca2+/CaM effects on WT NaV1.5 SSI. (A, Left) Structure of NaV1.5 transmembrane domain (6UZ3) (70) juxtaposed with that of NaV1.5 CT–apoCaM complex (4OVN) (28). (Right) Arrhythmia-linked CT mutations highlighted in NaV1.5 CT–apoCaM structure (LQTS3, blue; BrS, magenta; mixed syndrome, purple). (B) Dynamic Ca2+-dependent changes in NaV1.5 SSI probed using Ca2+ photouncaging. Na currents specifying h at ∼100 nM (Left) and ∼4 μM Ca2+ step (Right). (C) Population data for NaV1.5 SSI under low (black, Left) versus high (red, Right) intracellular Ca2+ reveal no differences (P = 0.55, paired t test). Dots and bars are mean ± SEM (n = 8 cells). (D) FRET two-hybrid analysis of Cerulean-tagged apoCaM interaction with various Venus-tagged NaV1.5 CT (WT, black; IQ/AA, red; S[1904]L, blue). Each dot is FRET efficiency measured from a single cell. Solid line fits show 1:1 binding isotherm.
Fig. 2.
Fig. 2.
Disruption of apoCaM preassociation diminishes peak PO of NaV1.5. (A) SSI (h) curve for WT NaV1.5 measured under endogenous (black), low (red), and high (blue) CaM levels. Low CaM levels were attained by overexpressing a CaM chelator. High CaM levels were attained by overexpressing recombinant CaM. (Inset) Voltage protocol. (B and C) Format as in A but for NaV1.5 IQ/AA (B) and S[1904]L (C) mutants. (D) Exemplar traces showing stochastic records of channel openings from a one-channel patch of NaV1.5 WT evoked in response to a depolarizing pulse to −10 mV. Solid line denotes zero-current baseline, and channel openings are downward deflections to the unitary current level (dashed line). (E) Ensemble average PO waveform from a single patch (147 sweeps) reveals a PO/peak ∼0.5. (F) Population PO/peak values are plotted as block dots and bars (mean ± SEM) as a function of the activating test pulse potential (n = 7 patches, 1,768 sweeps/voltage). The black line is the single Boltzmann fit for PO/peak–V relation with parameters: PO,max = 0.48; V1/2 = −36 mV, and slope factor (SF) = 9.5. (GI) Format as in DF but for NaV1.5 IQ/AA. (H) Ensemble PO average shown from a single patch with 120 sweeps. (I) Population data of NaV1.5 IQ/AA PO/peak–V relationship is shown by pale red dots (mean ± SEM, n = 5, 1,088 sweeps/voltage) and red line fit. Boltzmann fit parameters: PO,Max = 0.21; V1/2 = −45 mV; SF = 9.5. Gray line is the WT fit reproduced from F. (J–L) Format as in D–F but for NaV1.5 S[1904]L. (K) Ensemble PO average obtained from 254 sweeps in a single patch. (L) Population data for NaV1.5 S[1904]L PO/peak–V relationship is shown by pale red dots (mean ± SEM, n = 6, 1,365 sweeps/voltage) and red line fit. Boltzmann fit parameters for NaV1.5 S[1904]L: PO,Max = 0.26; V1/2 = −45 mV; SF = 9.5. Gray line is the WT fit reproduced from F. Statistical analysis: two-way ANOVA followed by post hoc Tukey’s multiple comparisons test, **P < 0.01 with WT channels as reference.
Fig. 3.
Fig. 3.
ApoCaM binding tunes maximal PO of mutant NaV1.5 with reduced CaM binding. (A and B) Exemplar stochastic single-channel recordings of NaV1.5 IQ/AA under CaM-overexpressed (A) and CaM-depleted (B) conditions. (C) Ensemble PO average of NaV1.5 IQ/AA from a single patch under CaM-overexpressed (blue, 130 sweeps) and CaM-depleted (red, 276 sweeps) conditions. (D) Population NaV1.5 IQ/AA PO/peak–V relationship under CaM-overexpressed (blue dots and fit, n = 5, 539 sweeps/voltage) and CaM-depleted (red dots and fit, n = 7, 1,249 sweeps/voltage) conditions. Gray is the NaV1.5 IQ/AA fit under endogenous CaM levels reproduced from Fig. 2I. All dots and bars are mean ± SEM. Boltzmann fit parameters for CaM-overexpressed condition (blue): PO,max = 0.45; V1/2 = −38 mV; SF = 9.5. Boltzmann fit parameters for CaM-depleted condition (red): PO,max = 0.23; V1/2 = −40 mV; SF = 9.5. Statistical analysis: two-way ANOVA followed by post hoc Tukey’s multiple comparisons test, ***P < 0.001 comparing the CaM overexpression with the CaM-depleted condition. (E and F) Format as in AD but for NaV1.5 S[1904]L mutant. (G) Ensemble PO average of NaV1.5 S[1904]L from a single patch under CaM-overexpressed (blue, 120 sweeps) and CaM-depleted (red, 218 sweeps) conditions. (H) Population NaV1.5 S[1904]L PO/peak–V relationship under CaM-overexpressed (blue dots and fit, n = 11, 2,496 sweeps/voltage) and CaM-depleted (red dots and fit, n = 8, 1,568 sweeps/voltage) conditions. Gray is the NaV1.5 S[1904]L fit under endogenous CaM levels reproduced from Fig. 2L. Boltzmann fit parameters for CaM-overexpressed condition (blue): PO,Max = 0.5; V1/2 = −43 mV; SF = 9.5. Boltzmann fit parameters for CaM-depleted condition (red): PO,Max = 0.18; V1/2 = −45 mV; SF = 9.5. Statistical analysis: two-way ANOVA followed by post hoc Tukey’s multiple comparisons test, **P < 0.01 and ***P < 0.001 comparing the CaM overexpression with the CaM-depleted condition.
Fig. 4.
Fig. 4.
Elementary mechanisms underlying CaM regulation of NaV1.5. (A and B) FL distributions for NaV1.5 WT (gray shaded area) and NaV1.5 IQ/AA mutant under CaM-overexpressed (pale blue shaded area) and CaM-depleted (rose shaded area) conditions. FL denotes the probability that the first opening occurred at time < t. Solid lines are fits of FL distributions generated by the model shown in Fig. 4I. The difference in FL distributions for NaV1.5 IQ/AA at low versus high CaM levels are statistically significant (P < 0.001, Kolmogorov–Smirnov [KS] test). (C and D) Histograms of OD distribution which correspond to the time spent in the open state for WT (gray shaded area, C) and IQ/AA under low (rose shaded area, D) and high (pale blue shaded area, D) CaM conditions. Solid lines are fits of OD distributions generated by the model shown in Fig. 4I. The OD distribution of IQ/AA is significantly prolonged under low CaM levels compared to CaM overexpression (D, P < 0.001, KS test). (E and F) Distribution of the number of openings per sweep for WT (black) and IQ/AA mutant channels at low (red) and high (blue) levels of ambient CaM. ***P < 0.001, test of proportion for comparing fraction of blank sweeps. (G and H) Conditional open probability (POO(t)) for WT (gray shaded area) and IQ/AA at low (rose shaded area) or high (pale blue shaded area) CaM levels. Solid lines are reproduction of the fits of OD distributions in C and D. For NaV1.5 IQ/AA, POO(t), distributions at low versus high CaM are statistically different (P < 0.001, KS test). (I) Summary of the effect of CaM on NaV1.5 gating. Absent CaM, channels preferentially inactivate from the closed state. Upon binding CaM, inactivation proceeds preferentially from the open state (α: rate of transition from the closed to open state, β: rate of transition from the open to closed state, kOI: rate of inactivation from the open state, kCI: rate of inactivation from the closed state, kOC: rate of channel closure, and kCO: rate of channel opening).
Fig. 5.
Fig. 5.
ApoCaM interaction with NaV1.5 tunes likelihood for persistent channel openings. (A, Top) Representative multichannel record from NaV1.5 WT shows rapid activation and inactivation followed by rare openings in the late phase following 50 ms of depolarization (gray shaded region). (Inset) Enlarged late phase to better visualize NaV1.5 openings. (Bottom) Normalized ensemble average open probability (n = 16, 875 sweeps). (Inset) Enlarged normalized open probability in the late phase. (B and C) Format as in A Top but for NaV1.5 WT channels recorded under CaM-depleted (B) and CaM-overexpressed (C) conditions. (DI) Format as in AC but for NaV1.5 IQ/AA (DF) and S[1904]L (GI) mutants. (J) Quantification and population data for persistent channel openings for NaV1.5 WT, IQ/AA, and S[1904]L under different CaM concentrations (AI). For each condition, a normalized ensemble open probability P^O is calculated by averaging many sweeps (SI Appendix, Fig. S7). Rpersist is the average open probability P^O in the late phase (gray shaded regions in AI) normalized by the peak P^O. Each bar and error, mean ± SEM. Statistical analysis: one-way ANOVA followed by Tukey multiple comparisons test. ***P < 0.001, **P < 0.01, *P < 0.05 compared to WT at endogenous CaM levels; ##P < 0.01 versus IQ/AA at endogenous CaM level; and ††P < 0.01 when compared to S1904L at endogenous CaM levels. (K) Correlation of Rpersist versus PO/peak under different CaM concentrations shows a linear relationship.
Fig. 6.
Fig. 6.
Dynamic Ca2+ fluctuations tune persistent NaV channel openings. (A) FRET two-hybrid analysis probes the interaction of Venus-tagged NaV1.5 CT with Cerulean-tagged CaM at high Ca2+ levels. Black dots and fit, WT; red dots and fit, IQ/AA mutant; blue dots and fit, S[1904]L mutant. (B) Bar graph summary compares Ka,EFF = 1/Kd,EFF for Ca2+ versus apoCaM binding to WT NaV1.5 as well as IQ/AA and S[1904]L mutant. (C) Exemplar multichannel stochastic record from cell-attached recordings of NaV1.5 WT coexpressed with CaV2.1. NaV1.5 openings are evoked using the −35 mV voltage pulse. Ensuing +15 mV voltage pulse elicits Ca2+ channel openings (rose shaded area). A subsequent pulse to −35 mV is used to identify Ca2+-dependent changes in persistent NaV channel openings. (D) Normalized ensemble average P^O waveform is computed from 293 sweeps (six patches). A comparison of the P^O waveform before (black) and after (red) Ca2+ pulse reveals minimal differences in the late Na current. (EH) Exemplar multichannel recordings and ensemble average P^O waveforms of NaV1.5 IQ/AA (E and F) or S[1904]L (G and H) coexpressed with CaV2.1. Format same as C and D. Data obtained from 342 sweeps (seven patches) for NaV1.5 IQ/AA and 264 sweeps (seven patches). (I) Paired dot plot summarizes changes in Rpersist before (black dot, gray bar) and after (red dot, rose bar) Ca2+ influx. Only the IQ/AA mutant showed a consistent reduction in the late current following Ca2+ entry (**P < 0.01 by paired t test).
Fig. 7.
Fig. 7.
In-depth analysis suggests a distinct open state associated with late Na current. (A) Pale blue shaded area shows the conditional OD histogram for NaV1.5 WT channel opening in the late phase (after 50 ms depolarization), which follows a multiexponential decay. The gray solid line is the OD fit for the WT channel opening in the early phase (reproduced from SI Appendix, Fig. S4E). The red solid line is a scaled OD fit for the IFM/IQM inactivation-deficient mutant opening (B). The blue solid line is a fit for the late-phase conditional OD by a weighted sum of the early phase and IFM/IQM OD distributions. (B) OD histogram (pale red shaded area) and fit (solid red line) of the IFM/IQM mutant opening. (CF) Format as in A but for NaV1.5 IQ/AA or S[1904]L mutants at both low and high ambient CaM levels. Gray solid lines are OD fits for the respective mutant channel openings in the early phase (reproduced from SI Appendix, Figs. S4F and S5E). In all cases, the conditional OD distributions for late channel openings are multiexponential, with the slow component matching the OD distribution of inactivation-deficient (IFM/IQM) channels. (G) Summary of multifaceted modulation of NaV1.5 by CaM and potential molecular conformational changes. With CaM bound, the carboxy-terminus (CT) interacts with the III-IV linker and prevents premature translocation for the “IFM” inactivation particle to its receptor site near the S6 domain. Following voltage depolarization and channel opening, the III-IV linker may release from the CT and thereby trigger channel inactivation. Devoid of apoCaM, allosteric changes may cause the III-IV linker to be released from the CT. This change could result in premature translocation of the “IFM” motif to the S6 receptor site, manifesting as enhanced closed-state inactivation. Alternatively, with a low likelihood, the “IFM” motif may altogether fail to reach its receptor site, resulting in persistent channel openings.

Similar articles

Cited by

References

    1. Hille B., Ionic Channels of Excitable Membranes (Sinauer Associates, Sunderland, MA, 1984), pp. 226–248.
    1. Catterall W. A., Lenaeus M. J., Gamal El-Din T. M., Structure and pharmacology of voltage-gated sodium and calcium channels. Annu. Rev. Pharmacol. Toxicol. 60, 133–154 (2020). - PubMed
    1. Zimmer T., Surber R., SCN5A channelopathies–An update on mutations and mechanisms. Prog. Biophys. Mol. Biol. 98, 120–136 (2008). - PubMed
    1. Abriel H., Rougier J. S., Jalife J., Ion channel macromolecular complexes in cardiomyocytes: Roles in sudden cardiac death. Circ. Res. 116, 1971–1988 (2015). - PMC - PubMed
    1. Wan E., et al. ., Aberrant sodium influx causes cardiomyopathy and atrial fibrillation in mice. J. Clin. Invest. 126, 112–122 (2016). - PMC - PubMed

Publication types

MeSH terms

LinkOut - more resources