. 2021 May 21;12(1):3028.
doi: 10.1038/s41467-021-23187-9.

Cytoplasmic FUS triggers early behavioral alterations linked to cortical neuronal hyperactivity and inhibitory synaptic defects

Affiliations

Cytoplasmic FUS triggers early behavioral alterations linked to cortical neuronal hyperactivity and inhibitory synaptic defects

Jelena Scekic-Zahirovic et al. Nat Commun. .

Abstract

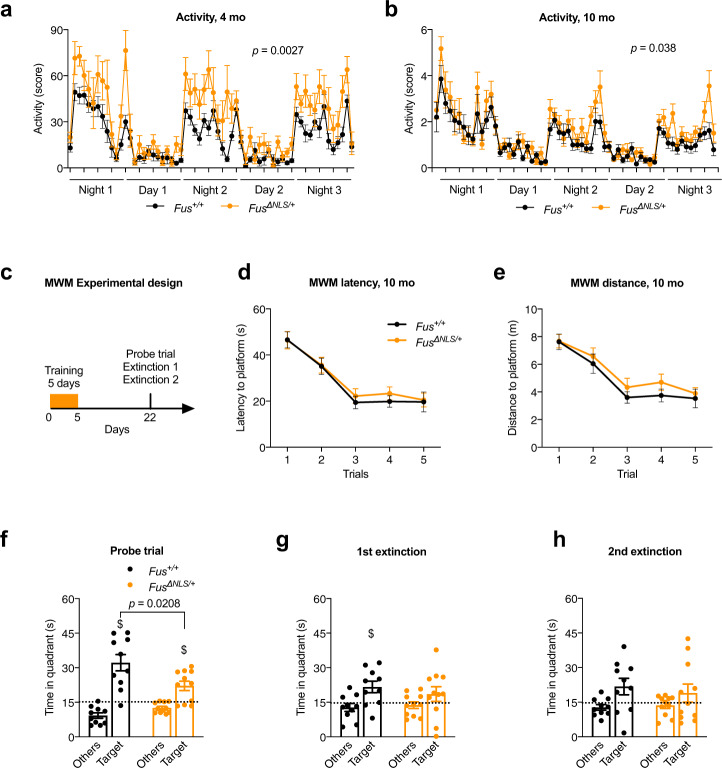
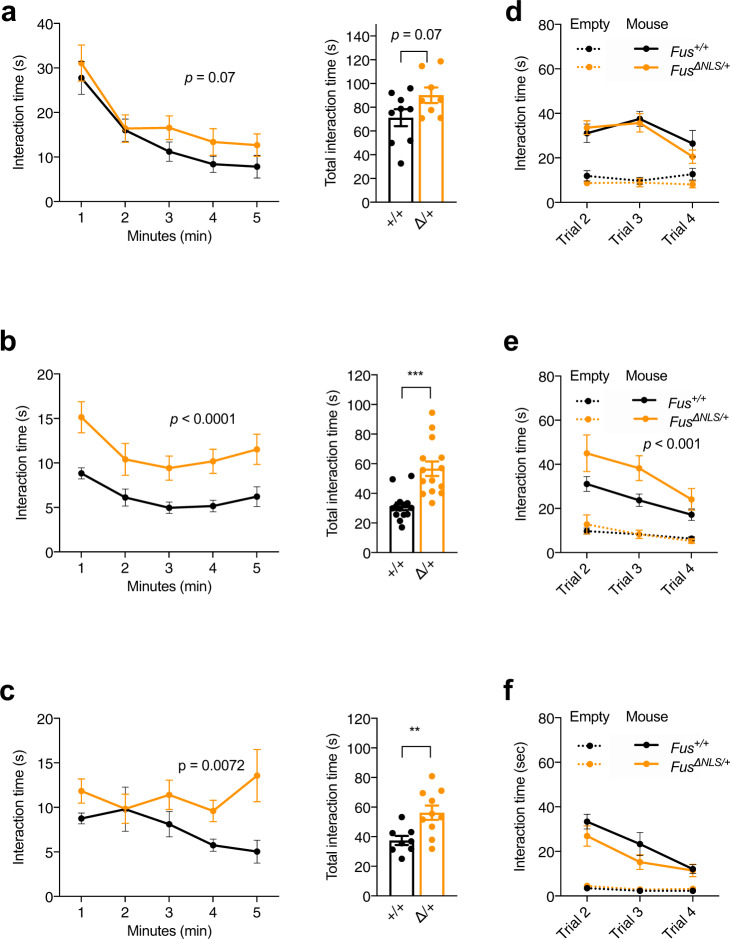
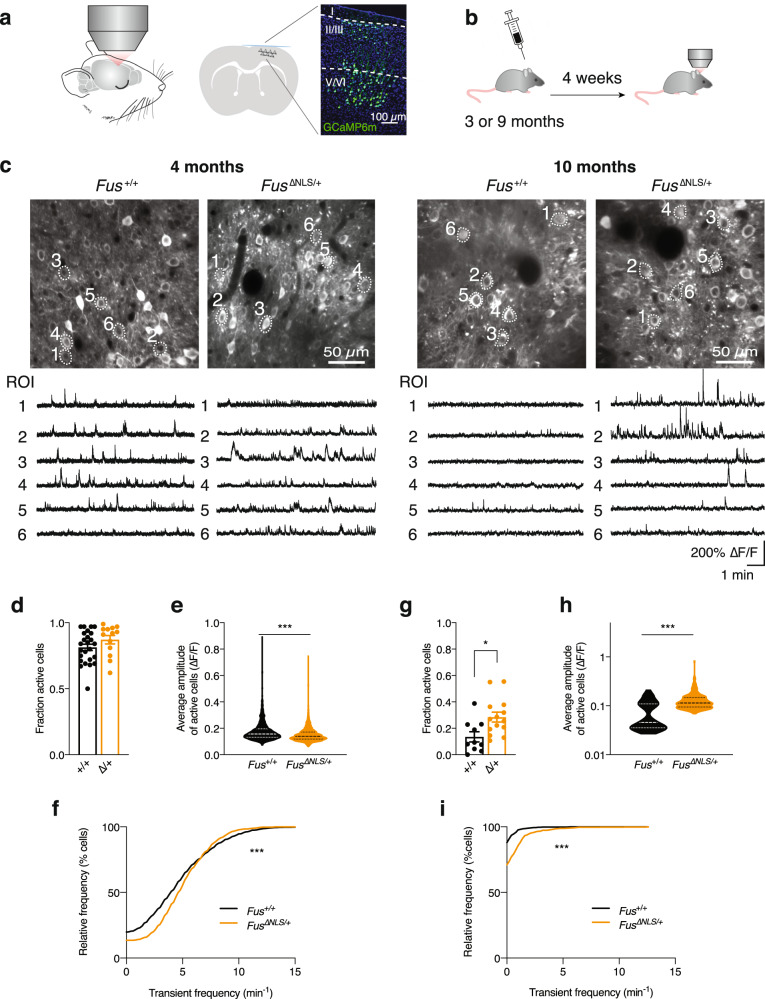
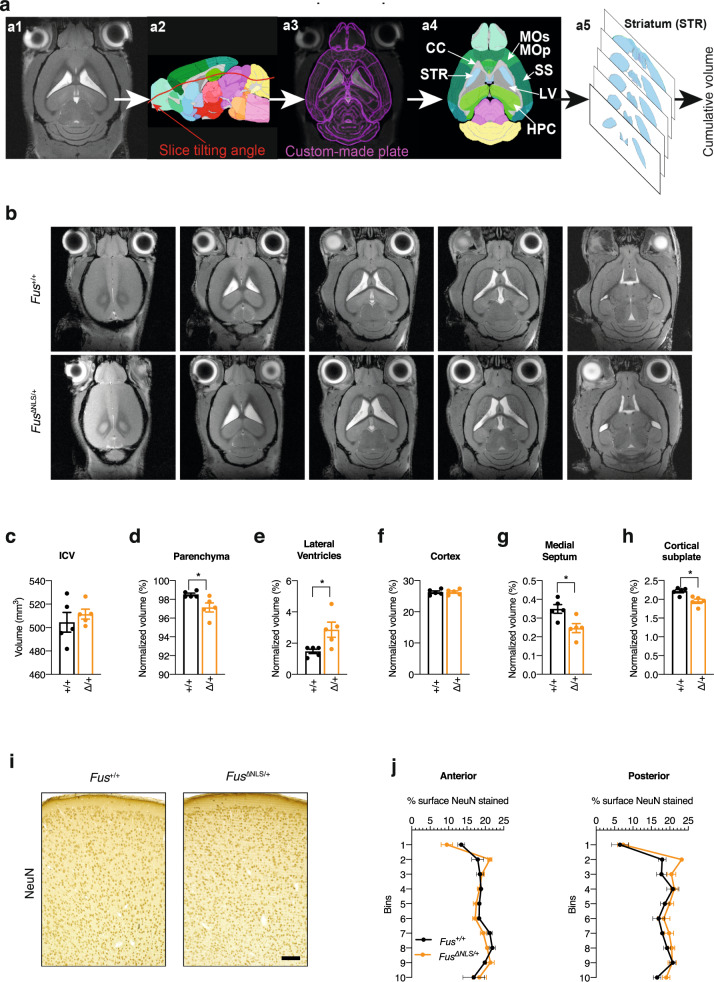
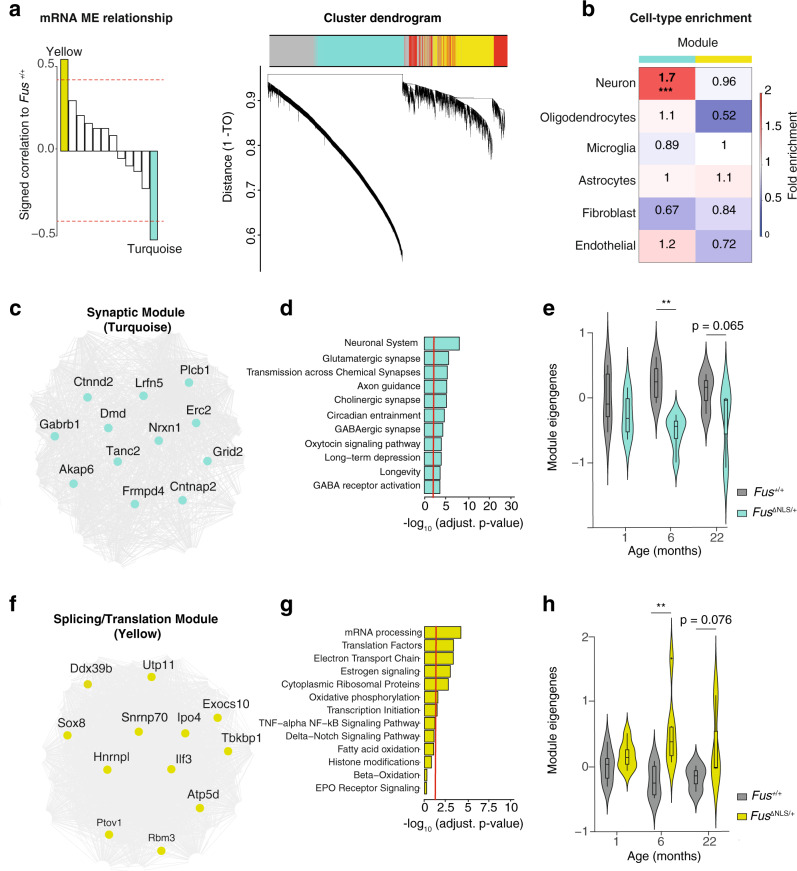
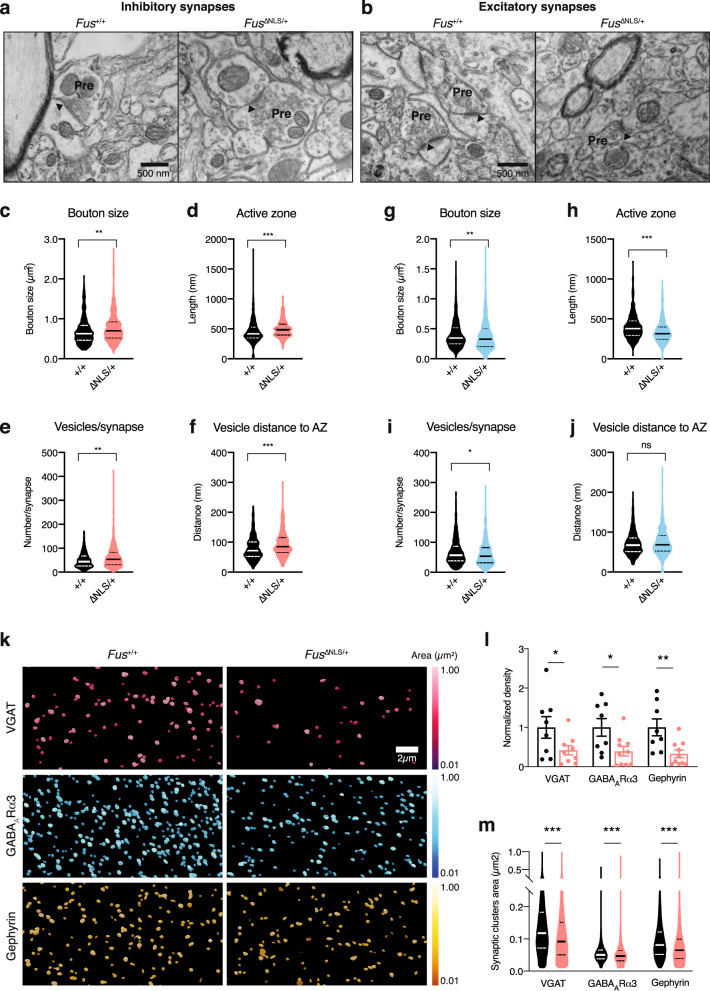
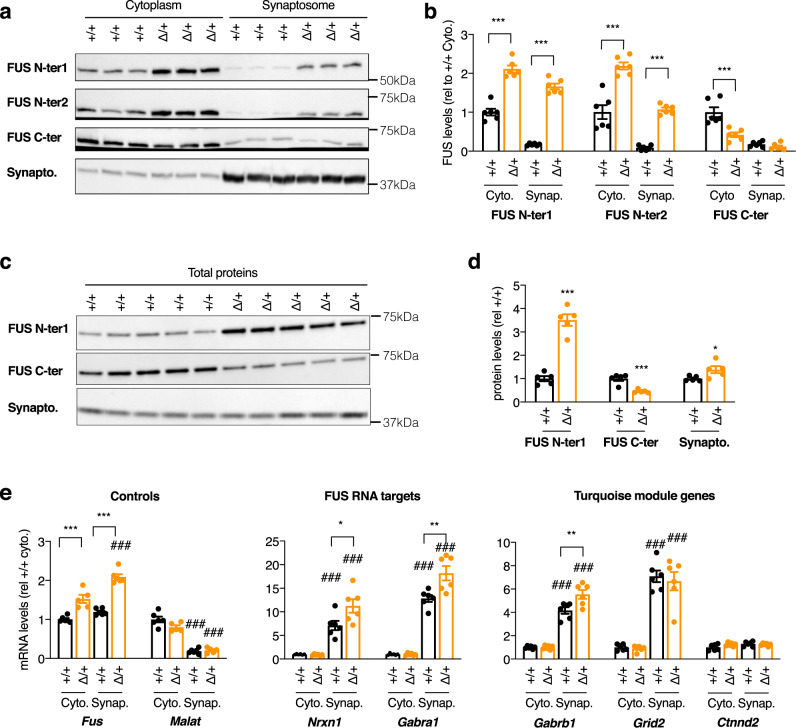
Gene mutations causing cytoplasmic mislocalization of the RNA-binding protein FUS lead to severe forms of amyotrophic lateral sclerosis (ALS). Cytoplasmic accumulation of FUS is also observed in other diseases, with unknown consequences. Here, we show that cytoplasmic mislocalization of FUS drives behavioral abnormalities in knock-in mice, including locomotor hyperactivity and alterations in social interactions, in the absence of widespread neuronal loss. Mechanistically, we identified a progressive increase in neuronal activity in the frontal cortex of Fus knock-in mice in vivo, associated with altered synaptic gene expression. Synaptic ultrastructural and morphological defects were more pronounced in inhibitory than excitatory synapses and associated with increased synaptosomal levels of FUS and its RNA targets. Thus, cytoplasmic FUS triggers synaptic deficits, which is leading to increased neuronal activity in frontal cortex and causing related behavioral phenotypes. These results indicate that FUS mislocalization may trigger deleterious phenotypes beyond motor neuron impairment in ALS, likely relevant also for other neurodegenerative diseases characterized by FUS mislocalization.


Conflict of interest statement

The authors declare no competing interests.

Figures

Fig. 1
Fig. 1. FusΔNLS/+ mice display increased nocturnal spontaneous locomotor activity and cognitive defects.
a, b Line graphs represent mice home cage activity–actimetry over three consecutive days at 4 months (a) and 10 months (b) of Fus+/+ (black) and FusΔNLS/+ (orange) male mice N = 11 for Fus+/+ and N = 10 for FusΔNLS/+ mice at 4 months and N = 15 for Fus+/+ and N = 14 for FusΔNLS/+ mice at 10 months. Repeated measures Two-way ANOVA followed by Sidak for multiple comparisons, with time and genotype as variables. P = 0.0027 at 4 months and p = 0.038 at 10 months for genotype effect. Data are presented as mean ± SEM values of activity score per hour. c Schematic illustration of the Morris water maze (MWM) experimental strategy (paradigm). Mice were subjected to a five-day training period and tested for spatial memory retention in a probe trial (60 seconds) 18 days after the last acquisition. The probe trial was then followed by two extinction tests, performed at 2 h intervals. d, e Line graphs represent latency (in seconds) (d) and total distance swam (in meters) (e) to find the hidden platform during acquisition of 10-months-old Fus+/+ (black) and FusΔNLS/+ (orange) male mice. Both genotypes improved similarly their performance between day 1 and 5. N = 10 for Fus+/+ and N = 11 for FusΔNLS/+ mice. Data are presented as mean ± SEM values of four trials per day of training. A two-way repeated measure analysis of variance (ANOVA) (genotype * days) was conducted to determine the effect of genotype on learning over time. No significant effect of genotype is observed. f Bar graphs represent the time spent in the target quadrant (Target) and the average of the time spent in the other three quadrants (Others) during probe trial. Dashed line indicates chance level (15 seconds per quadrant; i.e., 25%). N = 10 for Fus+/+ and N = 11 for FusΔNLS/+ mice. Data are presented as mean ± SEM. Both genotypes were significantly above random but FusΔNLS/+ mice performed significantly worse than Fus+/+ littermates ($, p < 0.01, One sample t-test was used to compare to a chance level, Target quadrant: p = 0.0008 for Fus+/+ and p = 0.006 for FusΔNLS/+). Genotype comparison was made using One-way ANOVA; F(1,19) = 6.33, p = 0.0208. g, h Bar graphs represent the time spent in quadrants (Target vs Others) during the first (g) and the second (h) extinction test ($, p < 0.05 vs chance levels). One-way ANOVA for genotype effect (F(1,19) = 0.56, p = 0.46) (g), (F(1,19) = 0.27, p = 0.6) (h) and One sample t-test was used to compare to a chance level, (Target quadrant: p = 0.025 for Fus+/+ and p = 0.22 for FusΔNLS/+) (g), (Target quadrant: p = 0.08 for Fus+/+ and p = 0.09 for FusΔNLS/+) (h). N = 10 for Fus+/+ and N = 11 for FusΔNLS/+ mice, with same mice as panel f. Data are presented as mean ± SEM. Source data are provided as a Source Data file.
Fig. 2
Fig. 2. Social behavior abnormalities in FusΔNLS/+ mice.
ac Line and bar graphs represent interaction time between resident (test) and intruder mice exclusively initiated by resident mouse in one-minute intervals (line graphs, on the left) or over the total time (bar graphs, on the right) during a 5 min resident-intruder test in home cage for 4 (a), 10 (b), and 22 (c) months-old Fus+/+ (black) and FusΔNLS/+ (orange) male mice. Note that, young FusΔNLS/+ mice demonstrated a trend towards an increased social interest for intruder mouse (a) while older mice interacted with intruders significantly longer then Fus+/+ (b, c) showing an age-dependent impairment of social behavior–disinhibition. All values are represented as mean ± SEM. At 4 months, N = 9 for Fus+/+ and N = 8 for FusΔNLS/+ mice; At 10 months, N = 14 for Fus+/+ and N = 14 for FusΔNLS/+ mice; At 22 months, N = 8 for Fus+/+ and N = 10 for FusΔNLS/+ mice. Two-way repeated measures ANOVA followed by Sidak post-hoc test (p = 0.07 (4 months), p < 0.001 (10 months), and p = 0.007 (22 months) for genotype.effect); Two-sided Unpaired Student’s t-test for total time p = 0.07 (4 months), p < 0.001 (10 months), and p = 0.007 (22 months)). d, f Line graphs represent sociability in the three-chamber test measured as interaction time with novel mice across three trials for Fus+/+(black) and FusΔNLS/+ (orange) male mice at 4 (d), 10 (e), and 22 (f) months of age. Time exploring an empty cage (object) across trials is represented as dashed lines. At 4 months, N = 9 for Fus+/+ and N = 8 for FusΔNLS/+ mice; At 10 months, N = 14 for Fus+/+ and N = 14 for FusΔNLS/+ mice; At 22 months, N = 8 for Fus+/+ and N = 9 for FusΔNLS/+ mice. Data are presented as mean ± SEM. Three-way ANOVA with Newman Keuls post-hoc test for multiple comparisons, p = ns (4 months), p < 0.001 (10 months) and p = ns (22 months) for genotype effect). Source data are provided as a Source Data file.
Fig. 3
Fig. 3. Assessment of neuronal activity in FusΔNLS/+ mice in vivo.
a Neuronal activity was monitored in frontal cortex of anesthetized mice. Scheme of coronal section, indicating the expression of GCaMP6s in cortex assessed through a cranial window. Magnified view of imaged cortical area demonstrates neuronal expression of GCaMP (green) across all cortical layers. b Timeline of experiments. Male and female mice were injected with AAV9-syn-jGCaMP7s (at 3 months of age) or AAV2/1-hsyn-GCaMP6m (at 9 months of age) into frontal cortex and implanted with a cranial window. In vivo imaging began 4 weeks after implantation. c Representative examples (average projections) of field of views (FOV) imaged in Fus+/+ and FusΔNLS/+ mice at 4 months (N = 8 Fus+/+ mice and N = 3 FusΔNLS/+ mice, left) and at 10 months (N = 5 Fus+/+ mice and N = 6 FusΔNLS/+ mice, right) are shown together with fluorescence calcium traces of selected regions of interest (ROIs). d The fraction of active cells per FOV was not affected in 4-month-old FusΔNLS/+ mice. N = 13 FOVs in 3 FusΔNLS/+ and N = 25 FOVs in 8 Fus+/+ mice. Data are presented as mean ± SEM p = 0.1627, Two-sided Unpaired Student’s t-test. e, f The calcium transient frequencies (e) were increased while the average transient amplitudes (f) were decreased in FusΔNLS/+ mice. N = 1107 ROIs in 3 FusΔNLS/+ and N = 2264 ROIs in 8 Fus+/+, superimposed by the median (e). Kolmogorov–Smirnov test, ***p < 0.0001 for both panel e and f. gi The fraction of active cells per FOV (g) as well as (h) the frequencies and (i) the average amplitudes of calcium transients of each ROI were increased in 10-month-old FusΔNLS/+ mice. Data are individual FOVs (g; N = 14 FOVs in 6 FusΔNLS/+ and N = 10 FOVs in 5 Fus+/+ mice) or individual ROIs (h, i; N = 855 ROIs in 6 FusΔNLS/+ and N = 631 ROIs in 5 Fus+/+ mice) superimposed by the mean ± SEM (g) or the median (h, i). panel g: Two-tailed Unpaired Student’s t-test, *p = 0.0126; panel h and i: Kolmogorov–Smirnov test, ***p < 0.0001 for both panels. Source data are provided as a Source Data file.
Fig. 4
Fig. 4. Structural and histological brain analysis of Fus+/+ and FusΔNLS/+ mice.
a Representation of the workflow used to determine volumes of corresponding brain structures from MRI slices per each mouse by the custom-made Fiji macro plugin (upper row). b Representative MRI slice images of Fus+/+ (upper row) and FusΔNLS/+ (lower row) male mice. c–h Bar graph showing intracranial volume (ICV) (c), normalized volume of the brain parenchyma (d), of lateral ventricles (e), cortex (f), medial septum (g), and cortical subplate (h) in FusΔNLS/+ vs Fus+/+ mice. For panels ch, N = 5 for Fus+/+ and N = 5 for FusΔNLS/+ mice. Data are presented as mean ± SEM. Two-tailed Unpaired Student’s t-test, c: p = 0.4838; d: p = 0.0249; e: p = 0.0249; f: 0.9489; g: p = 0.0151; h: p = 0.0051. i Representative image of NeuN immunohistochemistry at 22 months of age in Fus+/+ (N = 3 mice) or Fus∆NLS/+ (N = 5) male mice in the anterior region of the M1/M2 cerebral cortex. Scale bar: 100 µm. j Distribution of NeuN+ neurons in Fus+/+ (black) or Fus∆NLS/+ (orange) male mice, in anterior and posterior regions of the M1/M2 cerebral cortex. N = 3 for Fus+/+ and N = 5 for FusΔNLS/+ mice. Source data are provided as a Source Data file.
Fig. 5
Fig. 5. mRNA coexpression network analysis pinpoints defects in inhibitory and excitatory synapses in FusΔNLS/+ mice.
a Signed association (Pearson correlation) of the mRNA MEs with transgenic condition. Modules with positive values indicate increased expression in transgenic mice; modules with negative values indicate decreased expression in transgenic mice. The red dotted lines indicate Bonferroni-corrected P < 0.05 for multiple comparisons (n = 12 modules, n = 16 mice per group). b Cell-type enrichment of modules (average n = 200 genes) using mouse genes in mRNA modules (Fisher’s two-tailed exact test, ***FDR = 2 × 10−5). c Coexpression network plot of the synaptic (turquoise) module. The top 12 hub genes are indicated by name. d Gene ontology term enrichment of the synaptic module using 1791 synaptic module genes. e Trajectory of the synaptic module in the cortex of FusΔNLS/+ mice across time. Boxplot show median and quartile distributions, the upper and lower lines representing the 75th and 25th percentiles, respectively. Two-way ANOVA, F(1,24) = 14.55, p = 0.0008; n = 4–6 mice per group. f Coexpression network plot of the splicing/translation module. The top 12 hub genes are indicated by gene name. g GO term enrichment of the splicing/translation module using 1112 splicing/translation module genes. h Trajectory of the splicing/translation module in the cortex of FusΔNLS/+mice across time. Boxplot show median and quartile distributions, the upper and lower lines representing the 75th and 25th percentiles, respectively. Two-way ANOVA, F(1,24) = 11.92, p = 0.002; n = 4–6 mice per group. The center line represents the median.
Fig. 6
Fig. 6. Defects in synapses in 22-months-old FusΔNLS/+ mice.
a, b Representative image of transmission electron microscopy in Fus+/+ or Fus∆NLS/+ layer II/III of the motor cortex at 22 months of age showing inhibitory synapses (a) (as containing ≥1 mitochondrion on each side of the synapse) and excitatory synapses (b). Pre: presynaptic compartment; active zone is shown with an arrowhead. N = 4 Fus+/+ mice (1 male and 3 females), and N = 4 FusΔNLS/+ mice (1 male and 3 females) have been analyzed. cf Violin plot showing the distribution of bouton sizes (c), the length of active zones (d), the number of vesicles per synapse (e), and the distance of individual vesicles to the active zone (f) in inhibitory synapses of Fus+/+ (black) or Fus∆NLS/+ (orange) mice. For panels cf, N = 379 synapses from 1 male and 3 female Fus+/+ mice and N = 387 synapses from 1 male and 3 female Fus∆NLS/+ mice were analyzed. Kolmogorov–Smirnov test. c: p = 0.0016; d: p < 0.0001; e: p = 0.0010; f: p < 0.0001. gj Violin plot showing the distribution of bouton size (g), the length of active zone (h), the number of vesicles per synapse (i), and the distance of individual vesicles to the active zone (j) in excitatory synapses of Fus+/+ (black) or Fus∆NLS/+ (cyan) mice. For panels gj, N = 463 synapses from 1 male and 3 female Fus+/+ mice and N = 490 synapses from 1 male and 3 female Fus∆NLS/+ mice were analyzed. Kolmogorov–Smirnov test. g: p = 0.0038; h: p < 0.0001; i: p = 0.0362; j: p = 0.2182. k Representative images of GABAARα3, Gephyrin and VGAT intensity in 22-months male mice, coded by area size (Imaris). N = 3 Fus+/+ mice and N = 4 FusΔNLS/+ mice have been analyzed. l Bar graphs representing the density analysis for VGAT, GABAARα3, and Gephyrin comparing Fus+/+ vs Fus∆NLS/+ mice. (Fus+/+ vs Fus∆NLS/+, Mann–Whitney test, VGAT, p = 0.0464; GABAARα3, p = 0.0217; Gephyrin, p = 0.0043). N = 8 FOVs from 3 Fus+/+ mice and N = 9 FOVs from 4 Fus∆NLS/+ mice were analyzed for VGAT; N = 8 FOVs from 3 Fus+/+ mice and N = 10 FOVs from 4 Fus∆NLS/+ mice were analyzed for GABAARα3 and Gephyrin. Data are presented as mean ± SEM. Mann–Whitney, One tailed, VGAT: p = 0.0464; GABAARα3: p = 0.0217; Gephyrin: p = 0.0043. m Violin plot representing the analysis of the clusters size for VGAT, GABAARα3, and Gephyrin comparing Fus+/+ vs Fus∆NLS/+ mice. N = 142,416 synapses from 3 Fus+/+ mice and N = 115,151 synapses from 4 Fus∆NLS/+ mice were analyzed for VGAT; N = 202,302 synapses from 3 Fus+/+ mice and N = 99,464 synapses from 4 Fus∆NLS/+ mice were analyzed for GABAARα3; N = 169,036 synapses from 3 Fus+/+ mice and N = 68,422 synapses from 4 Fus∆NLS/+ mice were analyzed for Gephyrin. Kolmogorov–Smirnov test. VGAT: p < 0.0001; GABAARα3: p < 0.0001; Gephyrin: p < 0.0001. Source data are provided as a Source Data file.
Fig. 7
Fig. 7. FUS accumulates in synaptosomes of FusΔNLS/+ mice and alters synaptosomal levels of a subset of its targets.
a, b Representative western blot images (a) and respective quantifications (b) of cytoplasmic (a, left) or synaptosome (a, right) extracts from Fus+/+ (+/+) or Fus∆NLS/+ (∆/+) mice (4 months of age,) using two antibodies recognizing the N-terminal part of the FUS protein (FUS N-ter1 and FUS N-ter2), the C-terminal part of FUS (encoding the NLS, FUS C-ter) or synaptophysin protein to show enrichment in synaptic proteins in the synaptosome fraction. N = 6 Fus+/+ mice and N = 6 Fus∆NLS/+ mice were analyzed. Data are presented as mean ± SEM. One-Way ANOVA with Tukey post-hoc test. ***p < 0.0001 Please note that the FUS western blots were run on independent gels, to avoid stripping and reprobing on the same membrane for the same protein. Each of these gels were controlled for equal loading using StainFree markers, that are provided in the source data. c, d Representative western blot images (c) and respective quantifications (d) of total extracts (c) from Fus+/+ (+/+) or Fus∆NLS/+ (∆/+) mice (4 months of age,) using the same antibodies as in panel a. N = 5 Fus+/+ mice and N = 5 Fus∆NLS/+ mice were analyzed. Data are presented as mean ± SEM. Two-tailed Unpaired Student’s t-test. N-ter1: p < 0.0001; C-ter: p-value: p = 0.0006; Synaptophysin: p = 0.0411. e mRNA levels of the indicated genes in RNAs extracted from cytoplasmic (Cyto.) or synaptosome (Synap.) extracts from Fus+/+ (+/+) or Fus∆NLS/+ (∆/+) frontal cortex from 4-months-old female mice as assessed using RT-qPCR. N = 6 Fus+/+ mice and N = 5 Fus∆NLS/+ mice were analyzed. Data are presented as mean ± SEM. Genes are grouped by categories (controls, established FUS RNA targets, and genes belonging to the Turquoise module). All quantifications are presented relative to the +/+ cytoplasmic RNA levels set to 1. One-way ANOVA with Tukey post-hoc test. Fus: ***p < 0.0001 vs corresponding wild-type fraction; ###p < 0.0001 vs corresponding cytoplasmic fraction of the same genotype. Malat: ###p = 0.0001 vs corresponding cytoplasmic fraction of the same genotype. Nrxn1 *p = 0.0140 vs corresponding wild-type fraction; ###p < 0.0001 vs corresponding cytoplasmic fraction of the same genotype. Gabra1: **p = 0.0012 vs corresponding wild-type fraction; ###p < 0.0001 vs corresponding cytoplasmic fraction of the same genotype. Gabrb1: **p = 0.0029 vs corresponding wild-type fraction; ###p < 0.0001 vs corresponding cytoplasmic fraction of the same genotype. Grid2: ###p < 0.0001 vs corresponding cytoplasmic fraction of the same genotype. Ctnnd2: no significant differences observed (p > 0.05). Source data are provided as a Source Data file.

Similar articles

Cited by

References

    1. Taylor JP, Brown RH, Jr., Cleveland DW. Decoding ALS: from genes to mechanism. Nature. 2016;539:197–206. doi: 10.1038/nature20413. - DOI - PMC - PubMed
    1. Brown RH, Jr., Al-Chalabi A. Amyotrophic lateral sclerosis. N. Engl. J. Med. 2017;377:162–172. doi: 10.1056/NEJMra1603471. - DOI - PubMed
    1. van Es MA, et al. Amyotrophic lateral sclerosis. Lancet. 2017;390:2084–2098. doi: 10.1016/S0140-6736(17)31287-4. - DOI - PubMed
    1. Dormann D, Haass C. TDP-43 and FUS: a nuclear affair. Trends Neurosci. 2011;34:339–348. doi: 10.1016/j.tins.2011.05.002. - DOI - PubMed
    1. Dormann D, Haass C. Fused in sarcoma (FUS): an oncogene goes awry in neurodegeneration. Mol. Cell Neurosci. 2013;56:475–486. doi: 10.1016/j.mcn.2013.03.006. - DOI - PubMed

Publication types