. 2021 May 21;12(1):3005.
doi: 10.1038/s41467-021-22782-0.

Qki activates Srebp2-mediated cholesterol biosynthesis for maintenance of eye lens transparency

Affiliations

Qki activates Srebp2-mediated cholesterol biosynthesis for maintenance of eye lens transparency

Seula Shin et al. Nat Commun. .

Abstract

Defective cholesterol biosynthesis in eye lens cells is often associated with cataracts; however, how genes involved in cholesterol biosynthesis are regulated in lens cells remains unclear. Here, we show that Quaking (Qki) is required for the transcriptional activation of genes involved in cholesterol biosynthesis in the eye lens. At the transcriptome level, lens-specific Qki-deficient mice present downregulation of genes associated with the cholesterol biosynthesis pathway, resulting in a significant reduction of total cholesterol level in the eye lens. Mice with Qki depletion in lens epithelium display progressive accumulation of protein aggregates, eventually leading to cataracts. Notably, these defects are attenuated by topical sterol administration. Mechanistically, we demonstrate that Qki enhances cholesterol biosynthesis by recruiting Srebp2 and Pol II in the promoter regions of cholesterol biosynthesis genes. Supporting its function as a transcription co-activator, we show that Qki directly interacts with single-stranded DNA. In conclusion, we propose that Qki-Srebp2-mediated cholesterol biosynthesis is essential for maintaining the cholesterol level that protects lens from cataract development.


Conflict of interest statement

The authors declare no competing interests.

Figures

Fig. 1
Fig. 1. Deletion of Qk in eye lens cells leads to cataracts.
a Representative immunofluorescent stains of lens cells in paraffin-embedded sections of ocular tissue from control (Ctrl) and Qk-iCKO mice for GFP (green) and Qki-5 (red) (scale bar: 50 μm) at P19. DAPI (blue): nuclei. Schematic at the far right depicting the morphological impairment of eye lens structure upon Qki loss in Qk-iCKO mice compared to the control mice. b Quantification of GFP+Qki5+ cells among all GFP+ cells in the eye lens tissue represented in a. n = 3 mice/group. The results are presented as means with standard deviation (SD). p = 0.0000001090. ****p < 0.0001 (two-tailed unpaired t-test). c Representative immunofluorescent stains of lens cells in paraffin-embedded sections of ocular tissue from control and Qk-iCKO mice for GFP (green) and AQP0 (red) (scale bar: 50 μm) at P19. DAPI (blue): nuclei. d Representative images of eyes and eye lenses isolated from Ctrl and Qk-iCKO mice at early (P19) and late (P30) timepoints. Scale bar: 0.5 mm. e RIPA-soluble fractions of protein lysates from the isolated lenses of Ctrl and Qk-iCKO mice at early (P19) and late (P30) timepoints visualized using silver staining. f Immunoblots of lenses isolated from Ctrl (n = 3) and Qk-iCKO (n = 3) mice at P19 and P30 for detection of the proteostatic stress markers heat shock protein 90 (Hsp90) and p62. β-actin and Ponceau S: loading control. g Aggregates extracted from Qk-iCKO lenses (red circle) dissolved in 8 M urea and visualized using Coomassie blue staining. The strong Coomassie blue-stained band (red square) was excised and subjected to mass spectrometric (MS) analysis. The most enriched proteins according to MS analysis were ranked as shown in the table. The image of MS machine (Orbitrap Pro) is from Thermo Fisher Scientific website. h, i Representative images of h Congo Red-stained (scale bar: 200 μm) and i transmission electron microscopy-analyzed (scale bar: 250 nm) Ctrl and Qk-iCKO lenses at P30. All the experiments were replicated three times in the lab.
Fig. 2
Fig. 2. Qki depletion leads to downregulation of genes in the cholesterol biosynthesis pathway in eye lens.
a IPA of the genes with a significant reduction of mRNA expression in isolated Qk-iCKO mouse lenses compared to Ctrl mouse lenses at P17-19 according to RNA-seq (p < 0.05; right-tailed Fischer’s exact t-test). The top enriched downregulated canonical cellular pathways are ranked according to p-value. Exact p-value is listed in Supplementary Table 2. Cellular pathways involved in cholesterol biosynthesis are labeled in red. b Heatmap showing the relative expression value (Z score) of all 19 genes involved in cholesterol biosynthesis in Ctrl (n = 3) and Qk-iCKO (n = 3) lenses according to RNA-seq data ranked by fold change. c Cholesterol biosynthesis pathway with the genes encoding the enzymes involved in each step of the pathway. Red labeled indicate the cholesterol biosynthesis genes downregulated shown in b. d Results of RT-qPCR analysis of cholesterol biosynthesis genes in isolated Ctrl (n = 3) and Qk-iCKO (n = 3) lenses at P17-19. p = 0.0001552 (Hmgcs1); 0.001142 (Hmgcr); 0.002307 (Pmvk); 0.000008831 (Mvd); 0.0005463 (Idi1); 0.00003504 (Fdps); 0.0009219 (Fdft1); 0.00001013 (Lss); 0.00003438 (Cyp51); 0.00002009 (Tm7sf2); 0.000001402 (Msmo1); 0.000006230 (Nsdhl); 0.00003707 (Hsd17b7); 0.00003894 (Sc5d), **p < 0.01; ***p < 0.001; ****p < 0.0001 (two-tailed unpaired t-test). The results are presented as means with SD. e, f Immunoblots and quantification of enzymes involved in cholesterol biosynthesis (Hmgcs1, Hmgcr, and Fdps) and immunoblots of Qki-5 and Qki-6 in isolated Ctrl (n = 3) and Qk-iCKO (n = 3) lenses at P19. β-actin: loading control. p = 0.009136 (Hmgcs1); 0.02481 (Hmgcr); 0.0006804 (Fdps), *p < 0.05; **p < 0.01; ***p < 0.001 (two-tailed unpaired t-test). The results are presented as means with SD. g Schematic of the differentiation of NSCs to NLPCs (right). Bright-field images and immunostains for Pax6 (green) and αB-crystallin (red) in NSCs and NLPCs (left). DAPI (blue): nuclei. Scale bar: 50 μm. h Immunofluorescent staining of WT and Qki-depleted (Qk-/-) NSCs for Qki-5. DAPI (blue): nuclei. Scale bar: 50 μm. i The top enriched downregulated canonical cellular pathways in Qk-/- NLPCs (n = 3) compared to WT NLPCs (n = 3) according to RNA-seq (IPA; p < 0.05; right-tailed Fischer’s exact t-test) are ranked according to p-value. Exact p-value is listed in Supplementary Table 3. Cellular pathways involved in cholesterol biosynthesis are labeled in red. j Heatmap of the relative average expression value (Z score) of all 19 genes involved in cholesterol biosynthesis according to RNA-seq data in WT (n = 3) and Qk-/- (n = 3) NLPCs and WT (n = 3) and QKI KO (n = 3) HLE-B3 cells. k Results of RT-qPCR analysis of cholesterol biosynthesis genes in WT (n = 3) and Qk-/- (n = 3) NLPCs. p = 0.01012 (Hmgcs1); 0.02979 (Hmgcr); 0.003582 (Mvd); 0.0009995 (Idi1); 0.00006936 (Fdps); 0.001929 (Cyp51); 0.03582 (Msmo1); 0.001525 (Nsdhl); 0.0000009839 (Sc5d); 0.02260 (Dhcr24), *p < 0.05; **p < 0.01; ***p < 0.001; ****p < 0.0001 (two-tailed unpaired t-test). The results are presented as means with SD. All the experiments were replicated three times in the lab.
Fig. 3
Fig. 3. Cholesterol levels are decreased in Qki-depleted lenses, and sterol supply alleviates the cataract phenotype in the lenses of Qk-iCKO mice.
a Filipin (blue) staining of lens cells from frozen sections of the eyes of Ctrl and Qk-iCKO mice at P19. TO-PRO3 (magenta): nuclei. Scale bar: 10 μm. b Quantification of filipin intensity (A.U.) in the regions between the white dotted lines in Ctrl and Qki-depleted lenses shown in a. ****p < 0.0001 (two-tailed unpaired t-test). The results are presented as means with SD. 10 cells from the images shown in a are counted for quantification. Each dot represents the intensity of individual cells. c Quantification of total free cholesterol levels (μg/mg tissue) in lenses isolated from Ctrl (n = 5) and Qk-iCKO (n = 5) mice at P19. p = 0.0032, **p < 0.01 (two-tailed unpaired t-test). The results are presented as means with SD. d Timeline and schematic of lanosterol-based treatment in mice. e Representative images of lenses isolated from Ctrl and Qk-iCKO mice given either mock (control) or lanosterol-based treatment for 1 week. Scale bar: 0.5 mm. f Quantification of the area of protein aggregates from isolated Ctrl (n = 6) and Qk-iCKO (n = 6) lenses after mock and lanosterol-based treatment. Aggregation index = x/average of the area of aggregates in Ctrl lenses with the mock treatment. x = area of aggregates. p = 0.1668 (Ctrl); 0.0014 (Qk-iCKO), **p < 0.01; ns not significant (p ≥ 0.05) (two-tailed paired t-test). The results are presented as means with standard error of the mean (SEM). All the experiments were replicated three times in the lab.
Fig. 4
Fig. 4. QKI-5 cooperates with SREBP2 at promoters genome-wide in lens cells.
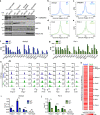
a Immunoblots of QKI-5 in subcellular fractions of WT and QKI KO HLE-B3 cells. GAPDH: cytosol; SP1: nuclei; Histone H3: chromatin. The result was repeated three times. b, c Co-IP of HLE-B3 cells overexpressing QKI-5–HA and Flag-SREBP2 with b anti–QKI-5 antibody blotting with anti-Flag and –QKI-5 antibodies and c anti-SREBP2 antibody blotting with anti-HA and -SREBP2 antibodies. mSREBP2: mature SREBP2. The results were repeated three times. d, e Co-IP of NLPCs overexpressing Flag-Srebp2 with d anti–Qki-5 antibody blotting with anti-Flag and Qki-5 antibodies and e anti-Srebp2 antibody blotting with antiQki-5 and -Srebp2 antibodies. The results were repeated three times. f Genomic annotation of genome or Qki-5–, Srebp2-, and Pol II-binding sites from ChIP-seq in NLPCs. Promoters are confined to the regions of ±2 kb from the TSS. g Heatmap of Qki-5, Srebp2, and Pol II ChIP-seq and input signals within ±2.5 kb from the TSS regions for all promoters (n = 24,776) in NLPCs ranked by Qki-5 density. h Signalplots showing the read counts per million mapped reads (RPM) for Qki-5, Srebp2, and Pol II ChIP-seq data and input ±2.5 kb from the TSS of all promoter regions (n = 24,776) in NLPCs.
Fig. 5
Fig. 5. Qki-5 cooperates with Srebp2 to regulate transcription of cholesterol biosynthesis genes.
a Venn diagram showing the number of overlapping promoters bound by Qki-5, Srebp2, and Pol II from ChIP-seq in NLPCs. Promoters defined by TSS ± 2 kb. b DNA-binding motif similar to the known SREBP2 motif was enriched in QKI-5 ChIP-seq peaks in NLPCs and HLE-B3 cells using HOMER motif analysis. p-value was derived by HOMER using cumulative binomial distributions. c IPA of the top 1,000 genes (ranked according to RPM within ±0.5 kb of TSS in Srebp2 ChIP-seq) in overlapping binding promoters shown in a (n = 9,032). Canonical cellular pathways are ranked according to significance (p-value) (p < 0.05; right-tailed Fischer’s exact t-test). The blue labels the canonical cellular pathways including cholesterol biosynthesis genes. d Cholesterol biosynthesis pathway and genes encoding the enzymes involved in the cholesterol biosynthesis. Blue-labeled genes are clustered in the cholesterol biosynthesis pathway in c. e UCSC Genome Browser snapshot of the promoter regions of cholesterol biosynthesis genes encoding the cholesterol biosynthesis enzymes labeled in blue in d, which are co-bound by Qki-5, Srebp2, and Pol II in NLPCs. Input and rabbit IgG are used as controls. f Venn diagram showing the overlapping genes between Qki-5–bound genes from Qki-5 ChIP-seq data in NLPCs and downregulated genes in both Qk-/- NLPCs and QKI KO HLE-B3 cells relative to WT according to RNA-seq (p < 0.05; two-tailed Wald test). DE: differentially expressed. g IPA of the overlapping genes in f (n = 301) ranked according to significance (p-value) (p < 0.05; right-tailed Fischer’s exact t-test). Cellular pathways involved in cholesterol biosynthesis are labeled in orange. h Comparison of the average RPM values of the Qki-5+Srebp2 (n = 1,583) and Qki-5+Srebp2+ (n = 9,047) ChIP-seq binding events within ±0.5 kb from the TSS shown in NLPCs.
Fig. 6
Fig. 6. QKI-5 transcriptionally enhances cholesterol biosynthesis by facilitating SREBP2/POL II recruitment.
a Immunoblots for detection of mSREBP2 (mature SREBP2) in subcellular fractions of HLE-B3 cells. GAPDH: cytosol; SP1: nuclei; Histone H3: chromatin. The result was repeated three times. b, c Signalplots showing RPM for SREBP2 in b NLPCs and c HLE-B3 cells ±2.5 kb from the TSS of SREBP2-bound peaks in WT and QKI KO cells. d, e Signalplots showing the read counts per million mapped reads for POL II in d NLPCs and e HLE-B3 cells ±2.5 kb from the TSS of SREBP2-bound peaks in WT and QKI KO cells. f, g RPM value of all the 19 cholesterol biosynthesis genes in f Srebp2 ChIP-seq and g Pol II ChIP-seq in WT and Qk-/- NLPCs. h Representative UCSC Genome Browser snapshot of the promoter regions of cholesterol biosynthesis genes from ChIP-seq of NLPCs. i, j Srebp2 and Pol II ChIP-qPCR analysis of the promoter regions of Hmgcs1, Hmgcr, and Mvk in WT and Qk-/- NLPCs. i p = 0.0006554 (Hmgcs1); 0.0002616 (Hmgcr); 0.0005623 (Mvk); 0.7637 (Non-target). j p = 0.001092 (Hmgcs1); 0.00009184 (Hmgcr); 0.002848 (Mvk); 0.7947 (Non-target). **p < 0.01; ***p < 0.001; ****p < 0.0001; ns not significant (p ≥ 0.05) (two-tailed unpaired t-test). The results are presented as means with SD. Data are representative of three independent experiments. k Heatmap of normalized fold change of RPM in WT NLPCs over Qk-/- NLPCs (log2(RPMWT/RPMQk-/-) in Srebp2 and Pol II ChIP-seq data ranked by fold change in RNA-seq of NLPCs. Arrows indicate cholesterol biosynthesis genes.
Fig. 7
Fig. 7. Qki-5 interacts with ssDNA.
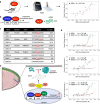
a Schematic of the MST assay of bacterially expressed recombinant Qki-5 and QRE. The image of MST machine (Monolith NT.115) is from https://nanotempertech.com/monolith. The titration curve for the MST assay for fluorescently labeled Trx-His6–Qki-5 (full-length) and QRE1 (CUUCUUAAUAUAACUGCCUUAAACUUUAAU) is shown at right (n = 3). The results are presented as means with SD. b Schematic for designing the QDEs proximally downstream of SREs in the promoter regions of cholesterol biosynthesis genes used for the MST assay to examine the interaction with Qki-5. c The ssDNA oligos (QDE and QDE-m [mutant]) tested in the MST assay and the Kd value of each oligo in the assay. d Titration curves for the MST assay showing the Kd values for fluorescently labeled Trx-His6-Qki-5 (full-length) (fraction of 20 nM protein bound by DNA, y-axis) and QDE/QDE-m (2-fold serially diluted 16 different concentrations (M), x-axis). n = 3/group. The results are presented as means with SD. e Schematic diagram depicting proposed mechanisms by which Qki-5 cooperates with Srebp2 to enhance transcription of cholesterol biosynthesis, which maintains proper sterol levels to ensure protein homeostasis in eye lens cells and prevent cataracts.

Similar articles

Cited by

References

    1. Simons K, Toomre D. Lipid rafts and signal transduction. Nat. Rev. Mol. Cell Biol. 2000;1:31. doi: 10.1038/35036052. - DOI - PubMed
    1. Ikonen E. Cellular cholesterol trafficking and compartmentalization. Nat. Rev. Mol. Cell Biol. 2008;9:125–138. doi: 10.1038/nrm2336. - DOI - PubMed
    1. Nohturfft A, Zhang SC. Coordination of lipid metabolism in membrane biogenesis. Ann. Rev. Cell Dev. Biol. 2009;25:539–566. doi: 10.1146/annurev.cellbio.24.110707.175344. - DOI - PubMed
    1. Espenshade PJ, Hughes AL. Regulation of sterol synthesis in eukaryotes. Annu. Rev. Genet. 2007;41:401–427. doi: 10.1146/annurev.genet.41.110306.130315. - DOI - PubMed
    1. Cenedella RJ. Cholesterol and cataracts. Surv. Ophthalmol. 1996;40:320–337. doi: 10.1016/S0039-6257(96)82007-8. - DOI - PubMed

Publication types