. 2021 May 21;12(1):3015.
doi: 10.1038/s41467-021-23111-1.

Transcriptional signature in microglia associated with Aβ plaque phagocytosis

Affiliations

Transcriptional signature in microglia associated with Aβ plaque phagocytosis

Alexandra Grubman et al. Nat Commun. .

Abstract

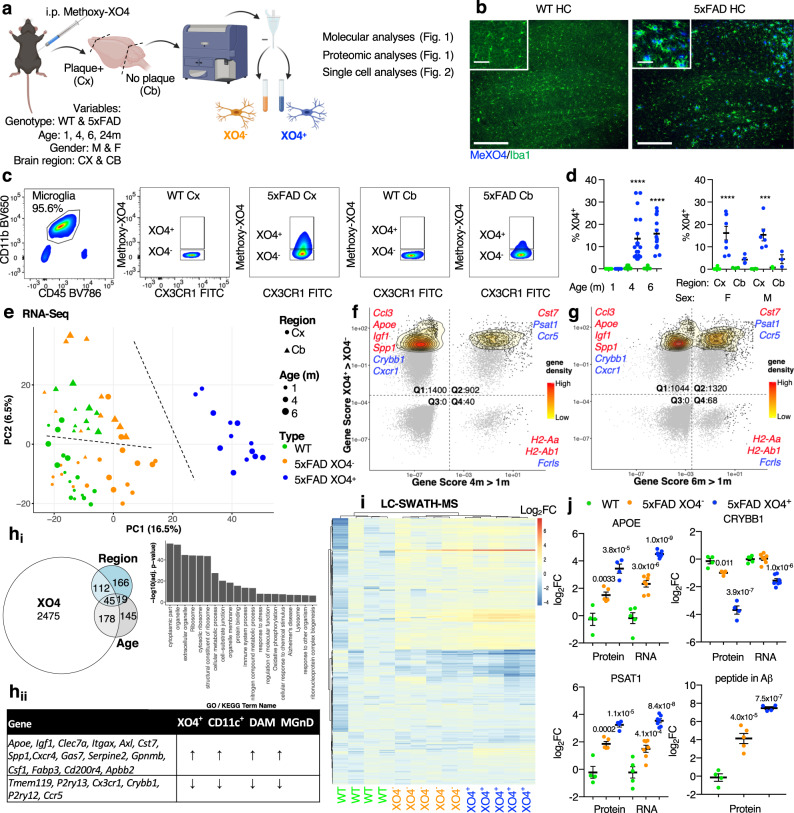
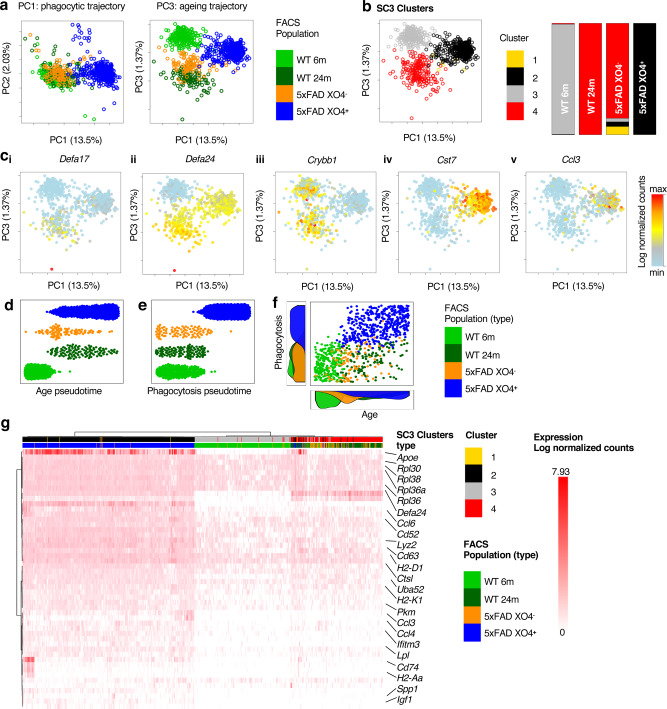
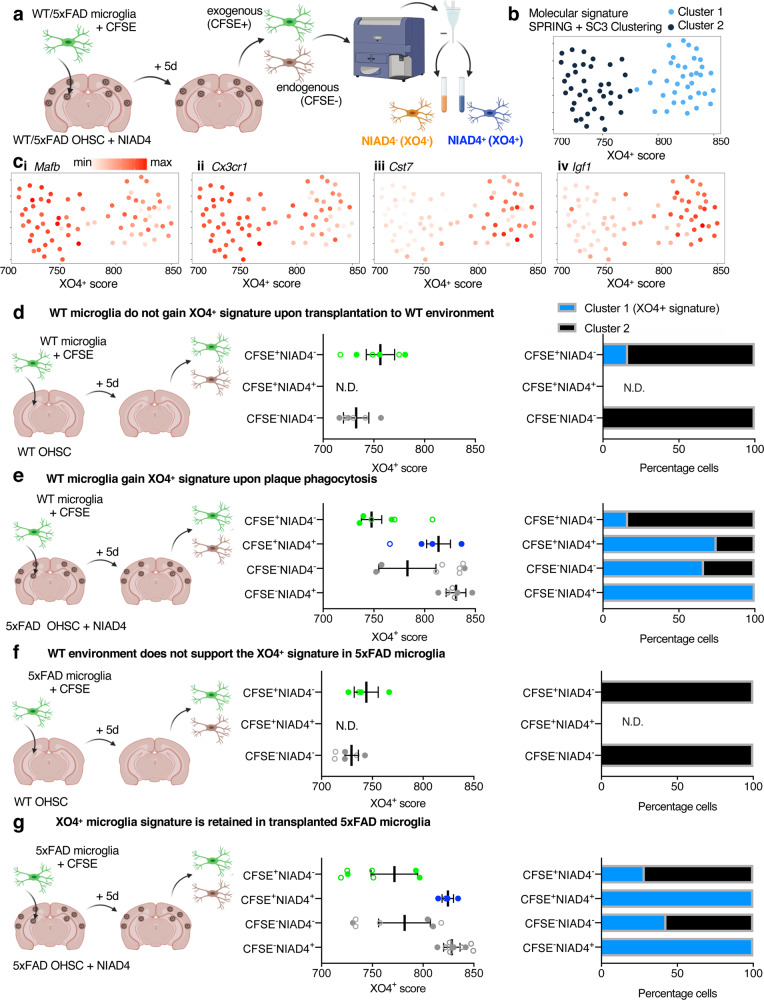
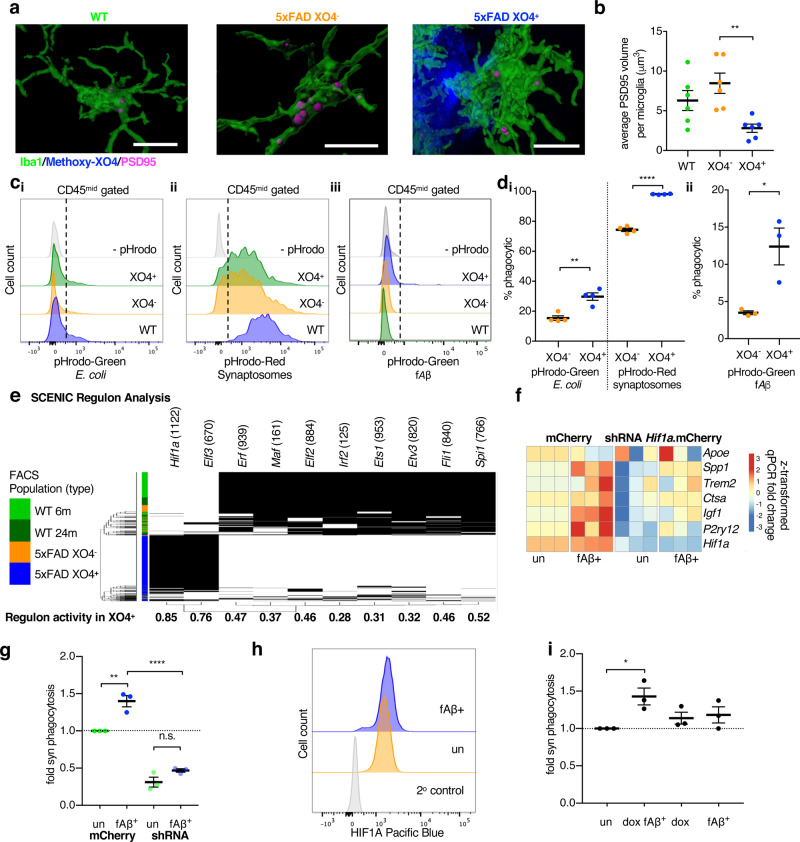
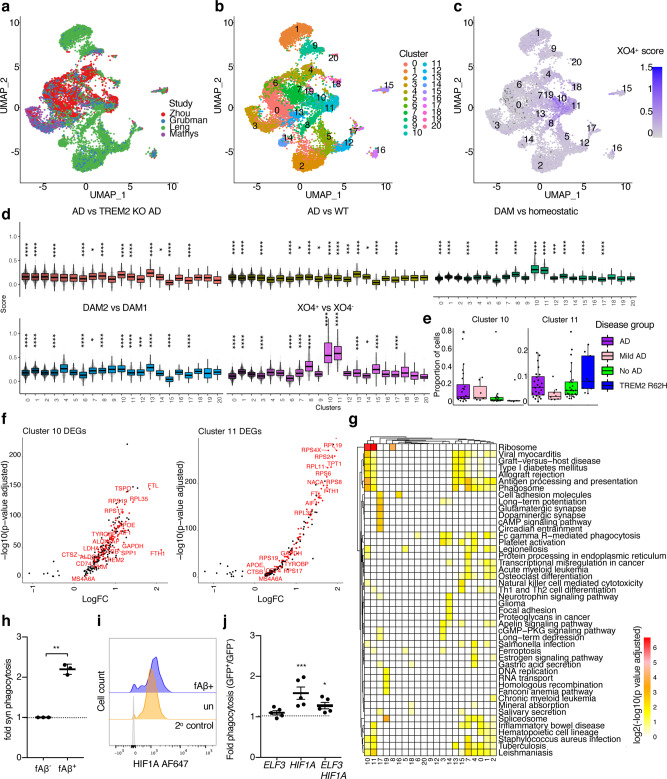
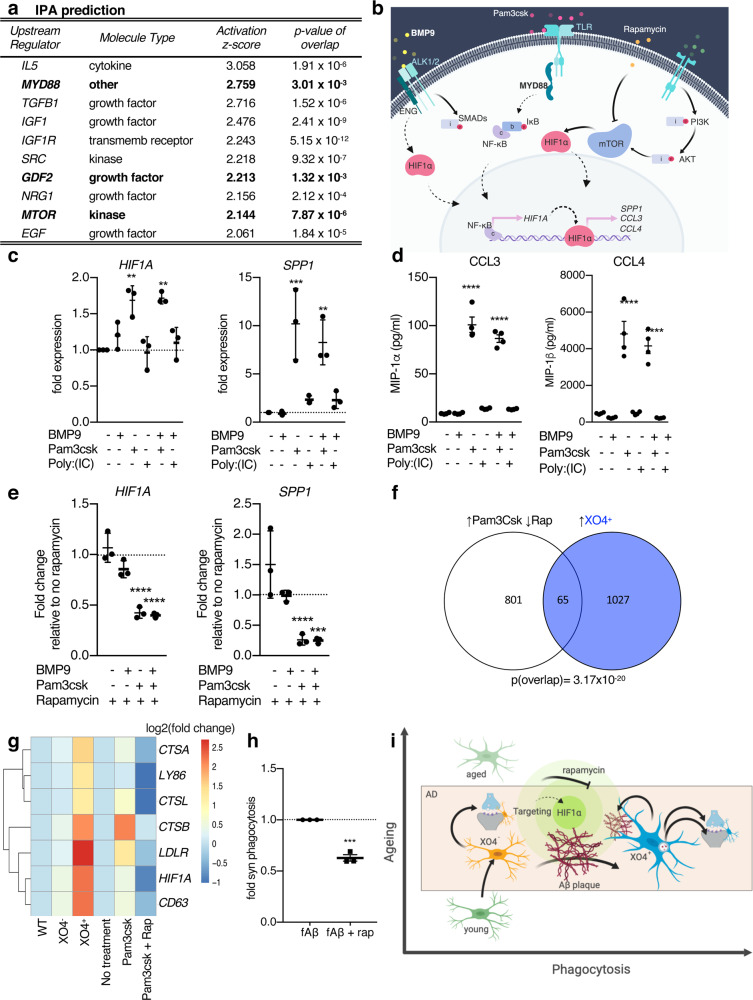
The role of microglia cells in Alzheimer's disease (AD) is well recognized, however their molecular and functional diversity remain unclear. Here, we isolated amyloid plaque-containing (using labelling with methoxy-XO4, XO4+) and non-containing (XO4-) microglia from an AD mouse model. Transcriptomics analysis identified different transcriptional trajectories in ageing and AD mice. XO4+ microglial transcriptomes demonstrated dysregulated expression of genes associated with late onset AD. We further showed that the transcriptional program associated with XO4+ microglia from mice is present in a subset of human microglia isolated from brains of individuals with AD. XO4- microglia displayed transcriptional signatures associated with accelerated ageing and contained more intracellular post-synaptic material than XO4+ microglia, despite reduced active synaptosome phagocytosis. We identified HIF1α as potentially regulating synaptosome phagocytosis in vitro using primary human microglia, and BV2 mouse microglial cells. Together, these findings provide insight into molecular mechanisms underpinning the functional diversity of microglia in AD.


Conflict of interest statement

O.J.L.R. and J.M.P. are co-founders and shareholders of Mogrify Ltd. A.G. is presently an employee of Biogen. Biogen had no influence in the design or execution of this study. All other authors declare no competing interests.

Figures

Fig. 1
Fig. 1. Methoxy-XO4 labels a molecularly distinct plaque-phagocytic population in 5xFAD mice.
a Schematic of the methodology employed in this study, created with BioRender.com. M, male, F, female, WT, wild-type, Cx, cortex and subcortical regions, Cb, cerebellum. b Representative immunofluorescence image of the hippocampus (HC) of WT and 5xFAD mice injected with methoxy-XO4 and stained with Iba1 (AlexaFluor 488, n = 6 animals per genotype), scale bar = 250 μm, inset 50 μm. c Representative FACS plot showing that XO4+ microglia are present in 6 m 5xFAD plaque-affected regions (top panels). d Left, the percentage of XO4+ microglia isolated from plaque-affected regions in 1, 4 and 6 m old WT (m, month) and 5xFAD mice (from n = 6 animals per genotype at 1 m; 4 m WT, n = 19 animals; 4 m 5xFAD, n = 22; 6 m WT, n = 14; 6 m 5xFAD n = 14) and right, the percentage of XO4+ microglia isolated from plaque-affected and non-affected regions in 6 m old male and female WT and 5xFAD mice (F, Cx, n = 8 per genotype; M, Cx, n = 6 per genotype; F, Cb, n = 4 per genotype; M, Cb, n = 3 per genotype), expressed as mean ± SEM, ***p = 0.003 and ****p = 4.6 × 10−5 for 4 m, p = 9 × 10−6 for 6 m, and p = 5.2 × 10−5 for F Cx vs Cb by Kruskal-Wallis and Dunn’s multiple comparison tests. e PCA of bulk RNA-seq. Cx, Cortex; Cb, Cerebellum. f, g Gene cytometry plots showing DEGs between XO4+ and XO4 microglia and/or DEGs expressed between old (4, 6 m) and young (1 m) microglia. Gene scores are calculated as the product of the LFC and –log10(FDR). Example genes in each quadrant are labelled in red (upregulated over time or phagocytosis) or blue (downregulated). Gene density low = 0, high = 0.2. hi Venn diagram showing the overlap between genes whose expression levels could be explained by the age, region and XO4 covariate as well as GO and KEGG terms associated with XO4 covariate genes. hii Table showing the 21 core microglial neurodegeneration signature genes and their direction of differential expression in DAM, CD11c+ , MGnD and XO4+ microglia. i Heatmap of targeted LC-SWATH-MS analysis of detected peptides within DEGs in biological replicates of WT (green, n = 4 animals), XO4 5xFAD (orange, n = 5) and XO4+ 5xFAD (blue, n = 4) microglia. Colour scale represents log2-transformed normalized fold changes compared to WT microglia. clustering method = ward.D2, distance = maximum. j Comparison of RNA and protein expression for selected genes, and quantitation of a tryptic peptide in Aβ in microglia. Data are expressed as mean ± SEM LFC compared to WT microglia, normalized relative to peptides in Supplementary Data 4. p-Values were calculated by one-way ANOVA using Holm-Sidak’s multiple comparison test. Data are from WT (n = 4 animals), XO4 5xFAD (n = 5), XO4+ 5xFAD (n = 4) for protein analyses; WT (n = 5), XO4 5xFAD (n = 7), XO4+ 5xFAD (n = 7) for RNA analyses.
Fig. 2
Fig. 2. Single-cell sequencing identifies an ageing profile in 5xFAD XO4 microglia.
a PCA of 893 single cells (6 m WT = 243 cells, 24 m WT = 121 cells, 6 m 5xFAD XO4 = 95 cells, 6 m 5xFAD XO4+ = 434 cells; m, month) and 1671 feature genes showing the distribution of cells from each FACS-sorted sample. PC, principal component. b PCA plot of single microglia coloured by single cell consensus (SC3) clusters and composition of automated clusters as a percentage of sequenced FACS-sorted cell populations. c PCA plots for single microglia coloured by expression of selected ageing microglia genes (i-ii), homeostatic (iii) and signature genes associated with XO4+ microglia (iv-v). min = 0 for all genes, Defa17 max = 4.77, Defa24 max = 7.41, Crybb1 max = 4.13, Cst7 max = 5.47, Ccl3 max = 4.89. d, e Diffusion maps pseudotime analysis of microglial populations ordered by their expression of (d) ageing DEGs (24 m WT vs 6 m WT, 42 DEGs) or (e) phagocytic DEGs (6 m 5xFAD XO4+ vs 6 m 5xFAD XO4, 474 DEGs). f Scatter plot showing the relationship between ageing and phagocytosing pseudotime in individual cells, and the density of cells at each point during the ageing (bottom) and phagocytosing (left) trajectories. g Hierarchical clustering and heatmap showing expression of the top 50 DEGs across the 4 SC3 clusters.
Fig. 3
Fig. 3. The gene expression signature associated with XO4+ microglia is reversible and is acquired through phagocytosis of amyloid plaques.
a Schematic representing the experimental design involving addition of 2 × 104 microglia to NIAD4-stained organotypic hippocampal slice cultures (OHSCs), followed by FACS isolation of carboxyfluorescein succinimidyl ester (CFSE)-labelled replenished and CFSE- endogenous microglia that differentially phagocytose endogenous NIAD4-labelled plaques after 5 days co-culture with wild-type (WT) or 5xFAD OHSCs, created with BioRender.com. b, c k-nearest-neighbour (kNN) graph rendered using a force-directed layout (SPRING), coloured by single cell consensus (SC3) cluster (b), and log2-transformed ΔCt values of selected DEGs (c). Each dot represents 10 sorted cells, and data are from (d) n = 120 cells, (e) n = 240 cells, (f) n = 110 cells, (g) n = 280 cells sorted during 3 independent experiments. Replicates from independent experiments are closed circles, technical replicates are open circles. The XO4+ score is defined as the x-axis position of each sorted population on the kNN graph. The colour scales are log2(ΔCt), Mafb min ΔCt = 0.0003, max ΔCt = 3.37; Cx3cr1 min ΔCt = 0.0001, max ΔCt = 9.69; Cst7 min ΔCt = 0.0002, max ΔCt = 4.56; Igf1 min ΔCt = 0.0001, max ΔCt = 1.07. dg Experimental schematic, XO4+ score and proportion Cluster 1 and Cluster 2 membership of groups of exogenous and endogenous (d) WT microglia added into a WT OHSC, (e) WT microglia added into 5xFAD slices, recapitulating the gene expression signature associated with XO4+ microglia upon plaque phagocytosis. f XO4+ phenotype is stable in exogenous CFSE+NIAD4+ 5xFAD microglia recovered from 5xFAD slices, but (g) is lost in CFSE+ 5xFAD microglia recovered from WT slices. N.D., not detected. Data are presented as mean ± SEM.
Fig. 4
Fig. 4. 5xFAD XO4+ microglia contain less post-synaptic material than 5xFAD XO4 microglia in the dentate gyrus.
a Representative 3D reconstructions of confocal z-stacks showing PSD95 internalized within WT, 5xFAD XO4 or 5xFAD XO4+ microglia cells (scale bars = 15 μm). b PSD95 within microglia quantified as the average volume of phagocytosed PSD95 volume per microglia volume in each dentate gyrus section (n = 6 z-stacks per condition; *p = 0.0057, using one-way ANOVA and Tukey’s multiple comparison test). All data are from n = 3 WT and n = 6 5xFAD animals and is presented as mean ± SEM per individual section. c Functional analysis of ex vivo mouse microglia phagocytosis following 1 h incubation with (ci) pHrodo-green-labelled E. coli, (cii) pHrodo-red-labelled synaptosomes or (ciii) pHrodo-green-labelled fAβ by FACS. Each population is gated based on XO4+ signal and compared to controls not incubated with pHrodo particles. di Quantitation of the percentage of XO4+ and XO4 microglia that phagocytose pHrodo-red-labelled synaptosomes or pHrodo-green-labelled E. coli (comparing XO4 and XO4+ microglia from n = 4 animals), or dii pHrodo-green-labelled fAβ (comparing XO4 and XO4+ microglia from n = 3 animals). Data in (d) are presented as mean ± SEM. *p = 0.0233, **p = 0.0027 and ****p = 9.2 × 10−7 by paired 2-tailed t-test. e SCENIC regulon analysis showing that Hif1a and Elf3 are predicted to control the XO4+ gene regulatory network. The number of genes in each regulon is shown in parentheses. f, g BV2 cells were stably transduced with mCherry or mCherry.shHif1a lentivirus and treated with DMSO or AF488-labelled fAβ for 24 h, then blue-labelled synaptosomes for 1.5 h. mCherry+ cells were FACS sorted for AF488-fAβ. f Normalized heatmap of gene expression, measured by qPCR, of signature genes associated with XO4+ microglia in fAβ+ and non-treated (un) BV2 cells with or without shHif1a, including Hif1a regulon genes (Igf1, Spp1, Ctsa, Hif1a) and genes not part of the Hif1a regulon (Apoe, Trem2, P2ry12). Data are expressed as fold change relative to non-treated mCherry transduced cells, based on ΔCt values relative to Actb. The data are from 3 independent experiments. g The proportion of cells that are highly phagocytic for blue-bead-labelled synaptosomes. Data are expressed as fold change in % phagocytosis relative to non-treated mCherry transduced cells (mean ± SEM). The data are from 3 independent experiments performed in triplicate. n.s., p = 0.22, **p = 0.0026, ****p = 6.0 × 10−6 by two-way ANOVA using Tukey’s multiple comparison test. h Histograms showing fluorescence intensity of HIF1A intracellular staining in AF488-fAβ+ and non-treated BV2 cells. Secondary antibody control cells are stained with Pacific-blue-labelled secondary antibodies alone. i The proportion of dox-treated (or not) and fAβ+ or non-treated (un) BV2 cells transduced with dox-inducible Hif1a expression constructs that are highly phagocytic for blue-bead-labelled synaptosomes. Data are expressed as fold change in % phagocytosis relative to non-treated mCherry transduced cells (mean ± SEM). The data are from 3 independent experiments performed in triplicate. *p = 0.0253 by one-way ANOVA using Holm-Sidak’s multiple comparison test.
Fig. 5
Fig. 5. The gene expression signature associated with XO4+ microglia is molecularly and functionally replicated in microglia isolated from the brains of AD patients and non-AD patients.
ac UMAP projection of single microglia nuclei from control and AD patient entorhinal and frontal cortex samples, combined by integrating data from, comprising 102 patients; AD (n = 5891 microglia nuclei), mild AD (n = 1591 microglia nuclei), controls (n = 2988 microglia nuclei), Other Dementia (n = 3 microglia nuclei) and TREM2 R62H variant (n = 1458 microglia nuclei). Clustering and analysis of signature scores is performed using Seurat v3. UMAP projection is coloured by (a) study of origin, (b) Seurat cluster and (c) XO4+ score. d Box plots for gene signature scores in each human microglial cluster for the AD vs Trem2KO AD signature, AD vs WT signature, DAM vs homeostatic, and DAM2 vs DAM1 signatures. The lower, middle and upper hinges represent the lower quartile, median and upper quartile, respectively, while the upper and lower whiskers extend ±1.5 times of the interquartile range from the hinges. For each signature score category, pairwise Wilcoxon test between each cluster and base mean was computed. Multiple testing was corrected for using Bonferroni correction. *p < 0.05, **p < 0.01; ***p < 0.001, ****p < 0.0001, exact p values are provided in the Source data. e The proportion of cells in Clusters 10 and 11 in patients with any cells in Cluster 10 or Cluster 11, respectively (please see Supplementary Fig. 11 for sample size details), grouped according to disease status and/or TREM2 genotype (*p = 0.047, Wilcoxon Test with No AD as reference). The lower, middle, and upper hinges represent the lower quartile, median and upper quartile, respectively, while the upper and lower whiskers extend ±1.5 times of the interquartile range from the hinges. f Cluster 10 and Cluster 11 DEGs relative to all other human microglia clusters (adjusted p-value < 0.05). Genes of interest associated with XO4+ microglia are highlighted in red. g Heatmap of enriched KEGG pathways in the human microglial Seurat clusters, coloured by log2(-log10(adjusted p-value)). h Fluorescently labelled synaptosome internalization by human primary microglia treated with AF647-labelled fAβ. The data are mean ± SEM of 3 independent biological replicates and are expressed as fold change in synaptosome internalization relative to non-treated microglia. Differences are reported between AF488-fAβ+ and AF488-fAβ cells tested from within the same well. i Histograms showing fluorescence intensity of HIF1A intracellular staining in AF488-fAβ+ and AF488-fAβ human primary microglia assayed from within the same well. Secondary antibody control cells are stained with AF647 secondary antibodies alone. j Fluorescently labelled synaptosome internalization by primary microglia transfected with GFP-tagged inducible HIF1A and/or ELF3 overexpression constructs. The data are the mean ± SEM of 5 independent biological replicates and are expressed as fold change in synaptosome internalization between GFP+ and GFP (non-transfected) cells tested from within the same well. *p = 0.0188, ***p = 0.0002 by two-way ANOVA and Sidak’s multiple comparison test on the raw synaptosome internalization percentages.
Fig. 6
Fig. 6. The gene expression signature associated with XO4+ microglia can be manipulated through the Hif1a regulon.
a Top ten activators of the Hif1a regulon predicted by IPA. The activation z-score is a statistical measure of the match between the expected relationship direction of regulation and the observed gene expression; positive z-scores are indicative of predicted activation. p-Value of overlap refers to the significance of the overlap between the Hif1a regulon gene set and the regulated target genes predicted by IPA. The 3 predicted regulators tested in this figure are in bold. b Cartoon diagram of hypothesis generated by IPA. c Stimulation of iMGLs with MyD88-dependent TLR-agonist Pam3csk (alone or with BMP9) induces genes associated with XO4+ microglia within the Hif1a regulon as identified by qPCR (HIF1A **p = 0.0014 and p = 0.0012, respectively, SPP1 ***p = 0.00024 and **p = 0.0015 by one-way ANOVA and Holm-Sidak post-test), n = 3 independent experiments. d Cytometric bead array (****p < 0.0001 by one-way ANOVA and Holm-Sidak post-test, CCL3: F(5,18)=137.1; CCL4: F(5,18)=42.04), n = 4 independent experiments. MyD88-independent TLR stimulation (Poly:IC) does not shift iMGLs towards a gene expression signature associated with XO4+ microglia. Data are fold changes normalized to non-treated cells. e MyD88-dependent expression of genes associated with XO4+ microglia is modulated by rapamycin. Data are fold changes induced by rapamycin normalized to each respective treatment in the absence of rapamycin. HIF1A ****p = 3.5 × 10−7 and 1.7 × 10−7 and SPP1 ****p = 6.5 × 10−5 and ***p = 0.0006, respectively, by two-way ANOVA compared to non-rapamycin-treated cells and Holm-Sidak post-test. n = 3 independent experiments. f Venn diagram showing the overlap between a XO4+-like state induced in iMGLs using Pam3csk and reversed by rapamycin (RNA-seq, n = 4 independent experiments) as predicted by ingenuity pathway analysis (IPA) with the mouse gene expression signature associated with XO4+ microglia, as measured by RNA-seq (p = 3.17 × 10−20, hypergeometric test). g Representative gene expression heatmap of selected genes that are part of the overlap, showing expression levels in mice (WT, 5xFAD XO4, 5xFAD XO4+) and human iMGLs (non-treated, Pam3csk and Pam3csk+rapamycin). h Fluorescently labelled synaptosome internalization by iMGLs treated with amyloid fibrils, alone, or in combination with rapamycin for 48 h, as measured by FACS. The data are presented as mean ± SEM, and p = 0.0002 by unpaired t-test, n = 3 independent experiments. i Proposed model of generation and regulation of microglia diversity in AD, created with BioRender.com.

References

    1. Li Q, Barres BA. Microglia and macrophages in brain homeostasis and disease. Nat. Rev. Immunol. 2018;18:225–242. doi: 10.1038/nri.2017.125. - DOI - PubMed
    1. Grubman A, Kanninen KM, Malm T. Multitasking microglia and Alzheimer’s disease: diversity, tools and therapeutic targets. J. Mol. Neurosci. 2016;60:390–404. doi: 10.1007/s12031-016-0825-5. - DOI - PubMed
    1. Paolicelli RC, et al. Synaptic pruning by microglia is necessary for normal brain development. Science. 2011;333:1456–1458. doi: 10.1126/science.1202529. - DOI - PubMed
    1. Scheff SW, Price DA, Schmitt FA, Mufson EJ. Hippocampal synaptic loss in early Alzheimer’s disease and mild cognitive impairment. Neurobiol. Aging. 2006;27:1372–1384. doi: 10.1016/j.neurobiolaging.2005.09.012. - DOI - PubMed
    1. Villemagne VL, et al. Amyloid β deposition, neurodegeneration, and cognitive decline in sporadic Alzheimer’s disease: a prospective cohort study. Lancet Neurol. 2013;12:357–367. doi: 10.1016/S1474-4422(13)70044-9. - DOI - PubMed

Publication types

Substances