. 2021 May 21;12(1):3020.
doi: 10.1038/s41467-021-23294-7.

Co-development of central and peripheral neurons with trunk mesendoderm in human elongating multi-lineage organized gastruloids

Affiliations

Co-development of central and peripheral neurons with trunk mesendoderm in human elongating multi-lineage organized gastruloids

Zachary T Olmsted et al. Nat Commun. .

Abstract

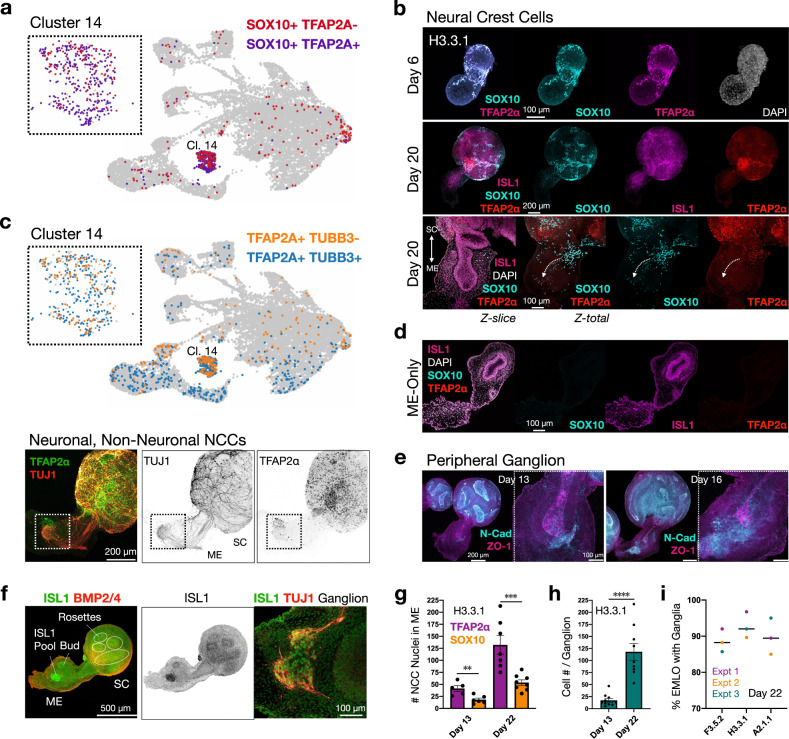
Stem cell technologies including self-assembling 3D tissue models provide access to early human neurodevelopment and fundamental insights into neuropathologies. Gastruloid models have not been used to investigate co-developing central and peripheral neuronal systems with trunk mesendoderm which we achieve here in elongating multi-lineage organized (EMLO) gastruloids. We evaluate EMLOs over a forty-day period, applying immunofluorescence of multi-lineage and functional biomarkers, including day 16 single-cell RNA-Seq, and evaluation of ectodermal and non-ectodermal neural crest cells (NCCs). We identify NCCs that differentiate to form peripheral neurons integrated with an upstream spinal cord region after day 8. This follows initial EMLO polarization events that coordinate with endoderm differentiation and primitive gut tube formation during multicellular spatial reorganization. This combined human central-peripheral nervous system model of early organogenesis highlights developmental events of mesendoderm and neuromuscular trunk regions and enables systemic studies of tissue interactions and innervation of neuromuscular, enteric and cardiac relevance.


Conflict of interest statement

The authors declare no competing interests.

Figures

Fig. 1
Fig. 1. Polarized gene expression and morphology in elongating multi-lineage organized (EMLO) gastruloids.
a Overview of EMLO gastruloid formation. Intact hiPSC colonies were pretreated with CHIR and FGF2 for 2 days prior to dissociation and transition to shaking culture on day 0. b Schematic representation of SOX2 (pink) and GATA6 (yellow) polarized expression in EMLOs over time. Early invagination of SOX2/GATA6 cells precedes the formation of a primitive gut tube-like structure. c Phase contrast of early EMLO shaking cultures at days 1, 2, and 4. Early compartmentalization of spinal cord (SC) neural versus mesoderm–endoderm protrusion (ME) can be visualized. d SOX2/GATA6 immunofluorescence (IF) of early EMLO aggregates. Day 4 inset depicts SOX2/GATA6 early tube formation (Z-slice). e Phase contrast of day 13 EMLO. f SOX2/GATA6 IF in day 13 EMLOs with DAPI (gray). SOX2/GATA6 colocalization persists in the primitive gut tube. Inset is GATA6 inverted LUT. H3.3.1 EMLOs were formed in N = 11 separate biological repeat experiments over the course of this study with similar results. Phase and IF data were acquired each time cf. EMLOs from the other F3.5.2 and A2.1.1 representative lines were separately formed in N = 5 biological repeat experiments. All other lines were formed in N = 3 repeat experiments. Images are representative of the EMLO populations across repeated experiments. g Schematic representation of the EMLO size parameters. Length (L), width (W), and SC diameter (D) were measured. h Histogram of the proportion of aggregates that are elongated long (L:W ratio >3.5), elongated short (2 < L:W < 3.5), or spherical/ovoid (L:W < 2) at day 13 using nine ED-hiPSC lines. The plot corresponds to elongation efficiency. EMLO formation using all lines was performed N = 3. n = number of aggregates measured is shown for each line. i Aspect ratio over time in representative ED-hiPSC lines. Elongation after pretreatment (n = 153 per line) was compared with elongation in basal medium N2B27 (n = 138 per line). Individual scale bars provided. Data reported as (mean ± s.e.m.).
Fig. 2
Fig. 2. Reproducible self-organization of a primitive gut tube-like structure.
a Single-cell RNA-Seq (scRNAseq) cluster annotation of H3.3.1 day 16 EMLOs (n = 15,576 cells, N = 1 biological sample) plotted with UMAP. b Canonical gut tube epithelial genes by scRNAseq with violin plots for FOXA2 (1,707/15,576 cells) and GATA6 (1,244/15,576 cells) (log2Exp). Violin plot statistics are as follows: FOXA2 (cluster 7 max = 5.36, min = 0, median = 1.59, q1 = 1, q3 = 2.32; cluster 8 max = 5.25, min = 0, median = 2, q1 = 1, q3 = 2.59), GATA6 (cluster 6 max = 3.32, min = 0, median = 0.66, q3 = 1; cluster 8 max = 3.91, min = 0, median = 1.06, q3 = 1.58; cluster 17 max = 4.09, min = 0, median = 1, q3 = 1.58). c Phase contrast of EMLO shaking cultures at day 15. Asterisk indicates gut tube (*). d Multi-dimensional visualization of SOX2 (magenta) and GATA6 (yellow) primitive gut tube in day 13 EMLO. Sagittal and transverse planes are shown. High magnification Z-slice depicts mitotic figures in apical (Ap) but not basal (Bs) epithelium. e SOX2 and GATA6 distribution as percent biomarker calculated from maximally projected Z-stacks of whole EMLOs over time. n = 60 total EMLOs measured (H3.3.1). f Length of gut tube major and minor axes over the elongation period in the three representative lines (n = 47 EMLOs measured per line). g Z-slices depict robust FOXA2 (cyan) expression in gut tube and associated TUJ1 (red) neuronal fibers at day 20. Inset is phase contrast. h Z-slice of CDH1/E-cadherin (cyan) and TUJ1 (red) IF at day 20. Maximally projected TUJ1 Z-volume is overlaid onto E-cad Z-slice to show 3D spatial relationship (right). i Increased gut tube morphological complexity at day 40 by FOXA2 and TUJ1 IF and phase contrast. Asterisk highlights meandering gut tube at this time point (*). j Identification of specified gastrointestinal cell types in day 16 EMLOs by scRNAseq that are intestinal stem cell (LGR5/SOX), esophagus–trachea junction (NKX2-1/SOX2), Paneth cell-like (LYZ/SOX2), and enterocyte-like (VIL1/SOX2). Individual scale bars provided. H3.3.1 EMLOs were formed in N = 11 separate biological repeat experiments over the course of this study with similar results. Phase and IF data were acquired each time (c, d, gi). Data reported as (mean ± s.e.m.).
Fig. 3
Fig. 3. Default dorsal-intermediate spinal cord identity in EMLOs can be ventralized.
a IF of day 13 and day 16 H3.3.1 EMLOs depicts TFAP2α (green) and GATA4 (cyan) (top), and TFAP2α (green) and GATA6 (cyan) (bottom), counterstained with TUJ1 (red). Position of gut tube is shown to highlight TFAP2α cell migration. b N-cadherin is restricted to SOX2 domain and gut tube anterior pole (dotted circle). c Schematic representation of spinal cord domains along dorsal–ventral axis with ventral (Hh) and dorsal (BMP) morphogen signaling gradients. Somite (S) and notochord (ventral, blue circle) are shown. d Day 22 spinal cord interneuron domain subtypes PAX2 (dI4, dI6, V0, V1), LBX1 (dI4-dI6), LHX9 (dI1), TLX3/ISL1 (dI3), CHX10 (V2a) in neural SC compartment. e Nkx-6.1 expression at day 22 suggests ventralization of spinal cord phenotype by addition of 500 nM Hh-Ag1.5 on day 10. f Quantification of neuronal subtype biomarkers in H3.3.1 EMLOs under control (DMSO, gray) or ventralizing (Hh-Ag1.5, blue) conditions. LHX9 (****p < 0.0001, t = 11.66, df = 15), ISL1 (n.s. p = 0.36, t = 0.9480, df = 19), LBX1 (*p = 0.047, t = 2.133, df = 18), PAX2 (***p = 0.0002, t = 4.352, df = 23), CHX10 (***p = 0.0005, t = 4.518, df = 14), Nkx-6.1 (****p < 0.0001, t = 23.09, df = 17) by unpaired two-tailed t test. n = 6000 cells minimum counted per condition from N = 1 experiment (Source Data file). The box and whisker plot statistics are as follows: LHX9 (Hh-Ag1.5: max = 8.35, min = 1.79, median = 4.52, q1 = 2.51, q3 = 6.97; DMSO: max = 48.50, min = 24.25, median = 35.45, q1 = 37.80; q3 = 30.86); ISL1 (Hh-Ag1.5: max = 88.07, min = 52.89, median = 67.52, q1 = 63.34, q3 = 80.90; DMSO: max = 90.68, min = 21.66, median = 68.15, q1 = 49.29, q3 = 74.60); LBX1 (Hh-Ag1.5: max = 98.24, min = 81.02, median = 94.29, q1 = 90.48, q3 = 96.91; DMSO: max = 50.24, min = 21.43, median = 39.72, q1 = 30.74, q3 = 45.77); PAX2: (Hh-Ag1.5: max = 94.68, min = 67.22, median = 79.94, q1 = 75.94, q3 = 90.63); CHX10 (Hh-Ag1.5: max = 39.62, min = 10.03, median = 19.87, q1 = 13.29, q3 = 26.98; DMSO: max = 8.30, min = 2.87, median = 5.54, q1 = 3.67, q3 = 5.75); Nkx-6.1 (Hh-Ag1.5: max = 98.57, min = 81.78, median = 94.81, q1 = 90.99, q3 = 97.16; DMSO: max = 33.67, min = 10.03, median = 19.87, q1 = 13.29, q3 = 28.34). g Dorsal (dI) and ventral (V) interneuron subtypes in scRNAseq neuronal cluster 10. Color-coded biomarker combinations are listed. Histogram data reported as (mean ±s.e.m.). Individual scale bars provided. For scRNAseq, N = 1 biological sample was analyzed with n = 15,576 cells. For IF, CDH2, GATA4, GATA6, TUJ1, and TFAP2α immunostain was performed for each of the N = 11 H3.3.1 EMLO formation experiments with similar results a, b. The experiment in df was performed N = 1 time with a parallel analysis performed using the scRNAseq data.
Fig. 4
Fig. 4. Quantification of neuron specialization and neurotransmission phenotypes in EMLOs.
a Distribution of neural progenitors (TUBB3 OR MAP2, blue) and neurons (TUBB3 AND MAP2, orange) in day 16 H3.3.1 EMLOs by scRNAseq (left). Canonical neuronal differentiation genes are shown (log2Exp) (right). b Proportion of specialized neurons generally classified as motor (MNX1/TUBB3, blue), sensory (POU4F1/TUBB3, orange), and autonomic (PHOX2B/ASCL1, purple) at day 16. Cluster 10 is expanded. c Proportion of neurotransmission phenotypes generally classified as excitatory (blue), inhibitory (orange), serotonergic (purple), dopaminergic (blue), and cholinergic (green) at day 16. d Inhibitory (GPHN in cyan, GAD65&67 in magenta) and excitatory (PSD-95 in cyan, VGlut1 in magenta) neurotransmission biomarkers in SC at day 40 (N = 2 repeat experiments). Individual scale bars provided.
Fig. 5
Fig. 5. Neuronal cytoarchitectures are reproducibly patterned in close relationship to the gut tube.
a Change in diameter of spinal cord (SC) compartment from days 13 to 22 (n = 47 EMLOs measured per line). b Change in TUJ1 density by normalized fluorescence of Z-stack volumes between days 13, 16, and 22 (n = 3 EMLOs per time point per line). c TUJ1 (red) and GATA4 (cyan) IF of F3.5.2 and H3.3.1 day 16 EMLOs. Peripheral ganglion formation (dotted circle) and neuronal bottleneck (red arrows) are appreciated. ImageJ inverted LUT (TUJ1) was used for black and white images. d Multi-dimensional visualization of gut tube-neuron interaction in H3.3.1 day 16 EMLO. Sagittal and transverse planes of gut tube subsumed by neural processes (left); end-on view of neuronal tunnel (TUJ1+, top) about gut tube (DAPI, bottom). e TUJ1/GATA4 of H3.3.1 day 22 EMLO. Maximally projected Z-stack (left, Z-total) is shown with two Z-slices (Z1, Z2). SC and ME labeled for orientation. Peripheral ganglia form in close proximity to gut tube anterior intestinal portal-like (AIP) region. Z2 inset depicts 3D undulating GATA4 exterior with interpenetrating neurons. High magnification TUJ1 reconstruction shown (right). For IF, GATA4 and TUJ1 staining was performed in each of the N = 11 H3.3.1 EMLO formation experiments with similar results ce. Individual scale bars provided. Data reported as (mean ±s.e.m.).
Fig. 6
Fig. 6. Gut tube formation events impact neuronal patterning.
ab Dual SMAD small molecule inhibitors LDN 193189 (LDN) and SB 431542 (SB) added before the EMLO elongation phase opposes mesenchymal and endodermal elongation a, and was quantified in b in representative ED-iPSC lines F3.5.2 (****p < 0.0001, t = 4.518, df = 61), H3.3.1 (****p < 0.0001, t = 7.293, df = 61), A2.1.1 (****p < 0.0001, t = 6.723, df = 61) by unpaired two-tailed t test. n = number of EMLOs counted (day 22). N = 3 biological replicates performed with similar results. Eight to 45 fields were analyzed per condition and data were quantified per field. Violin plot statistics are as follows: F3.5.2 (DMSO: max = 40, min = 0, median = 15.48, q1 = 0, q3 = 25.89; LDN + SB: max = 100, min = 0, median = 15.48, q1 = 25, q3 = 66.25); H3.3.1 (DMSO: max = 50, min = 0, median = 0, q1 = 0, q3 = 11.90; LDN + SB: max = 100, min = 0, median = 33.33, q1 = 18.33, q3 = 58.57); A.2.1.1 (DMSO: max = 48.86, min = 0, median = 13.39, q1 = 0, q3 = 20; LDN + SB: max = 100, min = 0, median = 60, q1 = 32.05, q3 = 73.21). c Identification of competing neuronal versus endodermal transcriptional programs in cluster 8 in day 16 H3.3.1 EMLOs by scRNAseq. Canonical endoderm markers FOXA2 and EPCAM were co-expressed with TUBB3 (243 cells). A subset of FOXA2/EPCAM/TUBB3 triple-positive cells (blue) also expressed MAP2 (128 cells, orange) and then further expressed SOX17 (16 cells, green). Cluster 8 is expanded. This phenomenon was previously described in vivo for enteric nervous system development. d IF of FOXA2 and TUJ1 in day 40 H3.3.1 EMLOs. High magnification Z-slices depict the emergence of FOXA2 + neurons in support of the dual embryonic origin model of the mammalian ENS. FOXA2 and TUJ1 staining on day 40 H3.3.1 EMLOs was performed in N = 3 biological replicate experiments with similar results. Individual scale bars provided. Data reported as (mean ± s.e.m.).
Fig. 7
Fig. 7. Diverging NCC lineages populate the ME.
a Two SOX10-expressing neural crest cell (NCC) populations are distinguished by TFAP2A expression (purple) and non-expression (red) in day 16 EMLOs by scRNAseq. NCC cluster 14 is expanded. b TFAP2α (magenta) and SOX10 (cyan) double-positive cells in day 6 H3.3.1 EMLO (top) and diverging NCC lineages by distinct SOX10/TFAP2α immunostaining in day 20 EMLO (middle). High magnification representative day 20 EMLO is shown (bottom). White dotted arrows depict potential NCC migration about the gut tube. c Two TFAP2A-expressing NCC populations are distinguished by TUBB3 expression (blue) and non-expression (orange) (top). The NCC cluster 14 is expanded. The subsets of putative neuronal (TFAP2α+ in green, TUJ1+ in red) and non-neuronal (TFAP2α+, TUJ1−) NCCs are visualized as well by IF that is best seen at the ganglion in the white dotted box (bottom). TFAP2α signal is higher outside of the ganglion. d EMLOs lacking the spinal cord (SC) compartment does not contain NCCs, supporting an origin in SC. e N-cadherin (cyan) expression restricted to SC and the gut tube anterior pole, counterstained with ZO-1 (magenta) and shown at days 13 and 16. High magnification images provided. f ISL1 (green) and BMP2/4 (ref) IF in day 22 H3.3.1 EMLOs. ISL1+ cellular pools in proximity to the gut tube are observed in both lines, and increased expression in budding regions of the tube versus non-budding regions. High magnification ISL1 colocalization with TUJ1 is shown (right). NCC biomarkers were stained in H3.3.1 EMLOs in N = 8 of 11 formation experiments, and N = 3 formation experiments for the other representative lines. g Histogram of TFAP2α (purple) and SOX10 (yellow) positive nuclei in mesoderm–endoderm (ME) over time at day 13 (n = 5 EMLOs TFAP2α, n = 6 EMLOs SOX10) versus day 22 (n = 7 EMLOs TFAP2α, n = 8 EMLOs SOX10) in H3.3.1 EMLOs. (unpaired two-tailed t test **p = 0.0033, t = 3.814, df = 10 TFAP2α; ***p = 0.0004, t = 4.873, df = 12). h Plot of cell number (DAPI/TUJ1) per ganglion over time at day 13 (n = 10 EMLOs) versus day 22 (n = 9 EMLOs) in H3.3.1 EMLOs (****p < 0.0001, t = 5.854, df = 17). Data reported as (mean ±s.e.m.). i Histogram quantification of EMLOs with neuronal ganglionic structures in ME in F3.5.2 (n = 25), H3.3.1 (n = 31), and A2.1.1 (n = 19) ED-hiPSC lines at day 22 (median). Colors denote N = 3 separate formation experiments. Individual scale bars provided.
Fig. 8
Fig. 8. NCC trajectories mimic in vivo events in EMLOs.
a Cluster 14 scRNAseq annotation as NCC by combined expression of SOX10, FOXD3, and S100B. b Schematic representation of neural tube cross-section depicts NCC in vivo developmental steps: pre-EMT (1), delamination/EMT (2), fate-biased lineage migration (3), and lineage commitment (4) to establish autonomic (yellow), sensory (blue), and mesenchymal (purple) anatomic derivatives. DRG (dorsal root ganglia), PVG (prevertebral ganglia), Ao (aorta). c Peripheral neuron biomarker peripherin (red) in mesoderm–endoderm (ME) compartment (N = 2 repeat experiments). Individual scale bar is shown. d Updated NCC model by Soldatov et al. depicts developmental events described in b and the implicated genes. e Transcripts from the NCC processes labeled 1–4 as in b, d by scRNAseq in day 16 EMLOs (log2Exp). We infer that, in general, cells progress from the roof plate (cluster 15) and spinal cord (clusters 4, 9) as they undergo EMT to cluster 14 and express transcripts associated with fate-biased migration. Lineage-committed transcriptional programs are also detected for sensory and autonomic neurons, glia, and mesenchyme.
Fig. 9
Fig. 9. Modeling mu opioid receptor modulation in EMLO-derived neuronal cultures.
a TUJ1 (cyan) and OPRM1 (magenta) IF in day 22 H3.3.1 EMLO. High magnification images provided (bottom-left) with multi-dimensional view of gut tube (bottom-right). b Top: OPRM1 expression in apical aspect of neural rosettes and basal neurons. Bottom: TFAP2α expression at the basal aspect of GABAergic rosettes. c Fluo-4 AM in dissociated EMLO cultures. High magnification image with example soma ROI (right). d 2D adherent spinal sensory neurons (top, TUJ1 in blue, BRN3A in magenta) and spinal motor neurons (bottom, TUJ1 in green, Nkx-6.1 in red) used as controls for opioid-responsive firing. IF of MOR was performed in N = 3 separate H3.3.1 EMLO formation experiments with similar results. e Examples of calcium transients quantified in dissociated EMLO neuronal soma using Fluo-4 AM. Shown are no calcium transients (none), one transient (single), or multiple transients (multiple) within a 1.5 min acquisition window. f Histogram of percent of neurons with multiple calcium transients. EMLO-dissociated cultures were compared with spinal sensory neurons (positive control) and spinal motor neurons (negative control). Baseline firing in BrainPhys (blue) was compared to addition of 1 μM DAMGO (tan), followed by 10 μM naloxone in the same cultures (light blue). n = number of neurons quantified. Statistical p values are as follows from left-to-right on the plot: **p = 0.0031, **p = 0.002, n.s. p = 0.766; ***p = 0.001, *p = 0.014, n.s. p = 0.972; n.s. p = 0.593, n.s. p = 0.64, n.s. p = 0.94). Violin plot statistics are as follows: EMLO-derived (BrainPhys: max = 47, min = 13, median = 29, q1 = 29, q3 = 39; BrainPhys + DAMGO: max = 32, min = 7, median = 11, q1 = 9, q3 = 15; BrainPhys + DAMGO + naloxone: max = 47, min = 32, median = 27, q1 = 21, q3 = 39); spinal sensory (BrainPhys: max = 48, min = 27, median = 37, q1 = 28, q3 = 46; BrainPhys + DAMGO: max = 16, min = 6, median = 10, q1 = 6, q3 = 14; BrainPhys + DAMGO + naloxone: max = 59, min = 7, median = 36, q1 = 19, q3 = 44); spinal motor (BrainPhys: max = 35, min = 15, median = 32; BrainPhys + DAMGO: max = 38, min = 23, median = 31, q1 = 25, q3 = 35; BrainPhys + DAMGO + naloxone: max = 38, min = 14, median = 29, q1 = 22, q3 = 34). Data reported as (mean ± s.e.m.). Individual scale bars provided.
Fig. 10
Fig. 10. EMLO gastruloid models of human developmental events.
a Schematic representation of human embryo. Cervical through coccygeal regions are labeled (C cervical, T thoracic, L lumbar, S sacral, Cx coccygeal). Primitive gut tube (blue) is shown in proximity to developing heart (pink) and spinal cord (red). Dotted circle represents the anatomic regions reflected in EMLO gastruloids and direction arrows indicate neural crest cell (NCC) migration. The anterior (A) and posterior (P) axis is shown. b Proposed model for neurogenesis, NCC migration and connectivity patterns in EMLOs including peripheral ganglion formation (green) and target innervation (top); proposed multi-lineage NCC behavior in EMLOs that parallels in vivo events (bottom). Neuroectodermal NCCs are shown in three colors (blue, red, green) to denote separate lineages during fate-biased migration, such as for vagal, trunk, and cardiac NCCs. Later-stage enteric neurons arising from endoderm are denoted in pink and blue.

References

    1. Sasai Y. Cytosystems dynamics in self-organization of tissue architecture. Nature. 2013;493:318–326. doi: 10.1038/nature11859. - DOI - PubMed
    1. Clevers H. Modeling development and disease with organoids. Cell. 2016;165:1586–1597. doi: 10.1016/j.cell.2016.05.082. - DOI - PubMed
    1. Faustino Martins JM, et al. Self-organizing 3D human trunk neuromuscular organoids. Cell Stem Cell. 2020;26:172–186. doi: 10.1016/j.stem.2019.12.007. - DOI - PubMed
    1. Sahu S, Sharan SK. Translating embryogenesis to generate organoids: novel approaches to personalized medicine. iScience. 2020;23:101485. doi: 10.1016/j.isci.2020.101485. - DOI - PMC - PubMed
    1. van den Brink SC, et al. Symmetry breaking, germ layer specification and axial organization in aggregates of mouse embryonic stem cells. Development. 2014;141:4231–4242. doi: 10.1242/dev.113001. - DOI - PMC - PubMed

Publication types