

Enhanced dengue vaccine virus replication and neutralizing antibody responses in immune primed rhesus macaques
- PMID: 34021159
- PMCID: PMC8140083
- DOI: 10.1038/s41541-021-00339-y
Enhanced dengue vaccine virus replication and neutralizing antibody responses in immune primed rhesus macaques
Abstract
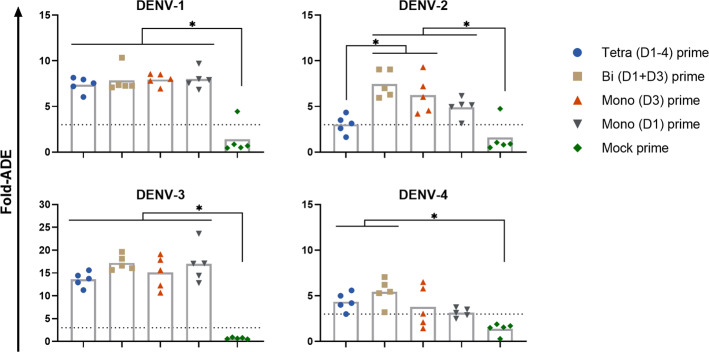
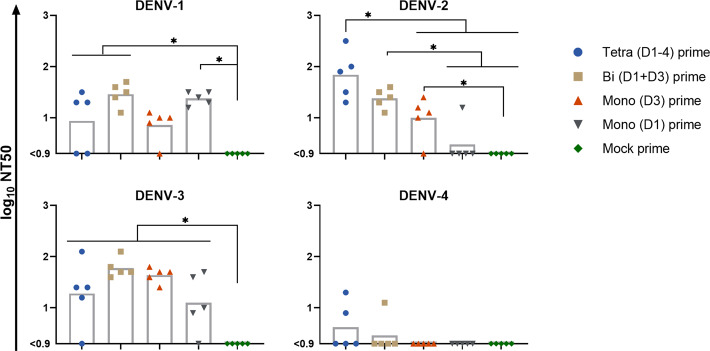
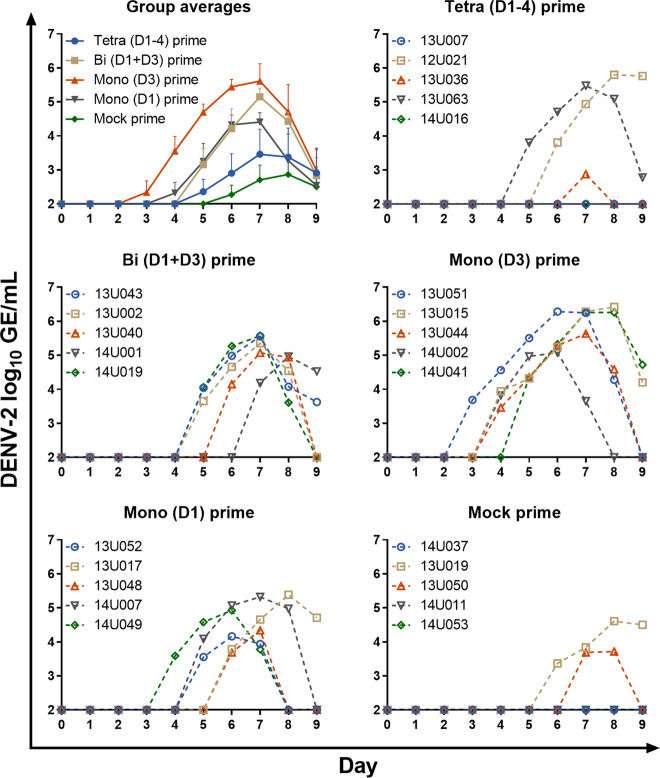
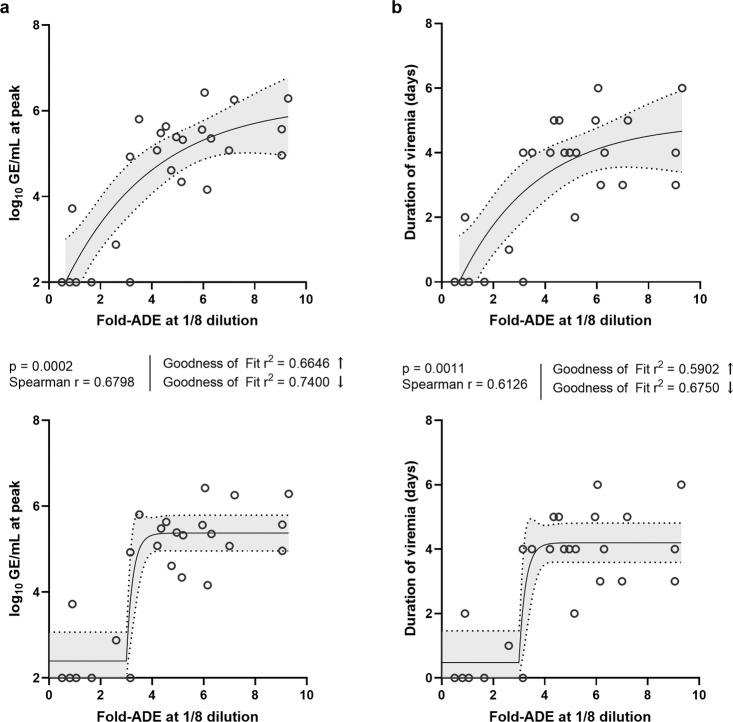
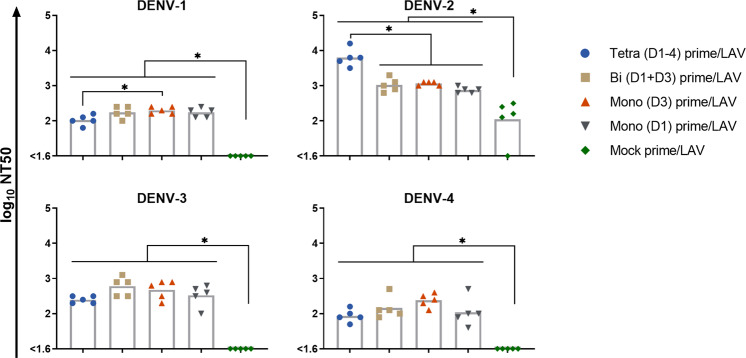
Antibody-dependent enhancement (ADE) is suspected to influence dengue virus (DENV) infection, but the role ADE plays in vaccination strategies incorporating live attenuated virus components is less clear. Using a heterologous prime-boost strategy in rhesus macaques, we examine the effect of priming with DENV purified inactivated vaccines (PIVs) on a tetravalent live attenuated vaccine (LAV). Sera exhibited low-level neutralizing antibodies (NAb) post PIV priming, yet moderate to high in vitro ADE activity. Following LAV administration, the PIV primed groups exhibited DENV-2 LAV peak viremias up to 1,176-fold higher than the mock primed group, and peak viremia correlated with in vitro ADE. Furthermore, PIV primed groups had more balanced and higher DENV-1-4 NAb seroconversion and titers than the mock primed group following LAV administration. These results have implications for the development of effective DENV vaccine prime-boost strategies and for our understanding of the role played by ADE in modulating DENV replication.
Conflict of interest statement
The authors declare no competing interests.
Figures

Similar articles
-
Immunogenicity of a Live-Attenuated Dengue Vaccine Using a Heterologous Prime-Boost Strategy in a Phase 1 Randomized Clinical Trial.J Infect Dis. 2021 May 28;223(10):1707-1716. doi: 10.1093/infdis/jiaa603. J Infect Dis. 2021. PMID: 32966573 Clinical Trial.
-
Protection against dengue virus by non-replicating and live attenuated vaccines used together in a prime boost vaccination strategy.Virology. 2010 Jan 20;396(2):280-8. doi: 10.1016/j.virol.2009.10.023. Epub 2009 Nov 13. Virology. 2010. PMID: 19913867
-
Dengue and Zika Virus Domain III-Flagellin Fusion and Glycan-Masking E Antigen for Prime-Boost Immunization.Theranostics. 2019 Jul 9;9(16):4811-4826. doi: 10.7150/thno.35919. eCollection 2019. Theranostics. 2019. PMID: 31367259 Free PMC article.
-
Modulation of Dengue/Zika Virus Pathogenicity by Antibody-Dependent Enhancement and Strategies to Protect Against Enhancement in Zika Virus Infection.Front Immunol. 2018 Apr 23;9:597. doi: 10.3389/fimmu.2018.00597. eCollection 2018. Front Immunol. 2018. PMID: 29740424 Free PMC article. Review.
-
Paradoxical role of antibodies in dengue virus infections: considerations for prophylactic vaccine development.Expert Rev Vaccines. 2016;15(4):467-82. doi: 10.1586/14760584.2016.1121814. Epub 2015 Dec 15. Expert Rev Vaccines. 2016. PMID: 26577689 Review.
Cited by
-
Post-genomic platform for development of oligonucleotide vaccines against RNA viruses: diamond cuts diamond.Inflamm Res. 2022 Aug;71(7-8):729-739. doi: 10.1007/s00011-022-01582-2. Epub 2022 May 6. Inflamm Res. 2022. PMID: 35523969 Free PMC article.
-
DENV-specific IgA contributes protective and non-pathologic function during antibody-dependent enhancement of DENV infection.PLoS Pathog. 2023 Aug 28;19(8):e1011616. doi: 10.1371/journal.ppat.1011616. eCollection 2023 Aug. PLoS Pathog. 2023. PMID: 37639455 Free PMC article.
-
Anti-coronavirus vaccines will not accelerate the transition of humanity to a non-pandemic period, but the pandemic will take fewer victims.Inflamm Res. 2022 Jun;71(5-6):521-536. doi: 10.1007/s00011-022-01567-1. Epub 2022 Apr 10. Inflamm Res. 2022. PMID: 35397666 Free PMC article. Review.
-
Monomeric IgA Antagonizes IgG-Mediated Enhancement of DENV Infection.Front Immunol. 2021 Nov 24;12:777672. doi: 10.3389/fimmu.2021.777672. eCollection 2021. Front Immunol. 2021. PMID: 34899736 Free PMC article.
-
Antibody-Dependent Enhancement (ADE) and the role of complement system in disease pathogenesis.Mol Immunol. 2022 Dec;152:172-182. doi: 10.1016/j.molimm.2022.11.010. Epub 2022 Nov 10. Mol Immunol. 2022. PMID: 36371813 Free PMC article. Review.
References
-
- Rashmi MV, Hamsaveena Haematological and biochemical markers as predictors of dengue infection. Malays. J. Pathol. 2015;37:247–251. - PubMed
LinkOut - more resources
Full Text Sources
Other Literature Sources
