Spectroscopic and deep learning-based approaches to identify and quantify cerebral microhemorrhages
- PMID: 34021170
- PMCID: PMC8140127
- DOI: 10.1038/s41598-021-88236-1
Spectroscopic and deep learning-based approaches to identify and quantify cerebral microhemorrhages
Abstract
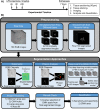
Cerebral microhemorrhages (CMHs) are associated with cerebrovascular disease, cognitive impairment, and normal aging. One method to study CMHs is to analyze histological sections (5-40 μm) stained with Prussian blue. Currently, users manually and subjectively identify and quantify Prussian blue-stained regions of interest, which is prone to inter-individual variability and can lead to significant delays in data analysis. To improve this labor-intensive process, we developed and compared three digital pathology approaches to identify and quantify CMHs from Prussian blue-stained brain sections: (1) ratiometric analysis of RGB pixel values, (2) phasor analysis of RGB images, and (3) deep learning using a mask region-based convolutional neural network. We applied these approaches to a preclinical mouse model of inflammation-induced CMHs. One-hundred CMHs were imaged using a 20 × objective and RGB color camera. To determine the ground truth, four users independently annotated Prussian blue-labeled CMHs. The deep learning and ratiometric approaches performed better than the phasor analysis approach compared to the ground truth. The deep learning approach had the most precision of the three methods. The ratiometric approach has the most versatility and maintained accuracy, albeit with less precision. Our data suggest that implementing these methods to analyze CMH images can drastically increase the processing speed while maintaining precision and accuracy.
Conflict of interest statement
The authors declare no competing interests.
Figures


Similar articles
-
Cerebral venous congestion exacerbates cerebral microhemorrhages in mice.Geroscience. 2022 Apr;44(2):805-816. doi: 10.1007/s11357-021-00504-0. Epub 2022 Jan 6. Geroscience. 2022. PMID: 34989944 Free PMC article.
-
Repeated Valsalva maneuvers promote symptomatic manifestations of cerebral microhemorrhages: implications for the pathogenesis of vascular cognitive impairment in older adults.Geroscience. 2018 Dec;40(5-6):485-496. doi: 10.1007/s11357-018-0044-9. Epub 2018 Oct 4. Geroscience. 2018. PMID: 30288646 Free PMC article.
-
Comparative analysis of H&E and Prussian blue staining in a mouse model of cerebral microbleeds.J Histochem Cytochem. 2014 Nov;62(11):767-73. doi: 10.1369/0022155414546692. Epub 2014 Jul 25. J Histochem Cytochem. 2014. PMID: 25063000 Free PMC article.
-
Use of Deep Learning to Develop and Analyze Computational Hematoxylin and Eosin Staining of Prostate Core Biopsy Images for Tumor Diagnosis.JAMA Netw Open. 2020 May 1;3(5):e205111. doi: 10.1001/jamanetworkopen.2020.5111. JAMA Netw Open. 2020. PMID: 32432709 Free PMC article.
-
Automatic Segmentation of Multiple Organs on 3D CT Images by Using Deep Learning Approaches.Adv Exp Med Biol. 2020;1213:135-147. doi: 10.1007/978-3-030-33128-3_9. Adv Exp Med Biol. 2020. PMID: 32030668 Review.
Cited by
-
A Novel Detection and Classification Framework for Diagnosing of Cerebral Microbleeds Using Transformer and Language.Bioengineering (Basel). 2024 Sep 30;11(10):993. doi: 10.3390/bioengineering11100993. Bioengineering (Basel). 2024. PMID: 39451369 Free PMC article.
-
Semi-automated protocol to quantify and characterize fluorescent three-dimensional vascular images.PLoS One. 2024 May 16;19(5):e0289109. doi: 10.1371/journal.pone.0289109. eCollection 2024. PLoS One. 2024. PMID: 38753706 Free PMC article.
-
Development of cerebral microhemorrhages in a mouse model of hypertension.J Neuroinflammation. 2025 Mar 5;22(1):67. doi: 10.1186/s12974-025-03378-7. J Neuroinflammation. 2025. PMID: 40045320 Free PMC article.
References
Publication types
MeSH terms
Grants and funding
- P41EB015890/NH/NIH HHS/United States
- T32 HL116270/HL/NHLBI NIH HHS/United States
- R21AG066000/National Institutes of Health,United States
- R01NS020989/NH/NIH HHS/United States
- TL1 TR001415/TR/NCATS NIH HHS/United States
- R21NS111984/National Institutes of Health,United States
- P41 EB015890/EB/NIBIB NIH HHS/United States
- 5TL1TR001415/NH/NIH HHS/United States
- R21 NS111984/NS/NINDS NIH HHS/United States
- NRF-2018K1A4A3A02060572/National Research Foundation of Korea
- R21 AG066000/AG/NIA NIH HHS/United States
- R01 NS020989/NS/NINDS NIH HHS/United States
LinkOut - more resources
Full Text Sources
Other Literature Sources

