. 2021 May 21;11(1):10719.
doi: 10.1038/s41598-021-90002-2.

Fluorescence Fluctuation Spectroscopy enables quantification of potassium channel subunit dynamics and stoichiometry

Affiliations

Fluorescence Fluctuation Spectroscopy enables quantification of potassium channel subunit dynamics and stoichiometry

Giulia Tedeschi et al. Sci Rep. .

Abstract

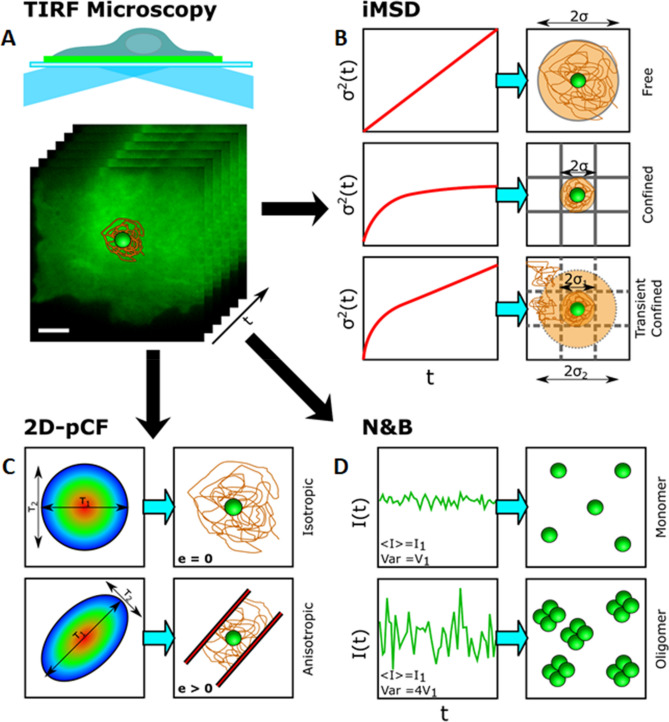
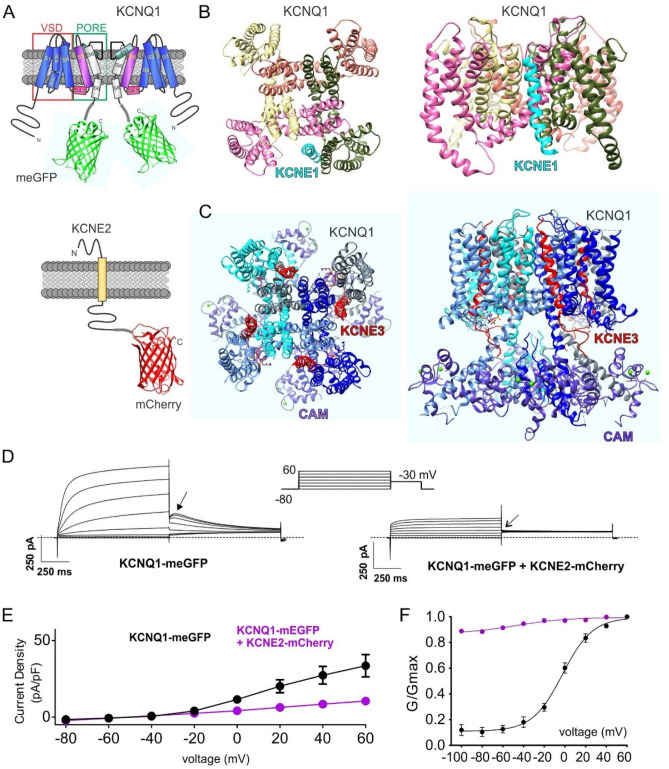
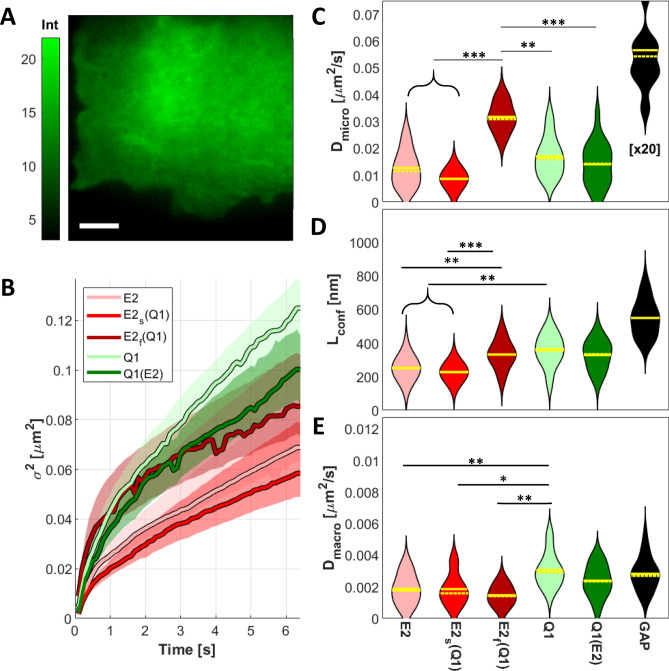
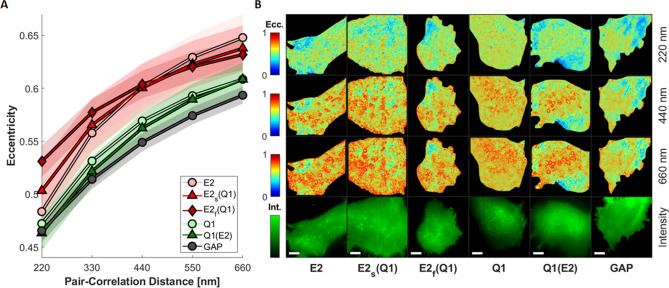
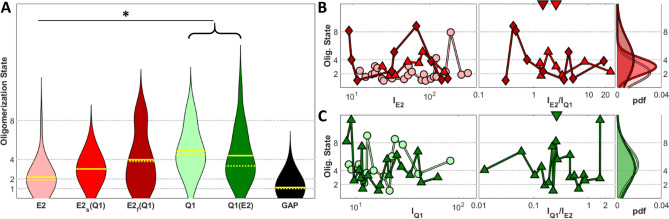
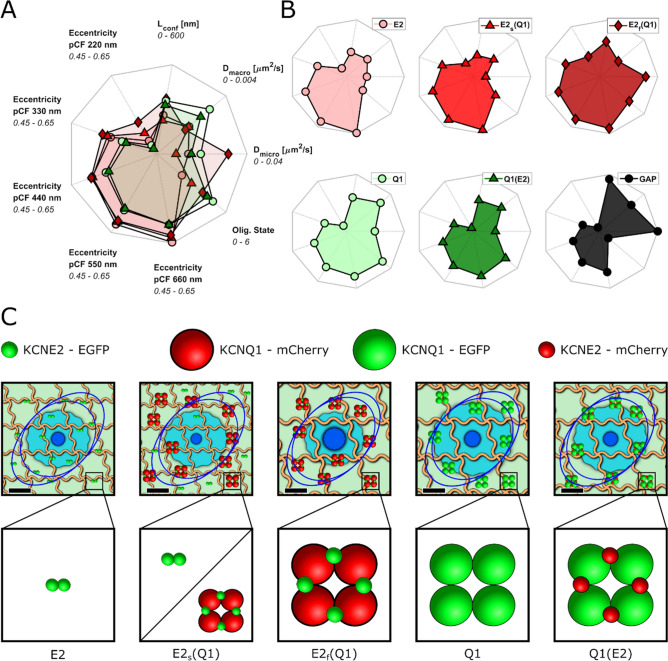
Voltage-gated potassium (Kv) channels are a family of membrane proteins that facilitate K+ ion diffusion across the plasma membrane, regulating both resting and action potentials. Kv channels comprise four pore-forming α subunits, each with a voltage sensing domain, and they are regulated by interaction with β subunits such as those belonging to the KCNE family. Here we conducted a comprehensive biophysical characterization of stoichiometry and protein diffusion across the plasma membrane of the epithelial KCNQ1-KCNE2 complex, combining total internal reflection fluorescence (TIRF) microscopy and a series of complementary Fluorescence Fluctuation Spectroscopy (FFS) techniques. Using this approach, we found that KCNQ1-KCNE2 has a predominant 4:4 stoichiometry, while non-bound KCNE2 subunits are mostly present as dimers in the plasma membrane. At the same time, we identified unique spatio-temporal diffusion modalities and nano-environment organization for each channel subunit. These findings improve our understanding of KCNQ1-KCNE2 channel function and suggest strategies for elucidating the subunit stoichiometry and forces directing localization and diffusion of ion channel complexes in general.


Conflict of interest statement

The authors declare no competing interests.

Figures

Figure 1
Figure 1
Schematic representation of the imaging and analysis approach. (A) Image sequences are acquired using a TIRF microscope. (B) Representative iMSD curves for different diffusion models (left) and their interpretation including free, confined and transient confined motions (right). (C) Example of local 2D pair correlation functions, 2D- pCF, (left) and their interpretation of either isotropic or anisotropic diffusion (right). (D) Temporal fluorescence fluctuation intensities for different oligomerization states (left) and their interpretation (right) obtained from Number and Brightness analysis.
Figure 2
Figure 2
Fluorescent-tagged KCNQ1 and KCNQ1-KCNE2 express normal currents. (A) Transmembrane topologies of KCNQ1 and KCNE2 subunits showing fluorescent protein tagging of the cytosolic domains. (B) Extracellular (left) and intramembrane (right) views of structural model of KCNQ1-KCNE1 complex5. (C) Extracellular (left) and intramembrane (right) views of cryo-electron microscopy-resolved structure of KCNQ1-PIP2-KCNE3-calmodulin complex8. CAM = calmodulin. (D) Exemplary traces showing whole-cell patch-clamp recordings from CHO cells transfected with the subunit combinations shown. Dotted line indicates zero current level. Upper inset shows the voltage protocol. Arrows indicate tail current features. (E) Mean pre-pulse current density ± SEM for currents expressed by KCNQ1-meGFP alone (black) (n = 14) or with KCNE2-mCherry (purple) (n = 12). (F) Mean G/Gmax relationship ± SEM measured from tail currents at arrows in panel D for currents expressed by KCNQ1-meGFP alone (black) (n = 14) or with KCNE2-mCherry (purple) (n = 12).
Figure 3
Figure 3
Representative average intensity image (A) of a CHO cell transfected with KCNE2-mEGFP. Average iMSD curves (colored curves) (B) with 95% confidence interval (shaded areas) for the conditions considered. Violin plots of the parameters obtained from the fitting with a transient confined model: Dmicro (C), Lconf (D) and Dmacro (E). The value of Dmicro for GAP-mEGFP is 20 times the one shown in the graph (reported as [× 20]). Scale bar in A is 5 µm. Solid and dashed yellow lines represent the mean and the median of the distributions, respectively. Asterisks represent P-values < 0.05 (*), < 0.01 (**) and < 0.001 (***). P-values were obtained from Tukey's multiple comparison test. The conditions comprised in brackets are not statistically different (P > 0.5) among them but they are statistically significant compared to the other condition considered, with the displayed P-value.
Figure 4
Figure 4
Median eccentricity as a function of the pCF distance considered (A), shaded areas represent the 95% confidence interval. B: Representative 2D-pCF eccentricity images computed at different distances and relative intensity images (bottom). Scale bar is 5 µm.
Figure 5
Figure 5
Violin plot for the oligomerization state as obtained by N&B analysis (A) for the samples considered. Dependence of the oligomerization state for the KCNE2-meGFP (B) and KCNQ1-meGFP (C) samples with the expression (left, represented by the average intensity of the meGFP channel) or co-expression (center, represented as the ratio between the average intensity of the meGFP and the mCherry channels) level, together with the corresponding probability density functions (right). Downward facing triangles in B and C represent the median co-expression level. Solid and dashed yellow lines represent the mean and the median of the distributions, respectively. Asterisks represent P-values < 0.05 (*), < 0.01 (**) and < 0.001 (***). P-values were obtained from Tukey's multiple comparison test. Symbols in B and C represent the median value obtained from a single cell. The conditions comprised in brackets are not statistically different among them (P > 0.5) but they are statistically significant compared to the other condition considered, with the displayed P-value. IE2 and IQ1 denote the average intensity of KCNE2 and KCNQ1, respectively.
Figure 6
Figure 6
Combined (A) and individual (B) spider plots for all the conditions considered. (C) Comprehensive schematic representation of the diffusional nano-environment together with the model of the oligomerization state for the KCNQ1-KCNE2 complex. Scale bar for the model is 200 nm and proteins are shown 10 × their actual size. The dark blue and light blue circles represent the area covered by the diffusion of the protein in 0.5 s (calculated from Dmicro) and 60 s (calculated from Dmacro), respectively. Orange lines represent the nano-domains and the blue ellipses show the eccentricity as short scale (220 nm, internal ellipse) and long scale (660 nm, external ellipse).

Similar articles

Cited by

References

    1. Goldstein SAN. K2P potassium channels, mysterious and paradoxically exciting. Sci. Signal. 2011 doi: 10.1126/scisignal.2002225. - DOI - PMC - PubMed
    1. Coetzee WA, et al. Molecular diversity of K+ channels. Ann. N. Y. Acad. Sci. 1999 doi: 10.1111/j.1749-6632.1999.tb11293.x. - DOI - PubMed
    1. Kim DM, Nimigean CM. Voltage-gated potassium channels: a structural examination of selectivity and gating. Cold Spring Harb. Perspect. Biol. 2016 doi: 10.1101/cshperspect.a029231. - DOI - PMC - PubMed
    1. Greene DL, Hoshi N. Modulation of Kv7 channels and excitability in the brain. Cell. Mol. Life Sci. 2017 doi: 10.1007/s00018-016-2359-y. - DOI - PMC - PubMed
    1. Panaghie G, Abbott GW. The role of S4 charges in voltage-dependent and voltage-independent KCNQ1 potassium channel complexes. J. Gen. Physiol. 2007 doi: 10.1085/jgp.200609612. - DOI - PMC - PubMed

Publication types

Substances