. 2021 May 21;11(1):10714.
doi: 10.1038/s41598-021-88906-0.

Glucose and NAADP trigger elementary intracellular β-cell Ca2+ signals

Affiliations

Glucose and NAADP trigger elementary intracellular β-cell Ca2+ signals

Paula Maria Heister et al. Sci Rep. .

Abstract

Pancreatic β-cells release insulin upon a rise in blood glucose. The precise mechanisms of stimulus-secretion coupling, and its failure in Diabetes Mellitus Type 2, remain to be elucidated. The consensus model, as well as a class of currently prescribed anti-diabetic drugs, are based around the observation that glucose-evoked ATP production in β-cells leads to closure of cell membrane ATP-gated potassium (KATP) channels, plasma membrane depolarisation, Ca2+ influx, and finally the exocytosis of insulin granules. However, it has been demonstrated by the inactivation of this pathway using genetic and pharmacological means that closure of the KATP channel alone may not be sufficient to explain all β-cell responses to glucose elevation. We have previously proposed that NAADP-evoked Ca2+ release is an important step in stimulus-secretion coupling in pancreatic β-cells. Here we show using total internal reflection fluorescence (TIRF) microscopy that glucose as well as the Ca2+ mobilising messenger nicotinic acid adenine dinucleotide phosphate (NAADP), known to operate in β-cells, lead to highly localised elementary intracellular Ca2+ signals. These were found to be obscured by measurements of global Ca2+ signals and the action of powerful SERCA-based sequestration mechanisms at the endoplasmic reticulum (ER). Building on our previous work demonstrating that NAADP-evoked Ca2+ release is an important step in stimulus-secretion coupling in pancreatic β-cells, we provide here the first demonstration of elementary Ca2+ signals in response to NAADP, whose occurrence was previously suspected. Optical quantal analysis of these events reveals a unitary event amplitude equivalent to that of known elementary Ca2+ signalling events, inositol trisphosphate (IP3) receptor mediated blips, and ryanodine receptor mediated quarks. We propose that a mechanism based on these highly localised intracellular Ca2+ signalling events mediated by NAADP may initially operate in β-cells when they respond to elevations in blood glucose.


Conflict of interest statement

The authors declare no competing interests.

Figures
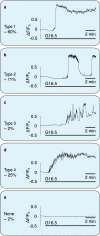
Figure 1
Figure 1
Classification of β-cell sub-membrane Ca2+ responses to elevation in glucose as recorded with TIRF. Responses to 16.5 mM glucose at 37° C in mouse primary pancreatic β-cells. n = 239. Responses from 1,017 cells were analysed overall. Percentages are of 239 control cells of male WT mice of one genetic background to exclude potential genetic- or sex differences in response type distribution. Approximately 96% showed a prominent global calcium response. In 116 cells, 16.5 mM glucose evoked a mean peak height of 2.4 ± 0.01 ΔF/F0. (a) The most common response (type 1, ca. 60% of responses) resembles the standardized triphasic response. (b) The slow Ca2+ oscillations classified as type 2 often occurred at periods of ca. 5 min. (c) Response type 3 consists of numbers of large transients superimposed on a slow increase in Ca2+. These responses were rare (ca. 2%). (d) Type 4 responses (ca. 25%) resemble the triphasic response, but with a less steep Ca2+ rise. (e) A very small number of cells did not respond to glucose (ca. 2%).
Figure 2
Figure 2
Localised and global Ca2+ responses. Responses of a β-cell cluster (3 cells) after NAADP-AM addition as observed using TIRF microscopy in the presence of 5 mM EGTA. (a) Baseline fluorescence. (bh) Localized Ca2+ release events (for illustrative purposes, larger events were selected). (i) Global Ca2+ influx. (jl) Intensity profiles of a β-cell cluster, (j) at baseline, (k) in the presence of an elementary event after addition of NAADP-AM, (l) during global Ca2+ influx. Images are pseudocoloured with warmer colours representing higher levels of fluorescence. (m) Representative trace of a β-cell showing spiking Ca2+ events triggered by NAADP-AM. Maximum intensity change normalised to baseline is plotted against time. Extracellular Ca2+ was re-admitted at the end of the experiment; leading to a global Ca2+ response.
Figure 3
Figure 3
Quantification of calcium release events in response to glucose and NAADP-AM in low EGTA (100 μM). (ac) Representative TIRF traces of β-cells stimulated with: (a) 100 nM NAADP-AM after preincubation with thapsigargin, (b) 16.5 mM glucose after preincubation with thapsigargin, (c) 6 mM glucose without thapsigargin preincubation. (d) Epifluorescence recording (all other parameters equal) using 6 mM glucose without thapsigargin preincubation. Maximum intensity change of subsequent frames after normalising to baseline plotted against time. Insets show magnified events for each of the three experimental stimuli, chosen to illustrate the variation in event size. (eg) Percentage of frames showing elementary events (defined as events of an amplitude more than 2 standard deviations above baseline mean) before (baseline) and after stimulus addition. (e) NAADP-AM; n = 20 (8 experiments, 4 Animals), t(19) = 7.90, p < 0.01, 90% response rate. (f) 16.5 mM glucose; n = 14 (6 experiments, 4 Animals), t(13) = 7.44, p < 0.01, 100% response rate. (g) 6 mM glucose; n = 18 (6 experiments, 6 Animals), t(17) = 2.61, p < 0.01, 50% response rate. * denotes significance; paired samples, one-tailed t-tests.
Figure 4
Figure 4
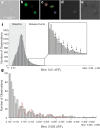
Quantal analysis of elementary events. (ae) Illustration of spark analysis, including examples of elementary release events in response to 16.5 mM glucose detected by normalisation, frame by frame and background subtraction in 3 individual β-cells: (a) Original brightfield, (b) TIRF, (c) Boundaries used in detection analysis, (de) Individual events isolated by analysis. Note that images of glucose-induced events were chosen for illustration of the analysis mechanism; quantal analysis was carried out exclusively on NAADP-AM stimulated cells. (f) Frequency histogram of maximum intensity change after NAADP-AM Stimulation (n = 20), the vertical line at 0.44 ΔF/F0 denotes 2 standard deviations above baseline mean. (g) Frequency histogram of mean event amplitudes across areas of interest (n = 51) within a single cell cluster stimulated with NAADP-AM in the presence of 5 mM EGTA. The five peaks of the putative modal distribution in the data were selected as means for individual Gaussian distributions; and 3–4 bins to their left and right used to calculate the respective distribution’s standard deviation. The resultant means and standard deviations were used to fit a quintuple Poly-Gaussian function (Sum of five Gaussian functions with Means, SDs: 0.143, 0.007; 0.171, 0.008; 0.201, 0.0089; 0.235, 0.0092; 0.270, 0.0103, respectively) to the data. Histogram was cropped for better resolution-values below event cutoff (2 standard deviations above baseline mean: 0.1 ΔF/F0) are not included and actual maximum intensity bin is 2.09–2.095.

Similar articles

Cited by

References

    1. Ashcroft FM, Harrison DE, Ashcroft SJ. Glucose induces closure of single potassium channels in isolated rat pancreatic beta-cells. Nature. 1984;312:446–448. doi: 10.1038/312446a0. - DOI - PubMed
    1. Cook DL, Hales CN. Intracellular ATP directly blocks K+ channels in pancreatic β-cells. Nature. 1984;311:271–273. doi: 10.1038/311271a0. - DOI - PubMed
    1. Henquin JC. A minimum of fuel is necessary for tolbutamide to mimic the effects of glucose on electrical activity in pancreatic beta-cells. Endocrinology. 1998;139:993–998. doi: 10.1210/endo.139.3.5783. - DOI - PubMed
    1. Seghers V, Nakazaki M, DeMayo F, Aguilar-Bryan L, Bryan J. Sur1 knockout mice. A model for KATP channel-independent regulation of insulin secretion. J Biol Chem. 2000;275:9270–9277. doi: 10.1074/jbc.275.13.9270. - DOI - PubMed
    1. Henquin JC. Triggering and amplifying pathways of regulation of insulin secretion by glucose. Diabetes. 2000;49:1751–1760. doi: 10.2337/diabetes.49.11.1751. - DOI - PubMed

Publication types

LinkOut - more resources