Clinical Trial
. 2021 May 21;11(1):10678.
doi: 10.1038/s41598-021-90153-2.

Point-of-care lung ultrasound in COVID-19 patients: inter- and intra-observer agreement in a prospective observational study

Affiliations
Clinical Trial

Point-of-care lung ultrasound in COVID-19 patients: inter- and intra-observer agreement in a prospective observational study

Markus H Lerchbaumer et al. Sci Rep. .

Abstract

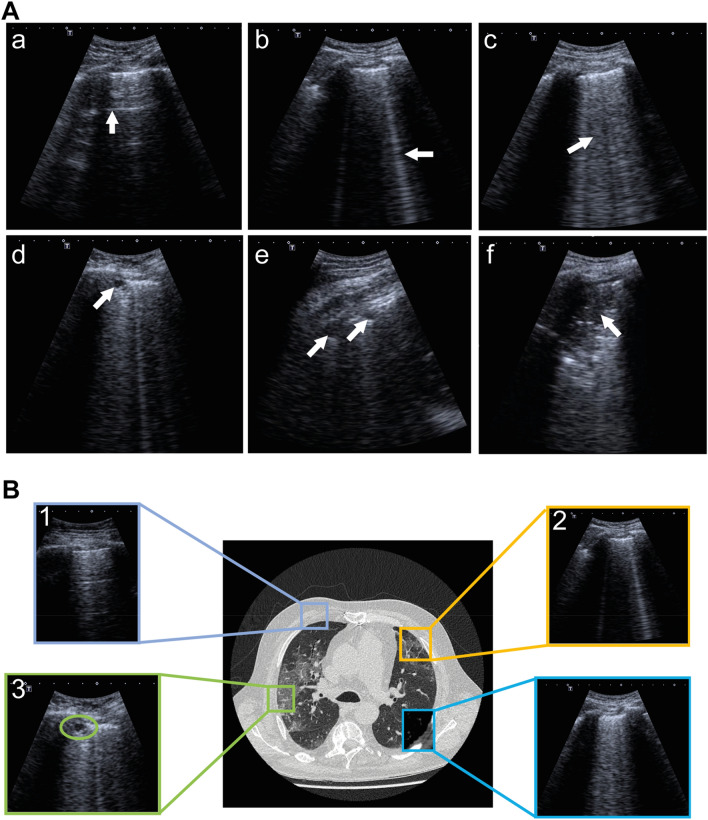
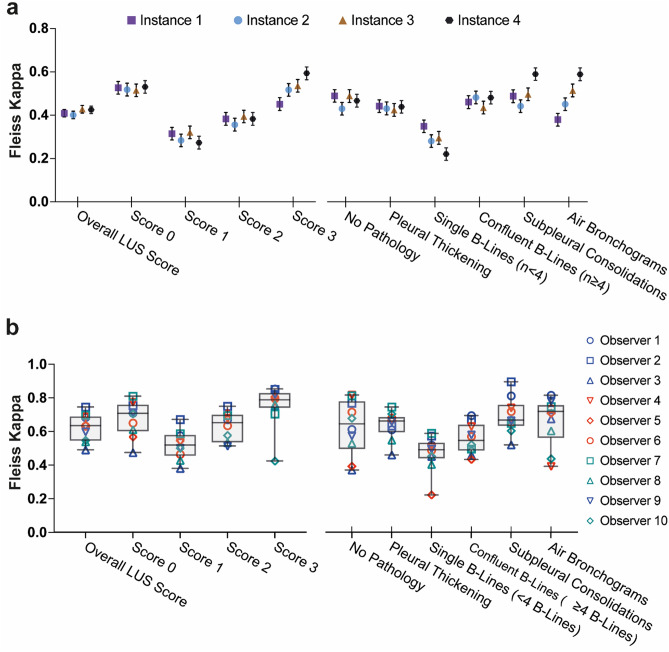
With an urgent need for bedside imaging of coronavirus disease 2019 (COVID-19), this study's main goal was to assess inter- and intraobserver agreement in lung ultrasound (LUS) of COVID-19 patients. In this single-center study we prospectively acquired and evaluated 100 recorded ten-second cine-loops in confirmed COVID-19 intensive care unit (ICU) patients. All loops were rated by ten observers with different subspeciality backgrounds for four times by each observer (400 loops overall) in a random sequence using a web-based rating tool. We analyzed inter- and intraobserver variability for specific pathologies and a semiquantitative LUS score. Interobserver agreement for both, identification of specific pathologies and assignment of LUS scores was fair to moderate (e.g., LUS score 1 Fleiss' κ = 0.27; subpleural consolidations Fleiss' κ = 0.59). Intraobserver agreement was mostly moderate to substantial with generally higher agreement for more distinct findings (e.g., lowest LUS score 0 vs. highest LUS score 3 (median Fleiss' κ = 0.71 vs. 0.79) or air bronchograms (median Fleiss' κ = 0.72)). Intraobserver consistency was relatively low for intermediate LUS scores (e.g. LUS Score 1 median Fleiss' κ = 0.52). We therefore conclude that more distinct LUS findings (e.g., air bronchograms, subpleural consolidations) may be more suitable for disease monitoring, especially with more than one investigator and that training material used for LUS in point-of-care ultrasound (POCUS) should pay refined attention to areas such as B-line quantification and differentiation of intermediate LUS scores.


Conflict of interest statement

The authors declare no competing interests.

Figures

Figure 1
Figure 1
Standard operating procedure (SOP) for image acquisition. (A) Lung ultrasound (LUS) regions of interest for standardization of image acquisition; Points L1-L6 and R1-R6 located in the midclavicular (MCL), anterior axillary (AAL) and posterior axillary line (PAL) in the 3rd & 6th intercostal spaces (ICS) (B) Ultrasound imaging presets defined by SOP. Cine-loops were recorded as B-mode images for 10 s each. (C) Physiological LUS acoustic window confined by ribs and their corresponding shadows.
Figure 2
Figure 2
Representative images illustrating pathological LUS findings. (A) Typical LUS findings in COVID-19 are indicated by arrows: (a) A-lines; (b) Single B-lines; (c) Confluent B-lines; (d) Subpleural consolidations; (e) Substantial consolidations and pleural fragmentation; (f) Consolidation with air bronchogram. (B) Aforementioned LUS findings and their correlating computed tomography (CT) findings: (1) physiological bat sign with A-lines; (2) single B-lines; (3) Subpleural consolidation; (4) Pleural thickening/fragmentation and confluent B-lines.
Figure 3
Figure 3
Interobserver (a) and intraobserver (b) agreement measured by Fleiss-Kappa between observers. For interobserver (A) last assessment of the quadrupled cine-loops (= instance 4) resulted in median κ = 0.41 (95% CI 0.39–0.43) for overall LUS score, κ = 0.53 (95% CI 0.50–0.56) for LUS score 0, κ = 0.27 (95% CI 0.24–0.30) for LUS score 1, κ = 0.38 (95% CI 0.35–0.41) for LUS score 2, κ = 0.59 (95% CI 0.56–0.62) for LUS score 3, κ = 0.47 (95% CI 0.44–0.50) for no pathology, κ = 0.44 (95% CI 0.41–0.47) for pleural thickening/fragmentation, κ = 0.22 (95% CI 0.19–0.25) for single B-lines (n < 4), κ = 0.48 (95% CI 0.45–0.51) for confluent B-lines (n ≥ 4), κ = 0.59 (95% CI 0.56–0.62) for subpleural consolidations, and κ = 0.59 (95% CI 0.56–0.62) for air bronchogram respectively. For intraobserver (B) over all four assessments with median κ = 0.63 (IQR 0.54–0.69) for total LUS score, median κ = 0.71 (IQR 0.6–0.76) for LUS Score 0, median κ = 0.52 (IQR 0.46–0.58) for LUS Score 1, median κ = 0.65 (IQR 0.53–0.7) for LUS Score 2 and median κ = 0.79 (IQR 0.74–0.83) for LUS Score 3. In terms of single pathologies, intraobserver agreement showed median κ-values of 0.65 (IQR 0.5–0.78) for no pathology, 0.66 (IQR 0.59–0.69) for pleural thickening; 0.49 (IQR 0.44–0.53) for single B-lines; 0.55 (IQR 0.49–0.64) for confluent B-lines; 0.67 (IQR 0.63–0.76) for pleural consolidations and 0.72 (IQR 0.56–0.76) for air bronchograms (p < 0.005 for all, cf. supplementary results for specific Fleiss Kappa values). All variabilities are color- and symbol-coded for the respective observer as well as observer group.
Figure 4
Figure 4
Comparison over four instances (= #1–#4) of observer groups regarding semiquantitative LUS scores (a) and detection of single pathologies (b). (A) LUS score—response frequencies of each observer group as fraction of total (percentage) observers regarding their LUS scoring. Group comparison via Kruskal–Wallis test revealed a significant difference in the distribution of LUS scores in all instances between observer groups. (B) Detection of individual COVID-19-associated lung pathologies in LUS—Graphic representation of response frequency within observer groups as percentage over four viewing instances compared to radiologic consensus frequency (cf. supplementary results for specific statistics).

References

    1. Pascarella G, Strumia A, Piliego C, Bruno F, Del Buono R, Costa F, et al. COVID-19 diagnosis and management: A comprehensive review. J. Intern. Med. 2020;288:192–206. doi: 10.1111/joim.13091. - DOI - PMC - PubMed
    1. Phua J, Weng L, Ling L, Egi M, Lim CM, Divatia JV, et al. Intensive care management of coronavirus disease 2019 (COVID-19): challenges and recommendations. Lancet Respir. Med. 2020;8:506–517. doi: 10.1016/S2213-2600(20)30161-2. - DOI - PMC - PubMed
    1. Ai T, Yang Z, Hou H, Zhan C, Chen C, Lv W, et al. Correlation of chest CT and RT-PCR testing in coronavirus disease 2019 (COVID-19) in China: A report of 1014 cases. Radiology. 2020;296:32–40. doi: 10.1148/radiol.2020200642. - DOI - PMC - PubMed
    1. Rodriguez-Morales AJ, Cardona-Ospina JA, Gutiérrez-Ocampo E, Villamizar-Peña R, Holguin-Rivera Y, Escalera-Antezana JP, et al. Clinical, laboratory and imaging features of COVID-19: A systematic review and meta-analysis. Travel Med. Infect. Dis. 2020;34:101623. doi: 10.1016/j.tmaid.2020.101623. - DOI - PMC - PubMed
    1. Grasselli G, Zangrillo A, Zanella A, Antonelli M, Cabrini L, Castelli A, et al. Baseline characteristics and outcomes of 1591 patients infected with SARS-CoV-2 admitted to ICUs of the Lombardy Region, Italy. JAMA. 2020;323(16):1574–1581. doi: 10.1001/jama.2020.5394. - DOI - PMC - PubMed

Publication types