. 2021 May 21;11(1):10676.
doi: 10.1038/s41598-021-90115-8.

Mesenchymal stromal cell mitochondrial transfer to human induced T-regulatory cells mediates FOXP3 stability

Affiliations

Mesenchymal stromal cell mitochondrial transfer to human induced T-regulatory cells mediates FOXP3 stability

Jeong-Su Do et al. Sci Rep. .

Abstract

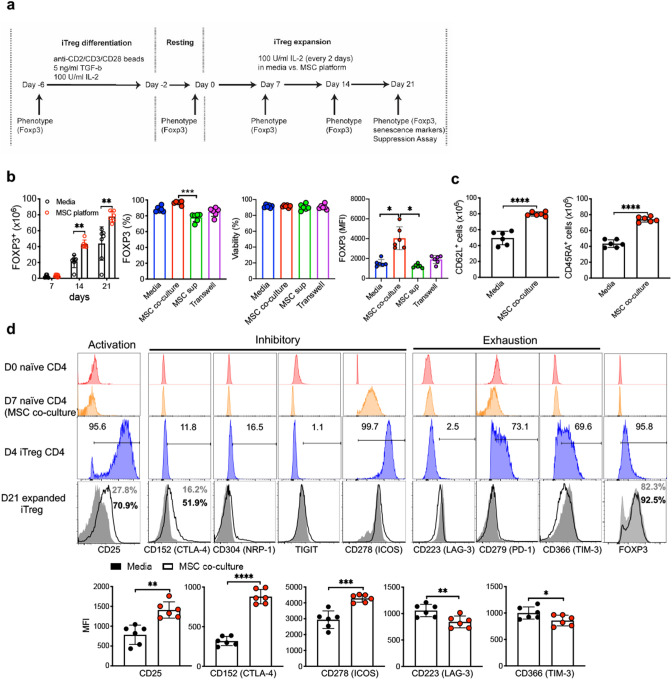
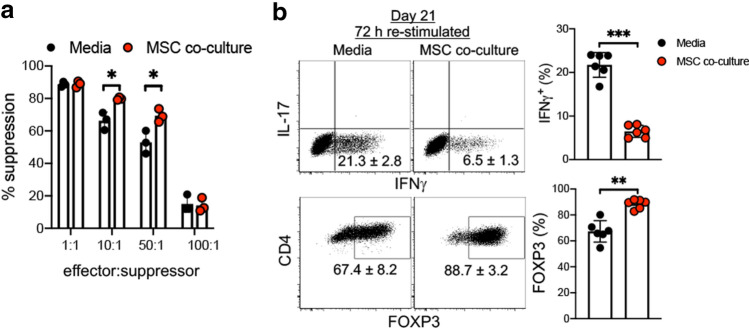
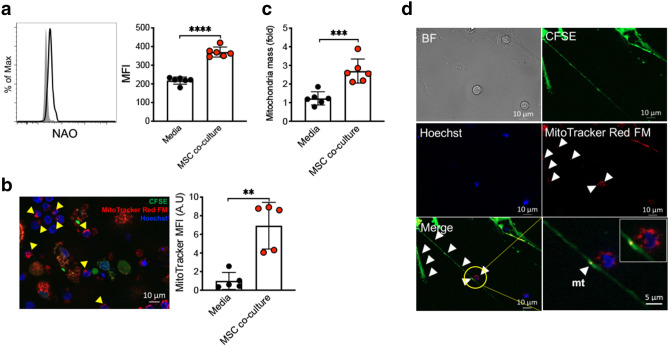
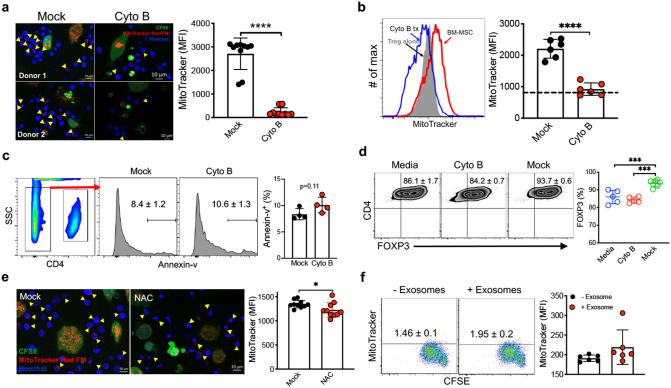
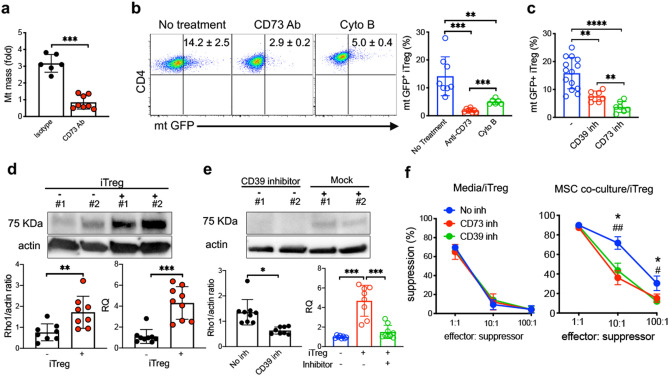
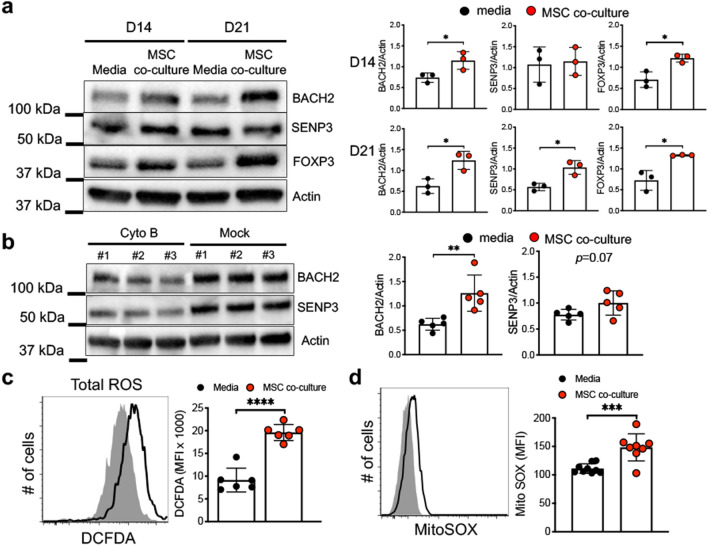
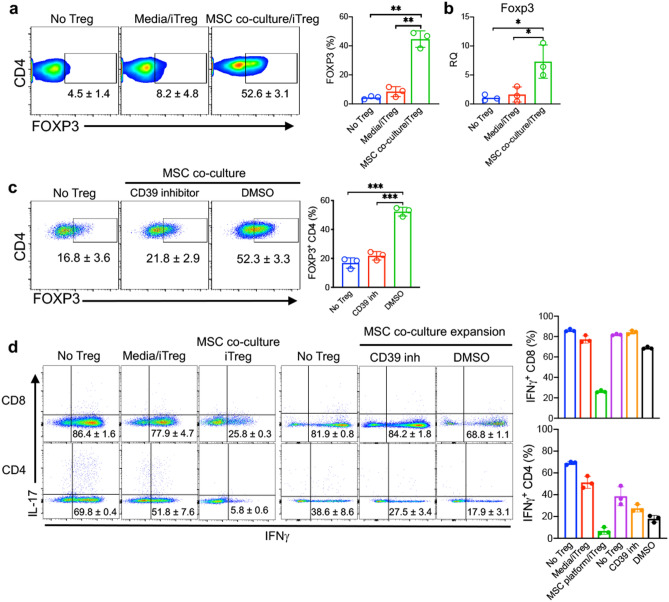
The key obstacle to clinical application of human inducible regulatory T cells (iTreg) as an adoptive cell therapy in autoimmune disorders is loss of FOXP3 expression in an inflammatory milieu. Here we report human iTreg co-cultured with bone marrow-derived mesenchymal stromal cells (MSCs) during short-term ex vivo expansion enhances the stability of iTreg FOXP3 expression and suppressive function in vitro and in vivo, and further that a key mechanism of action is MSC mitochondrial (mt) transfer via tunneling nanotubules (TNT). MSC mt transfer is driven by mitochondrial metabolic function (CD39/CD73 signaling) in proliferating iTreg and promotes iTreg expression of FOXP3 stabilizing factors BACH2 and SENP3. These results elucidate cellular and molecular mechanisms underlying human MSC mt transfer to proliferating cells. MSC mt transfer stabilizes FOXP3 expression in iTregs, thereby enhancing and sustaining their suppressive function in inflammatory conditions in vitro and in vivo.


Conflict of interest statement

The authors declare no competing interests.

Figures

Figure 1
Figure 1
MSCs enhance and sustain intrinsic iTreg phenotype during IL-2 driven ex vivo expansion. (a) Schematic diagram shows experimental strategy for iTreg expansion. (b) Absolute number, percentage of FOXP3+, FOXP3 MFI in CD4 T cells and viability of CD4 T cells at day 21 were measured at indicated time points in IL-2/media vs MSC co-culture with identical IL-2/media (n = 6–7). Multiple comparisons analysis was performed using the Friedman test. (c) Absolute number of CD62L+ and CD45RA+ iTreg cells were calculated at 21 days expansion (n = 5–6). (d) Immuno-phenotyping of Treg marker expression on D0 naïve CD4 T cells, 7 days expanded naïve T cells in IL-2/media over MSC monolayer w/o CD3/CD28 stimulation (Day 7 naïve CD4—MSC co-culture), or 4 days stimulated CD4 T cells with TGF-β/IL-2 and CD3/28—(Day 4 iTreg CD4) and iTregs included surface staining with antibodies targeting CD25, CD152 (CTLA-4), CD223 (LAG-3), CD278 (ICOS) CD304 (NRP-1), CD279 (PD-1), CD366 (Tim-3), and TIGIT at 21 days expansion. Data are representative of three independent experiments ± SD. *p < 0.05, **p < 0.01, ***p < 0.001, ****p < 0.0001 paired t test. See also Supplementary Fig. S1.
Figure 2
Figure 2
MSC co-culture stabilises FOXP3 expression in iTregs in the presence of inflammatory cytokines. (a) Suppressive effects of iTregs were measured day 21 of ex vivo expansion of iTregs in IL-2/media vs MSC co-culture, CD25high FACS sorted iTregs were used to test suppressive function. 4 days after stimulation, CFSE dilution was examined by FACS (n = 3). (b) Expression of FOXP3 on iTregs was measured following 72 h restimulation with CD3 and CD28 antibodies (1 μg ml−1) in the presence of inflammatory cytokines IFNγ (10 μg ml−1), IL-6 (10 μg ml−1), and TNF (10 μg ml−1) at concentration of 5 × 105 cells ml−1 and analyzed by FACS. Intracellular IFNγ and IL-17 were detected by flow cytometry analysis. Data are representative of two independent experiments ± SD (n = 6–7) **p < 0.01, ***p < 0.001 paired t test. See also Supplementary Fig. S2.
Figure 3
Figure 3
MSC mitochondrial transfer to iTregs occurs via TNT. (a) Mitochondrial quantity assay of iTregs was analyzed. At 3 weeks, media vs MSC co-culture iTreg cells were stained with NAO to quantify mt mass (n = 5). (b) Confocal imaging analysis for MitoTracker transfer. MSC were stained with CFSE (green) and MitoTracker Far Red (red), iTreg were stained with Hoechst (blue) and then co-cultured for 24–36 h (n = 5). (c) Mitochondria DNA copy number was assessed from IL-2/media or MSC co-culture expanded iTregs at day 21 (n = 6). (d) MSC mt transfer analysis. MSC were stained with CFSE (green) and MitoTracker Far Red (red), iTreg were stained Hoechst (blue) and cells were co-cultured for 24–36 h. Live cell images were collected by confocal microscopy. Data are representative of three independent experiments. (b,d) Analysis of recorded images was performed using Zen software Blue edition, (2011; version 2.0.14283.302). https://www.zeiss.com/microscopy/us/products/microscope-software/zen.html **p < 0.01, ***p < 0.001, ****p < 0.0001 paired t test. Scale bars: 10 μm. See also Supplementary Fig. S3.
Figure 4
Figure 4
MSC-iTreg interactions are required for mt transfer. (a) Mitochondrial transfer measured in iTreg co-cultured with cytochalasin B treated MSC for 24–36 h (n = 5). Cytochalasin B was added in the MSC co-culture (350 nM). Arrowheads indicate mt transfer to iTreg. Analysis of recorded images was performed using Zen 2012 software. (b) FACS analysis of MSC mt transfer to iTreg after cytochalasin B treatment. MSC were stained with MitoTracker Far Red (red) and iTreg were co-cultured for 48–72 h. iTregs were stained by CD4 antibody and analyzed. (c) Annexin V FACS analysis of MSC viability after cytochalasin B treatment. MSCs were gated as CD4 negative population. (d) FOXP3 expression in iTregs was measured from mock vs cytochalasin B treated MSC co-culture expanded iTregs (n = 5–7). (e) Effect of ROS inhibitor treatment on mitochondrial transfer. MSC were pre-stained with CFSE and MitoTracker Red FM and then cultured with Hoechst stained iTreg for 24–36 h. The ROS inhibitor antioxidant N-acetylcysteine (NAC) 200 μM was added to MSC + iTreg culture for 24–36 h. Live cell images were collected by confocal microscopy. (a,e) Analysis of recorded images was performed using Zen software Blue edition, (2011; version 2.0.14283.302). https://www.zeiss.com/microscopy/us/products/microscope-software/zen.html (f) MSC exosome uptake by proliferating iTregs. MSC exosome were stained with MitoTracker Far Red (Hough et al., 2018). FOXP3+ iTregs were stimulated with plate bound CD3 (1 μg ml−1) for 72 h. Data are representative of 2–3 independent experiments. *p < 0.05, ***p < 0.001, ****p < 0.0001 paired t test. Scale bars: 10 μm. See also Supplementary Figs. S4 and S5.
Figure 5
Figure 5
CD39/73 signaling induces MSC mitochondrial transfer to iTregs during IL-2 driven expansion. (a) Mitochondrial quantity was measured from IL-2/media or MSC co-culture expanded iTregs by RT-PCR (n = 6–8). Anti-CD73 antibody (10 μg ml−1) was added in MSC co-culture. Cells were collected at 72 h after mtGFP lentiviral transduced MSC co-culture. (b) Flow analysis of mtGFP+ iTregs in anti-CD73 blocking and cytochalasin B treatment. Cells were stained with CD4 antibody in order to identify iTregs at 72 h. (c) Analysis of mtGFP+ CD4+ iTregs after incubation with CD39 (100 nM) and CD73 (100 nM) inhibitor treated MSC (n = 7–14). Representative flow plot, gated for CD4+ iTreg cells after MSC co-culture. (d) Protein and RNA expression of Miro1 in MSC were measured after co-culture with iTreg. (e) After co-culture in the presence of CD39 inhibitor (n = 8–9). The image intensities for western blots were normalized to beta actin. Data are representative of 3–4 different experiments. (f) Effect of CD39 and CD73 inhibitors on suppressive functions of iTreg during MSC co-culture expansion. Inhibitor was added to iTreg and MSC co-culture. Data are representative of n = 3 independent samples. *p < 0.05, **p < 0.01, ***p < 0.001, ****p < 0.0001 paired t test. See also Supplementary Fig. S6.
Figure 6
Figure 6
MSC co-culture induces iTreg BACH2 and SENP3 via ROS. (a) Expression of BACH2, SENP3, and FOXP3 on iTregs was measured by immunoblot assay. iTregs were expanded in media vs MSC co-culture and protein was isolated at indicated time. Data are representative of n = 3 independent samples. (b) Analysis of BACH2 and SENP3 on iTregs after CD39 signaling inhibition. iTregs were expanded in media vs MSC co-culture and protein was isolated at indicated time. Expression was measured by immunoblot assay. (c,d) Expression of intracellular reactive oxygen species (ROS) was measured by flow cytometry in media vs MSC co-culture expanded iTregs (c) expression of mitochondrial ROS was measured by FACS analysis (d) at 21 days expansion. Data are representative of n = 6 independent experiments. *p < 0.05, **p < 0.01, ***p < 0.001, ****p < 0.0001 paired t test. See also Supplementary Fig. S7.
Figure 7
Figure 7
MSC co-culture expanded iTregs suppress effector T cell response in GVHD inflammation. (a) FOXP3+ CD4 T cells were measured from no iTreg, media expanded iTreg, and MSC co-culture expanded iTreg treated mice. NSG mice received 107 PBL and iTregs were injected at 7 days after PBL injection. Spleen cells were collected at day 14 after PBL injection. (b) FOXP3 expression, as quantified by RT-PCR, in the spleen cells. Measurement of FOXP3+ CD4 T cells in iTreg-treated mice. iTregs were expanded in MSC co-culture with CD39 inhibitor vs control. 10 days after expansion, iTreg cells were injected into PBL-treated NSG mice. Spleen cells were collected at day 14 after PBL injection. Expression of IFNγ and IL-17 was measured by flow cytometry in CD4 T cells. (d) Measurement of IFNγ producing CD4 and CD8 T cells was performed by flow cytometric analysis. Data are representative of n = 3–4 independent samples. *p < 0.05, **p < 0.01, ***p < 0.001 paired t test. See also Supplementary Figs. S8 and S9.

References

    1. Chen W, et al. Conversion of peripheral CD4+CD25− naive T cells to CD4+CD25+ regulatory T cells by TGF-beta induction of transcription factor Foxp3. J. Exp. Med. 2003;198:1875–1886. doi: 10.1084/jem.20030152. - DOI - PMC - PubMed
    1. Davidson TS, DiPaolo RJ, Andersson J, Shevach EM. Cutting Edge: IL-2 is essential for TGF-beta-mediated induction of Foxp3+ T regulatory cells. J. Immunol. 2007;178:4022–4026. doi: 10.4049/jimmunol.178.7.4022. - DOI - PubMed
    1. Schmitt EG, Williams CB. Generation and function of induced regulatory T cells. Front. Immunol. 2013;4:152. doi: 10.3389/fimmu.2013.00152. - DOI - PMC - PubMed
    1. Kanamori M, Nakatsukasa H, Okada M, Lu Q, Yoshimura A. Induced regulatory T cells: Their development, stability, and applications. Trends Immunol. 2016;37:803–811. doi: 10.1016/j.it.2016.08.012. - DOI - PubMed
    1. Bluestone JA, Trotta E, Xu D. The therapeutic potential of regulatory T cells for the treatment of autoimmune disease. Expert Opin. Ther. Targets. 2015;19:1091–1103. doi: 10.1517/14728222.2015.1037282. - DOI - PubMed

Publication types

MeSH terms

Substances