. 2021 May 21;4(1):87.
doi: 10.1038/s41746-021-00456-x.

Comparing machine learning algorithms for predicting ICU admission and mortality in COVID-19

Affiliations

Comparing machine learning algorithms for predicting ICU admission and mortality in COVID-19

Sonu Subudhi et al. NPJ Digit Med. .

Abstract

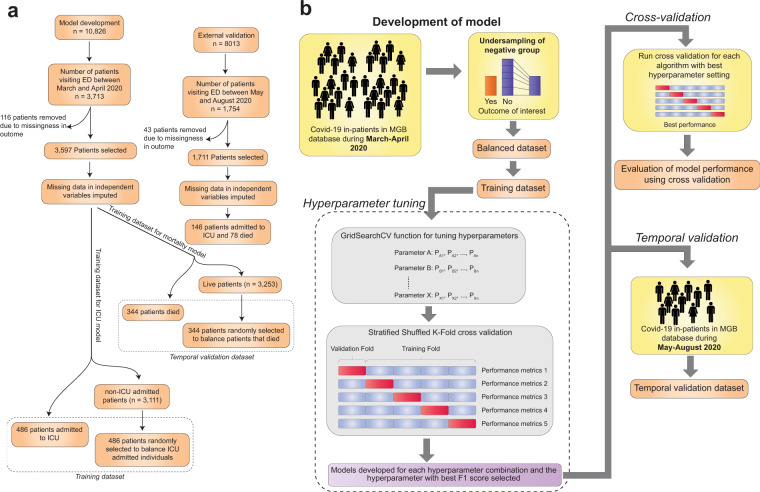
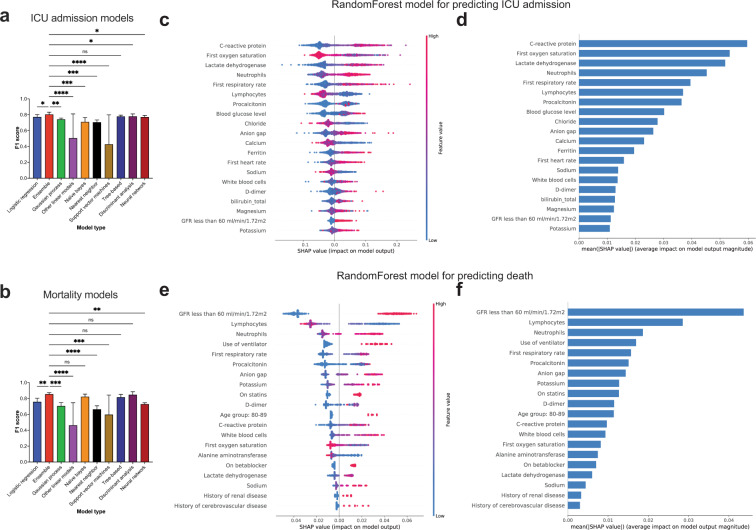
As predicting the trajectory of COVID-19 is challenging, machine learning models could assist physicians in identifying high-risk individuals. This study compares the performance of 18 machine learning algorithms for predicting ICU admission and mortality among COVID-19 patients. Using COVID-19 patient data from the Mass General Brigham (MGB) Healthcare database, we developed and internally validated models using patients presenting to the Emergency Department (ED) between March-April 2020 (n = 3597) and further validated them using temporally distinct individuals who presented to the ED between May-August 2020 (n = 1711). We show that ensemble-based models perform better than other model types at predicting both 5-day ICU admission and 28-day mortality from COVID-19. CRP, LDH, and O2 saturation were important for ICU admission models whereas eGFR <60 ml/min/1.73 m2, and neutrophil and lymphocyte percentages were the most important variables for predicting mortality. Implementing such models could help in clinical decision-making for future infectious disease outbreaks including COVID-19.


Conflict of interest statement

LLM owns equity in Bayer AG and is a consultant for SimBiosys. R.K.J. received honorarium from Amgen; consultant fees from Chugai, Elpis, Merck, Ophthotech, Pfizer, SPARC, SynDevRx, XTuit; owns equity in Accurius, Enlight, Ophthotech, SynDevRx; and serves on the Boards of Trustees of Tekla Healthcare Investors, Tekla Life Sciences Investors, Tekla Healthcare Opportunities Fund, Tekla World Healthcare Fund; and received a grant from Boehringer Ingelheim. Neither any reagent nor any funding from these organizations was used in this study. Other coauthors have no conflict of interests to declare.

Figures

Fig. 1
Fig. 1. Schematic diagram representing the process of machine learning model development.
a Flow diagram depicting steps in obtaining the training and temporal validation datasets (with patient numbers in each step). b The process of patient selection, dataset balancing, hyperparameter tuning, cross-validation and temporal validation are shown.
Fig. 2
Fig. 2. F1 score comparison and variables of importance for ICU admission and mortality prediction models.
a, b Bar plots representing the F1 scores of ICU admission and mortality prediction models. Error bars indicate standard deviation from mean. Statistical analysis was performed using Two-stage step-up method of Benjamini, Krieger and Yekutieli test which controls for False discovery rate (FDR) during multiple comparison. p-value style is geometric progression - <0.03 (*), <0.002 (**), <0.0002 (***), <0.0001 (****). c SHAP value summary dot plot and d variable importance of RandomForest algorithm-based ICU admission model. e SHAP value summary dot plot and f variable importance of RandomForest algorithm-based mortality model. The calculation of SHAP values is done by comparing the prediction of the model with and without the feature in every possible way of adding the feature to the model. The bar plot depicts the mean SHAP values whereas the summary dot plot shows the impact on the model. The color of the dot represents the value of the feature and the X-axis depicts the direction and magnitude of the impact. Red colored dots represent high value of the feature and the blue represents lower value. A positive SHAP value means the feature value increases likelihood of ICU admission/mortality. For features with positive SHAP value for red dots, suggests directly proportional variable to outcome of interest and those with positive SHAP value for blue dots, suggest inverse correlation.

References

    1. World Health Organization. Coronavirus disease (COVID-19) : situation report, 182 (World Health Organization, 2020).
    1. Antommaria AHM, et al. Ventilator triage policies during the COVID-19 pandemic at U.S. hospitals associated with members of the association of bioethics program directors. Ann. Intern. Med. 2020;173:188–194. doi: 10.7326/M20-1738. - DOI - PMC - PubMed
    1. Silberzweig J, et al. Rationing scarce resources: the potential impact of COVID-19 on patients with chronic kidney disease. J. Am. Soc. Nephrol. 2020;31:1926. doi: 10.1681/ASN.2020050704. - DOI - PMC - PubMed
    1. Beigel JH, et al. Remdesivir for the treatment of Covid-19 - final report. N. Engl. J. Med. 2020;383:1813–1826. doi: 10.1056/NEJMoa2007764. - DOI - PMC - PubMed
    1. Group RC, et al. Dexamethasone in hospitalized patients with Covid-19. N. Engl. J. Med. 2021;384:693–704. doi: 10.1056/NEJMoa2021436. - DOI - PMC - PubMed