. 2021 May 21;4(1):604.
doi: 10.1038/s42003-021-02112-2.

Deep ocean metagenomes provide insight into the metabolic architecture of bathypelagic microbial communities

Affiliations

Deep ocean metagenomes provide insight into the metabolic architecture of bathypelagic microbial communities

Silvia G Acinas et al. Commun Biol. .

Abstract

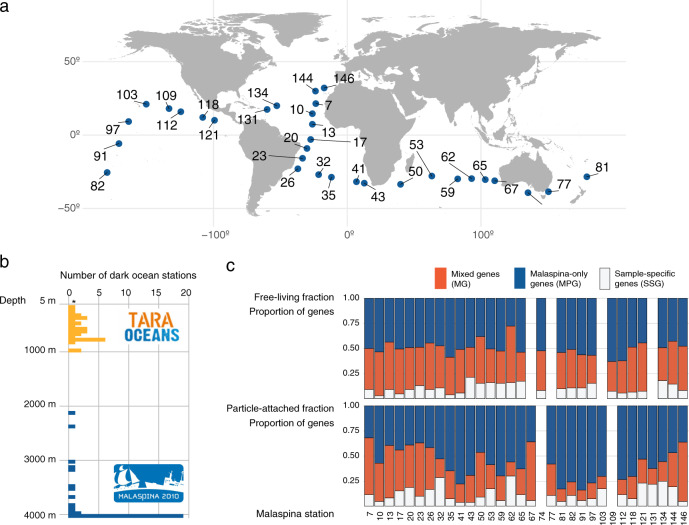
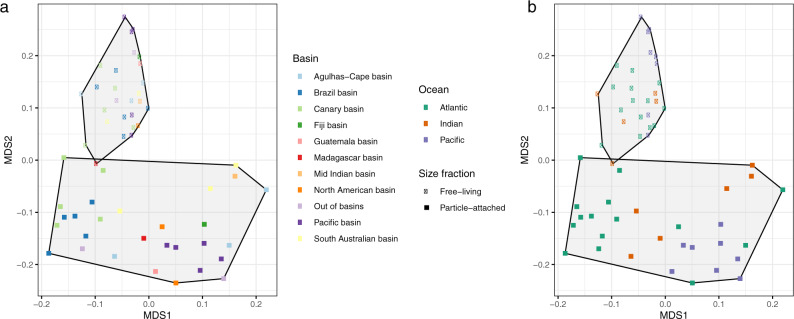
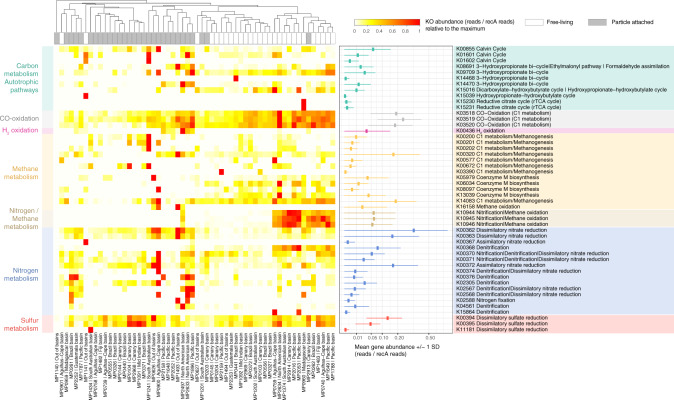
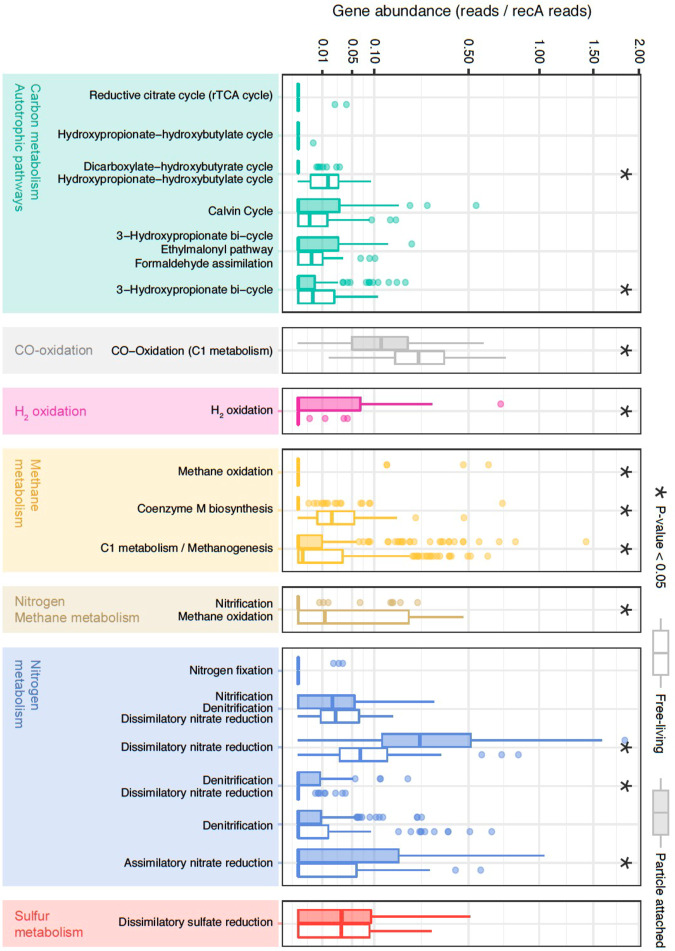
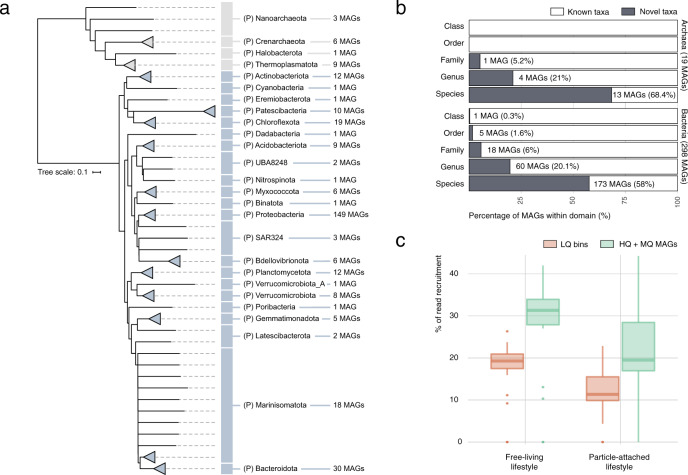
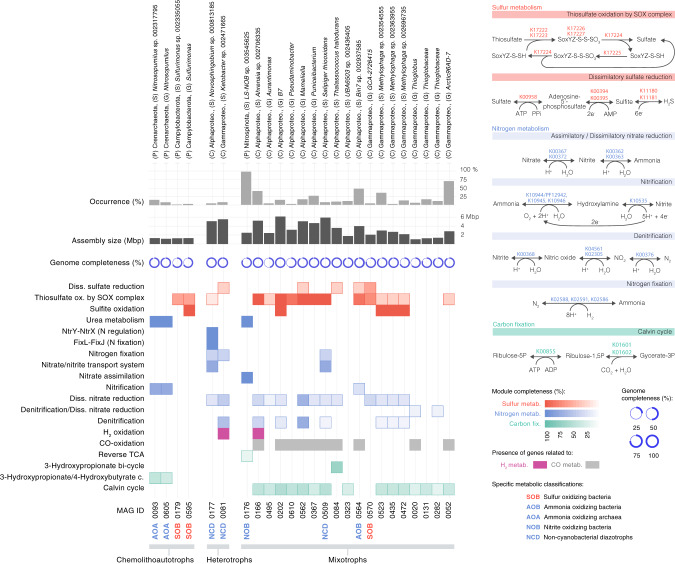
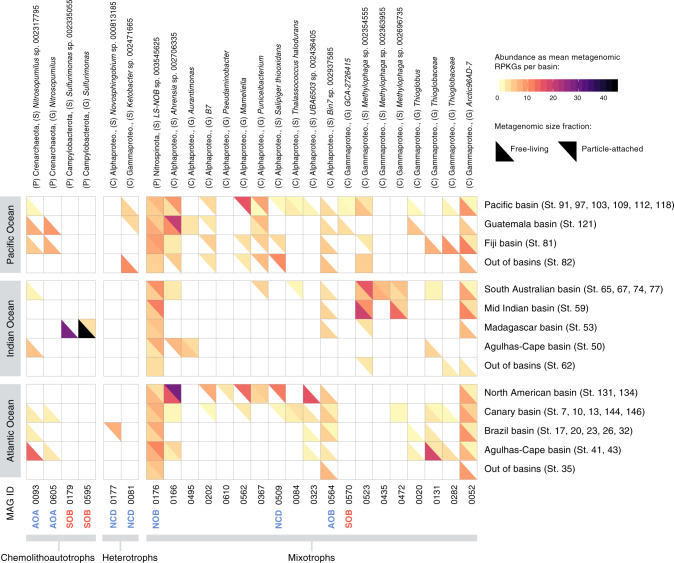
The deep sea, the largest ocean's compartment, drives planetary-scale biogeochemical cycling. Yet, the functional exploration of its microbial communities lags far behind other environments. Here we analyze 58 metagenomes from tropical and subtropical deep oceans to generate the Malaspina Gene Database. Free-living or particle-attached lifestyles drive functional differences in bathypelagic prokaryotic communities, regardless of their biogeography. Ammonia and CO oxidation pathways are enriched in the free-living microbial communities and dissimilatory nitrate reduction to ammonium and H2 oxidation pathways in the particle-attached, while the Calvin Benson-Bassham cycle is the most prevalent inorganic carbon fixation pathway in both size fractions. Reconstruction of the Malaspina Deep Metagenome-Assembled Genomes reveals unique non-cyanobacterial diazotrophic bacteria and chemolithoautotrophic prokaryotes. The widespread potential to grow both autotrophically and heterotrophically suggests that mixotrophy is an ecologically relevant trait in the deep ocean. These results expand our understanding of the functional microbial structure and metabolic capabilities of the largest Earth aquatic ecosystem.


Conflict of interest statement

The authors declare no competing interests.

Figures

Fig. 1
Fig. 1. Malaspina Deep Ocean Genetic Resources.
a Malaspina 2010 expedition cruise track showing the locations of the 32 stations sampled for the present study. b Representation of the sampling depth and metagenomics dataset generated by the Tara Oceans and Malaspina 2010 Circumnavigation Expeditions. The histogram plot displays the number of stations sampled in the dark ocean during the Tara Oceans (orange) and Malaspina 2010 (blue) expeditions and the distribution by water depth. The Malaspina Gene Database (M-GeneDB) was generated from the integration of 58 metagenomic bathypelagic samples. The asterisk in the histogram indicates the samples collected in the photic layer in Tara Oceans that were not included in the figure. c Analyses of the integrated gene catalog that results from the Tara Oceans (OM-RGC.v2) and M-GeneDB. The relative abundance of unique genes that appear only in Malaspina (MPG) (solid blue), Mixed genes (MG) that are present in both catalogs (red), and the Malaspina Sample-Specific genes (SSG) in white for both the free-living (FL; 0.2–0.8 µm) and particle-attached (PA; 0.8–20 µm) fractions.
Fig. 2
Fig. 2. Functional community structure of the bathypelagic microbial communities.
Nonmetric multidimensional scaling (NMDS) of the microbial communities based on the functional compositional similarity (Bray–Curtis distances) among the 58 samples in the dataset, based on clusters of KEGG orthologous groups (KOs). a Size fraction is coded by the symbol (squares, particle-attached and circles, free-living prokaryotes) and b the main oceans and deep-oceanic basins by color codes (see legends).
Fig. 3
Fig. 3. Heatmap of selected marker genes for different metabolic pathways across the 58 metagenomes.
A total of 49 marker genes (KOs, Y axis) indicative of different metabolic processes (Supplementary Data 8) detected in the Malaspina samples (X axis). KO abundance was normalized by recA single-copy gene as a proxy for copy number per cell. The general metabolism assignation is color-coded (see legend in the upper right) and the KEGG module(s) assignation used in the KO label is also indicated. The relative abundance across samples for each KO is shown in the heatmap. The mean (± 1 SD) untransformed abundance of each KO across all samples (reads/recA reads) is presented in the right panel.
Fig. 4
Fig. 4. Comparison of metabolic pathways in the free-living and particle-attached microbial communities from the bathypelagic ocean.
Normalized gene abundance (reads/recA reads) of 49 marker genes indicative of different autotrophic carbon-fixation pathways, nitrogen, sulfur, methane, and hydrogen metabolisms in the Malaspina Gene DataBase. Gene abundances from KOs belonging to the same pathway and KEGG module level have been plotted together (Supplementary Data 7). From top to the bottom: Reductive citrate cycle (rTCA): K15230, K15231); hydroxypropionate–hydroxybutyrate cycle: K15039; dicarboxylate-hydroxybutyrate cycle|hydroxypropionate-hydroxybutylate cycle: K15016; Calvin cycle: K00855; K01601 and K01602; 3-hydroxypropionate bi-cycle|ethylmalonyl pathway|formaldehyde assimilation: K08691; 3-hydroxypropionate bi-cycle: K14468, K14470 and K09709; CO oxidation (C1 metabolism): K03520; K03519 and K03518; H2-oxidation: K00436; methane oxidation: K16158; coenzyme M biosynthesis: K05979, K06034, K08097 and K13039; C1 metabolism/methanogenesis: K00320, K00200, K00201, K00202, K00672, K03390, K14083, and K00577; nitrification|methane oxidation: K10944, K10945, and K10946; Nitrogen fixation: K02588; nitrification|denitrification|dissimilatory nitrate reduction: K00370 and K00371; dissimilatory nitrate reduction (DNRA): K00362 and K00363; denitrification|dissimilatory nitrate reduction: K00374, K02567, and K02568; denitrification: K00368, K15864, K04561, K02305, and K00376; assimilatory nitrate reduction: K00367 and K00372; dissimilatory sulfate reduction: K00394, K00395 and K11181. Wilcoxon tests were done to test for significant differences between the particle-attached (PA) and free-living (FL) assemblages and significant (P value < 0.05) differences are labeled with asterisks. FL (empty boxes) and PA (filled boxes) bathypelagic microbial communities are shown next to each other.
Fig. 5
Fig. 5. Taxonomy and novelty of the Malaspina Deep MAGs catalog (MDeep-MAGs).
a Phylogenomics-based taxonomic classification of the 317 MDeep-MAGs (i.e., high-quality bins) dataset obtained from co-assembling 58 bathypelagic ocean metagenomes. MAGs are displayed at the phylum (P = phylum) taxonomic level using the closest reference based on the Genome Taxonomy Database GTDB. b Stacked bar plot for novelty quantification of the Malaspina MDeep-MAGs (X axis) according to their taxonomic ranks (Y axis) for archaea and bacteria. The taxonomically unclassified portion is depicted in white and classified in gray. c Distribution of metagenomic reads’ recovery by the low-quality metagenomic bins (LQ in orange) and the 317 MDeep-MAGs (that corresponded to medium quality (MQ) and high-quality (HQ) MAGs) reconstructed per sample in green. Samples are divided by lifestyle (free-living and particle-attached).
Fig. 6
Fig. 6. Metabolic potential in selected metagenome-assembled genomes (MAGs) from the bathypelagic ocean.
A total of 25 MDeep-MAGs were selected based on the presence of metabolic pathways with potential for chemolithoautotrophy, mixotrophy, and nitrogen fixation (non-cyanobacterial diazotrophs, NCDs). AOA ammonia-oxidizing archaea, SOB sulfur-oxidizing bacteria, NCDs non-cyanobacterial diazotrophs, NOB nitrite-oxidizing bacteria, AOB ammonia-oxidizing bacteria. Their taxonomic assignment at the maximal possible resolution is shown at the top, followed by the occurrence of each MAG in samples of the Malaspina Gene DataBase, and the genome completeness (%) of each MAG. On the right, metabolic pathways involved in inorganic carbon fixation (green), sulfur (red), nitrogen (blue) are shown as well as the KOs that participate in these pathways. At the bottom, the percentage module completeness for each pathway is coded by color intensity.
Fig. 7
Fig. 7. Mean abundance of 25 selected MAGs per oceanographic basin and size fraction, represented as metagenomic RPKGs (reads per genomic kilobase and metagenomic gigabase).
The upper half-tile represents RPKGs from the particle-attached size fraction metagenomes (0.8–20 µm) and the bottom half-tile represents RPKGs from the free-living size fraction metagenomes (0.2–0.8 µm). White represents the absence of the MAG in the metagenomic sample. MAGs are arranged based on their assigned metabolic strategy (chemolithoautotrophs, heterotrophs, and mixotrophs), and specific metabolic pathways confirmed in previous analyses are prepended to each MAG’s ID following color codes from Fig. 6 (blue for nitrogen metabolism, red for sulfur metabolism; AOA ammonia-oxidizing archaea, SOB sulfur-oxidizing bacteria, NCDs non-cyanobacterial diazotrophs, NOB nitrite-oxidizing bacteria, AOB ammonia-oxidizing bacteria). Phylogenomic taxonomic assignation of MAGs is presented at the top of the figure.

References

    1. Cho BC, Azam F. major role of bacteria in biogeochemical fluxes in the ocean´s interior. Nature. 1988;332:441–443. doi: 10.1038/332441a0. - DOI
    1. Bar-On, Y. M., Phillips, R. & Milo, R. The biomass distribution on Earth. Proc. Natl Acad. Sci. USA115, 6506–6511 (2018). - PMC - PubMed
    1. Aristegui J, Gasol JM, Duarte CM, Herndl GJ. Microbial oceanography of the dark ocean’s pelagic realm. Limnol. Oceanogr. 2009;54:1501–1529. doi: 10.4319/lo.2009.54.5.1501. - DOI
    1. Baltar F, Arístegui J, Gasol JM, Lekunberri I, Herndl GJ. Mesoscale eddies: hotspots of prokaryotic activity and differential community structure in the ocean. ISME J. 2010;4:975–988. doi: 10.1038/ismej.2010.33. - DOI - PubMed
    1. Del Giorgio PA, Duarte CM. Respiration in the open ocean. Nature. 2002;420:379–384. doi: 10.1038/nature01165. - DOI - PubMed

Publication types