. 2021 May 21;4(1):610.
doi: 10.1038/s42003-021-02121-1.

Optical interferometry based micropipette aspiration provides real-time sub-nanometer spatial resolution

Affiliations

Optical interferometry based micropipette aspiration provides real-time sub-nanometer spatial resolution

Massimiliano Berardi et al. Commun Biol. .

Abstract

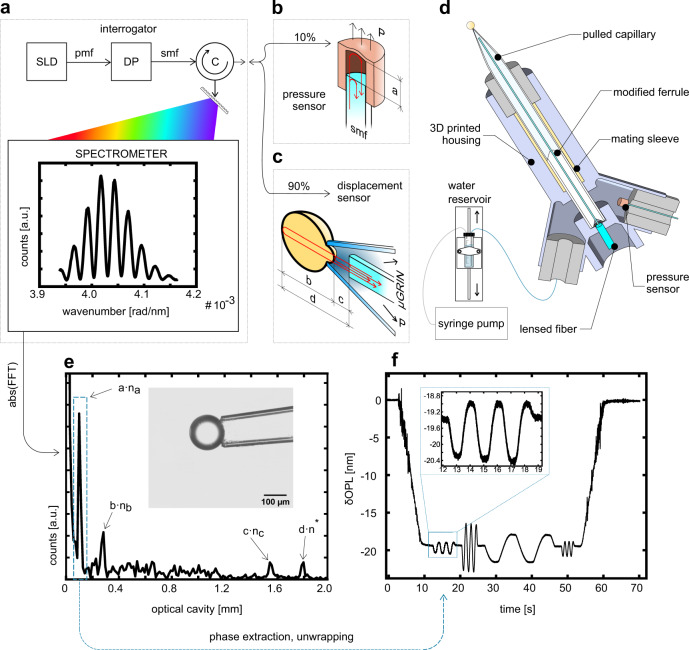
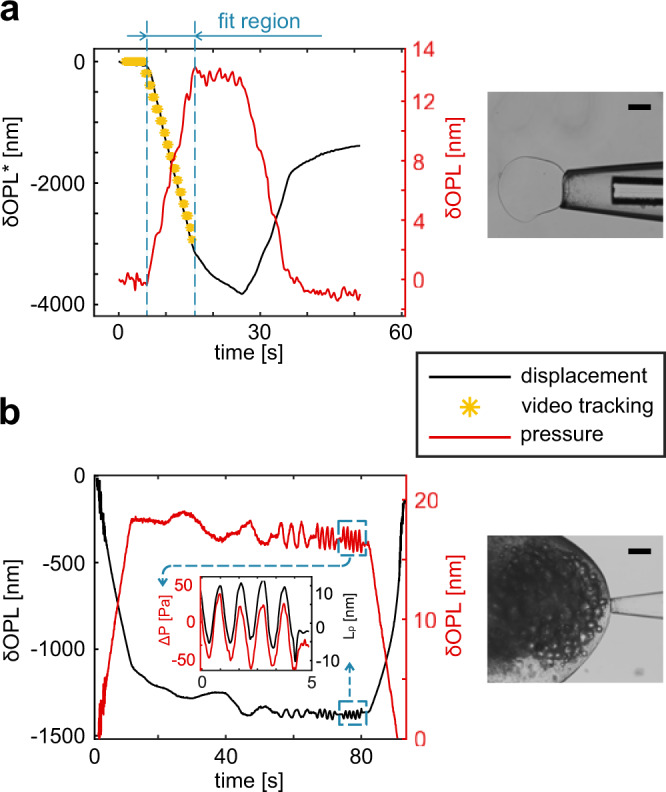
Micropipette aspiration (MPA) is an essential tool in mechanobiology; however, its potential is far from fully exploited. The traditional MPA technique has limited temporal and spatial resolution and requires extensive post processing to obtain the mechanical fingerprints of samples. Here, we develop a MPA system that measures pressure and displacement in real time with sub-nanometer resolution thanks to an interferometric readout. This highly sensitive MPA system enables studying the nanoscale behavior of soft biomaterials under tension and their frequency-dependent viscoelastic response.


Conflict of interest statement

The authors declare the following competing interests: M.B., K.B., N.R., and G.G. are employed at Optics11. The remaining authors declare no competing interests. A patent describing the optical system and a data acquisition/analysis procedure has been awarded to Optics11 (WO2017077138A1).

Figures

Fig. 1
Fig. 1. Schematics of the optical readout setup and data analysis process.
a The optical interrogator (Deltasens) is comprised of a superluminescent diode (SLD) connected to a depolarizer (DP) via a Panda fiber (pmf). The DP is then connected to a circulator (C) with a single mode fiber (smf), which reroutes the signal to the spectrometer and, via a 90/10 optical fiber splitter, to the sensors. b, c These are shown schematically (not to scale) to highlight the Fresnel reflections occurring at RI discontinuities (red arrows), with the resulting optical cavities (dimensions a to d). d Schematic cross-section of the probe where its components and the connection to the water reservoir and syringe pump are shown. During an experiment, a pressure variation at the probe nozzle can be operated either by changing the height of the water reservoir or by operating the syringe pump. e Fourier transform of an interference signal taken after capturing a 160 µm polystyrene bead (as shown in inset). The n subscripts refer to the RIs of the media between the interfaces, referring to the dimensioning shown in the sensors highlight (n* is a weighted average of nb and nc). Each peak contains phase information. By selectively tracking its variation over time, it is possible to obtain optical path length variation, δOPL, versus time plots. f Example of the unfiltered pressure sensor response to a DMA-like test. Note the sub-nanometer resolution, highlighted in the inset.
Fig. 2
Fig. 2. System validation.
a Quasi-static aspiration of an alginate bead. The plot shows the variation of the phase of the cavities associated with the pressure sensor (red line) and the displacement sensor (black line). Since a negative pressure is applied, the fiber to sample distance is reducing while the pressure sensor cavity is increasing. To compare the fiber-to-bead cavity variation with the video tracking, the displacement measurement (δOPL*) is corrected by dividing it by the refractive index of water (n = 1.331). The membrane displacement is represented with yellow asterisks. b DMA on a flying fish roe, with a highlight on one of the test frequencies (red line for pressure, black line for aspirated length). Images of the alginate bead and the flying fish roe captured by the measurement probe are shown in the right column. Scale bars are 100 µm.
Fig. 3
Fig. 3. DMA of the Zona Pellucida of mature bovine oocytes.
a Image of an oocyte captured by the measurement probe. The thin, semitransparent membrane around the cell is the Zona Pellucida. Its thickness, measured via image analysis, was about 10 µm for all the tested oocytes. It is worth noting that, since the displacement is measured via the fiber within the capillary, the probe does not need to be parallel to the petri dish. b The frequency dependency of storage and loss moduli of the Zona Pellucida, (mean ± SD, N=10). The solid yellow line is the expected trend as a function of frequency, following the two terms power law behavior mentioned in the main text. c Variation of pressure (ΔP) and aspirated length (Lp) at 0.75 Hz, highlighting the phase lag between the two signals.

References

    1. Lim CT, Zhou EH, Quek ST. Mechanical models for living cells - a review. J. Biomech. 2006;39:195–216. doi: 10.1016/j.jbiomech.2004.12.008. - DOI - PubMed
    1. Swaminathan V, et al. Mechanical Stiffness grades metastatic potential in patient tumor cells and in cancer cell lines. Cancer Res. 2011;71:5075–5080. doi: 10.1158/0008-5472.CAN-11-0247. - DOI - PMC - PubMed
    1. Yanez LZ, Han J, Behr BB, Pera RA, Camarillo DB. Human oocyte developmental potential is predicted by mechanical properties within hours after fertilization. Nat. Commun. 2016;7:10809. doi: 10.1038/ncomms10809. - DOI - PMC - PubMed
    1. Papi M, et al. Whole-depth change in bovine Zona Pellucida biomechanics after fertilization: How relevant in hindering polyspermy? PLoS ONE. 2012;7:e45696. doi: 10.1371/journal.pone.0045696. - DOI - PMC - PubMed
    1. González-Bermúdez B, Guinea GV, Plaza GR. Advances in micropipette aspiration: applications in cell biomechanics, models, and extended studies. Biophys. J. 2019;116:587–594. doi: 10.1016/j.bpj.2019.01.004. - DOI - PMC - PubMed

Publication types

Substances

LinkOut - more resources