. 2021 Dec;35(12):3406-3420.
doi: 10.1038/s41375-021-01295-1. Epub 2021 May 21.

Genomic analysis of cellular hierarchy in acute myeloid leukemia using ultrasensitive LC-FACSeq

Affiliations

Genomic analysis of cellular hierarchy in acute myeloid leukemia using ultrasensitive LC-FACSeq

Caner Saygin et al. Leukemia. 2021 Dec.

Erratum in

  • Correction: Genomic analysis of cellular hierarchy in acute myeloid leukemia using ultrasensitive LC-FACSeq.
    Saygin C, Hu E, Zhang P, Sher S, Lozanski A, Doong TJ, Nicolet D, Orwick S, Labanowska J, Skinner JN, Cempre C, Kauffman T, Goettl VM, Heerema NA, Abruzzo L, Miller C, Lapalombella R, Behbehani G, Mims AS, Larkin K, Grieselhuber N, Walker A, Bhatnagar B, Bloomfield CD, Byrd JC, Lozanski G, Blachly JS. Saygin C, et al. Leukemia. 2021 Dec;35(12):3627. doi: 10.1038/s41375-021-01398-9. Leukemia. 2021. PMID: 34480107 Free PMC article. No abstract available.

Abstract

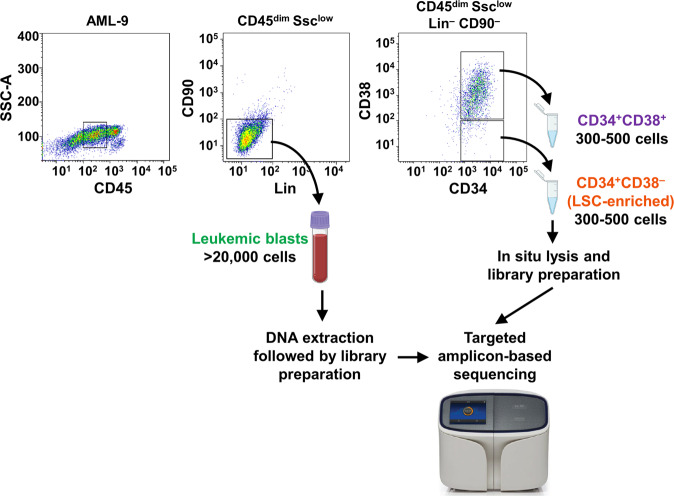
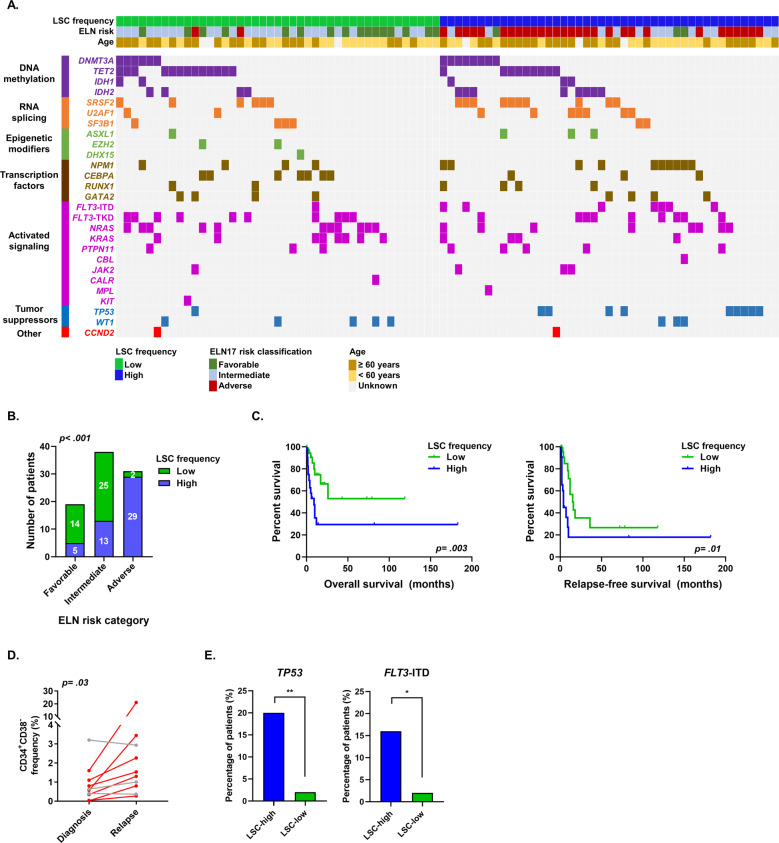
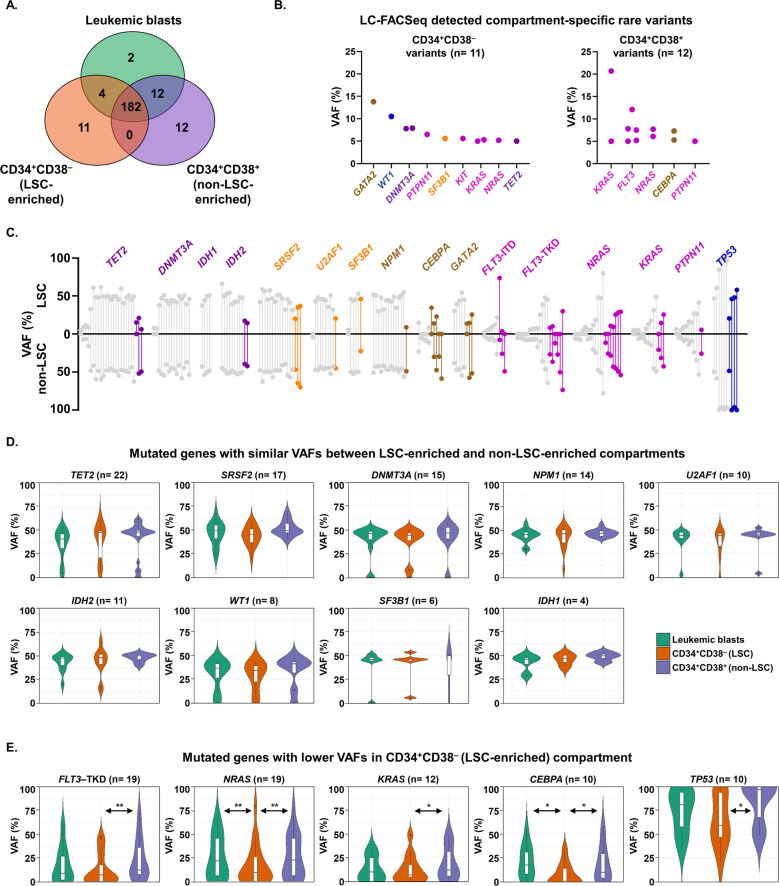
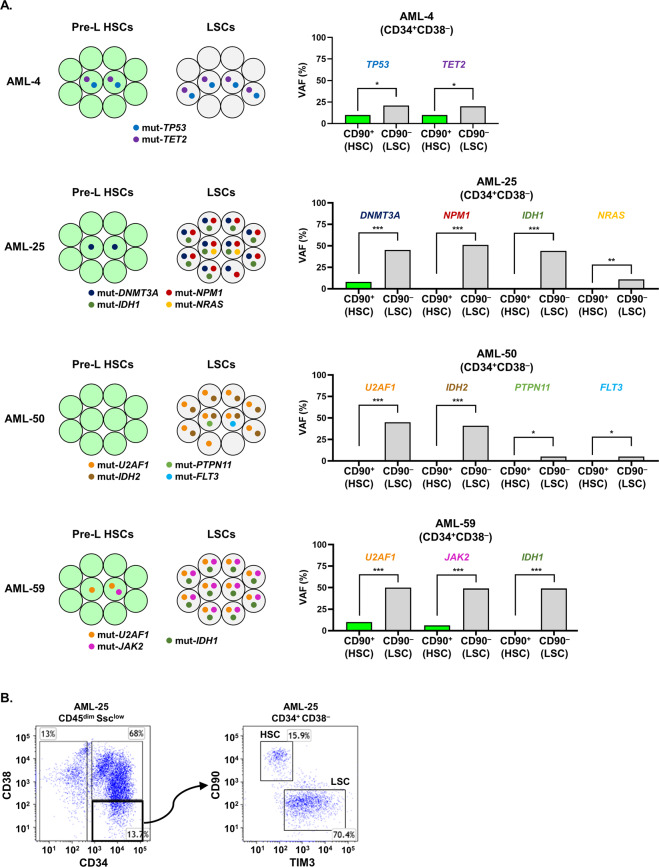
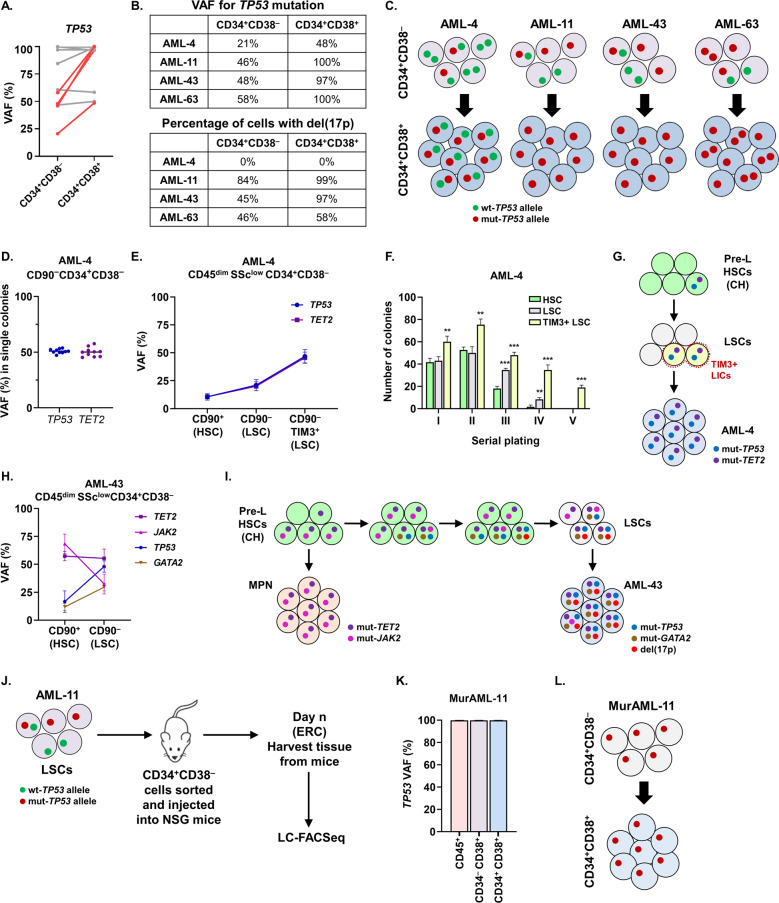
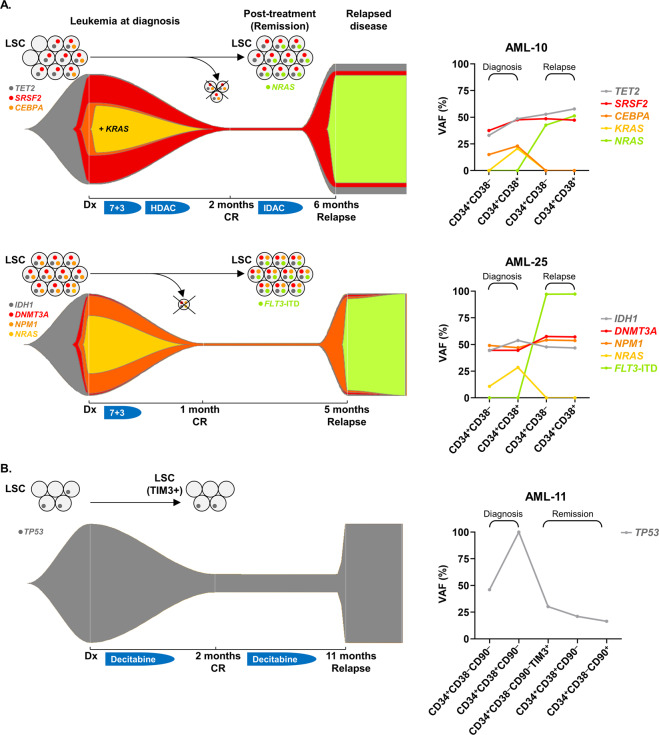
Hematopoiesis is hierarchical, and it has been postulated that acute myeloid leukemia (AML) is organized similarly with leukemia stem cells (LSCs) residing at the apex. Limited cells acquired by fluorescence activated cell sorting in tandem with targeted amplicon-based sequencing (LC-FACSeq) enables identification of mutations in small subpopulations of cells, such as LSCs. Leveraging this, we studied clonal compositions of immunophenotypically-defined compartments in AML through genomic and functional analyses at diagnosis, remission and relapse in 88 AML patients. Mutations involving DNA methylation pathways, transcription factors and spliceosomal machinery did not differ across compartments, while signaling pathway mutations were less frequent in putative LSCs. We also provide insights into TP53-mutated AML by demonstrating stepwise acquisition of mutations beginning from the preleukemic hematopoietic stem cell stage. In 10 analyzed cases, acquisition of additional mutations and del(17p) led to genetic and functional heterogeneity within the LSC pool with subclones harboring varying degrees of clonogenic potential. Finally, we use LC-FACSeq to track clonal evolution in serial samples, which can also be a powerful tool to direct targeted therapy against measurable residual disease. Therefore, studying clinically significant small subpopulations of cells can improve our understanding of AML biology and offers advantages over bulk sequencing to monitor the evolution of disease.


Conflict of interest statement

The authors declare no competing interests.

Figures

Fig. 1
Fig. 1. Isolation and sequencing of immunophenotypic leukemia stem- and non-stem cell compartments from primary acute myeloid leukemia (AML) samples by using LC-FACSeq.
A multicolor flow cytometry panel was used to enrich the subpopulation of cells with high self-renewal frequency, defined as the immunophenotypic (CD45dimSSclowLinCD90CD34+CD38) leukemia stem cell (LSC) compartment. Immunophenotypic LSCs and their non-LSC counterparts were subjected to immediate lysis upon enrichment, followed by preparation of libraries for next generation sequencing. Bulk leukemic blast population (CD45dimSSclowLinCD90) was also sorted, but subjected to traditional DNA extraction protocol, followed by library preparation. All samples were sequenced with a targeted amplicon-based sequencing platform.
Fig. 2
Fig. 2. Immunophenotypic leukemia stem cell (LSC) frequency impacts on outcomes of patients with acute myeloid leukemia (AML).
A Oncoprint of commonly occurring myeloid mutations in 88 AML patients. B Bar graph demonstrating distribution of AML patients stratified based on European Leukemia Net (ELN) prognostic risk groups and LSC frequency. The cutoff for high vs low LSC frequency was 0.5% (the median value for entire cohort). C Kaplan–Meier overall and relapse-free survival curves of AML patients stratified based on high (≥0.5%) vs low (<0.5%) LSC frequency at diagnosis. D The frequency of immunophenotypic LSCs (CD45dimSSclowLinCD90CD34+CD38) in consecutive diagnosis and relapse samples of 10 AML patients. Gray lines indicate no statistically significant change, while red lines indicate a significant difference between the two VAFs. E TP53 and FLT3-ITD mutations were significantly more common among patients with high LSC frequency as compared to patients with low LSC frequency at diagnosis. *p < 0.05, **p < 0.01.
Fig. 3
Fig. 3. Myeloid mutations have different distributions between acute myeloid leukemia stem- and non-stem cell compartments.
A Venn diagram showing the distribution of all pathogenic somatic sequencing variants detected by 27-gene targeted sequencing panel in immunophenotypic leukemia stem cell (LSC), non-LSC and bulk leukemic blast populations. B Graphs demonstrate variant allelic frequencies (VAF) of rare pathogenic variants that were observed exclusively in LSC and non-LSC compartments. C Lollipop plot comparing VAFs of mutations between immunophenotypic LSC and non-LSC compartments. Gray lines indicate no statistically significant difference, while colored lines indicate a significant difference between the two VAFs. D, E Violin plots demonstrate comparisons of VAFs between leukemic blasts, immunophenotypic LSCs and non-LSCs. *p < 0.05, **p < 0.01.
Fig. 4
Fig. 4. CD90 as a selection marker.
A Enrichment of immunophenotypically-defined pre-leukemic hematopoietic stem cell (HSC) and leukemia stem cell (LSC) compartments using CD90 as a selection marker. B CD90 and TIM3 staining in immunophenotypically-defined stem cell (CD34+CD38) compartment.
Fig. 5
Fig. 5. Evolutionary pathways in TP53 mutated acute myeloid leukemia (AML).
A Comparison of TP53 mutation variant allelic frequency (VAF) between immunophenotypic leukemia stem cell (LSC) and non-LSC compartments in 10 AML patients. Gray lines indicate no statistically significant difference, while red lines indicate a significant difference between the two VAFs. B Tables show the VAF of TP53 mutation and percentage of cells with loss of wild type TP53 allele detected by fluorescence in situ hybridization in 4 AML patients for whom the VAF of mutation doubled from LSC to non-LSC compartment. C Schema depicting the evolution of TP53 mutated AML from LSCs through clonal selection and progression. D Graph demonstrates the VAFs for TP53 and TET2 mutations in isolated single colonies arising from immunophenotypic LSCs in patient AML-4. E Graph demonstrates the VAFs for TP53 and TET2 mutations in immunophenotypic hematopoietic stem cell (HSC), LSC and TIM3 + LSCs in patient AML-4. F Immunophenotypically defined HSC, LSC and TIM3 + LSCs were isolated from patient AML-4 and cultured in methylcellulose-based MethoCult medium. Graph shows the number of colonies detected at each time point throughout serial replating. G Schema depicting the clonal evolution of leukemia in patient AML-4. H Graph demonstrates the VAFs for TET2, JAK2, TP53, and GATA2 mutations in immunophenotypically defined HSCs and LSCs in patient AML-43. I Schema depicting the clonal evolution of myeloproliferative neoplasm (MPN) and leukemia in patient AML-43. J LSCs from AML-11 were sorted and injected into NSG mice. After meeting early removal criteria (ERC), mice were sacrificed and bone marrow/spleen cells were harvested to perform LC-FACSeq analysis. K Graph demonstrates the VAFs for TP53 mutation in human CD45+, CD34+CD38, and CD34+CD38+ compartments of murine AML-11 (murAML-11). L Schema depicting the clonal composition of murAML-11. *p < 0.05, **p < 0.01, ***p < 0.001.
Fig. 6
Fig. 6. LC-FACSeq can track mutations in leukemia stem cell (LSC) and non-LSC compartments of AML patients at diagnosis, remission and relapse.
A Fish plots represent the clonal evolution of AML that can be inferred from the variant allelic frequencies (VAF) of somatic mutations detected with LC-FACSeq, which are shown in the corresponding graphs of paired diagnosis and relapse samples. The mutational composition of LSC compartment is also illustrated. B Monitorization of TP53 mutation in patient AML-11 at serial diagnosis, remission and relapse samples. Dx diagnosis, CR complete remission, HDAC high-dose cytarabine, IDAC intermediate-dose cytarabine; 7 + 3 (7-days of cytarabine and 3-days of daunorubicin).

References

    1. Cancer Genome Atlas Research N, Ley TJ, Miller C, Ding L, Raphael BJ, Mungall AJ, et al. Genomic and epigenomic landscapes of adult de novo acute myeloid leukemia. N Engl J Med. 2013;368:2059–74. doi: 10.1056/NEJMoa1301689. - DOI - PMC - PubMed
    1. Papaemmanuil E, Gerstung M, Bullinger L, Gaidzik VI, Paschka P, Roberts ND, et al. Genomic classification and prognosis in acute myeloid leukemia. N Engl J Med. 2016;374:2209–21. doi: 10.1056/NEJMoa1516192. - DOI - PMC - PubMed
    1. Tyner JW, Tognon CE, Bottomly D, Wilmot B, Kurtz SE, Savage SL, et al. Functional genomic landscape of acute myeloid leukaemia. Nature. 2018;562:526–31. doi: 10.1038/s41586-018-0623-z. - DOI - PMC - PubMed
    1. Welch JS, Ley TJ, Link DC, Miller CA, Larson DE, Koboldt DC, et al. The origin and evolution of mutations in acute myeloid leukemia. Cell. 2012;150:264–78. doi: 10.1016/j.cell.2012.06.023. - DOI - PMC - PubMed
    1. Dohner H, Estey E, Grimwade D, Amadori S, Appelbaum FR, Buchner T, et al. Diagnosis and management of AML in adults: 2017 ELN recommendations from an international expert panel. Blood. 2017;129:424–47. - PMC - PubMed

Publication types

MeSH terms

Substances