. 2021 Jul;31(7):732-741.
doi: 10.1038/s41422-021-00514-9. Epub 2021 May 21.

Humoral immune response to circulating SARS-CoV-2 variants elicited by inactivated and RBD-subunit vaccines

Affiliations

Humoral immune response to circulating SARS-CoV-2 variants elicited by inactivated and RBD-subunit vaccines

Yunlong Cao et al. Cell Res. 2021 Jul.

Abstract

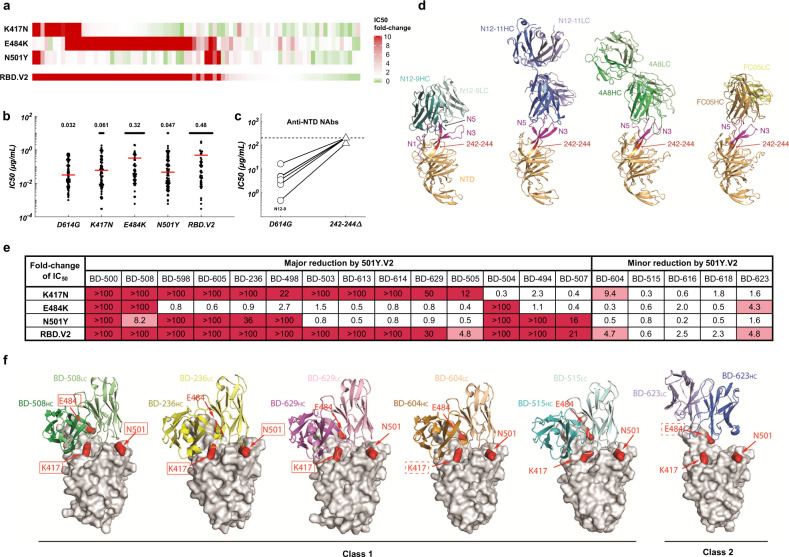
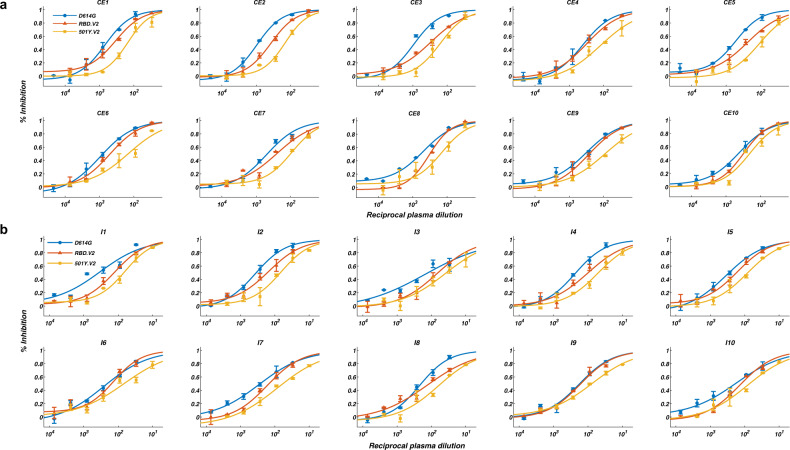
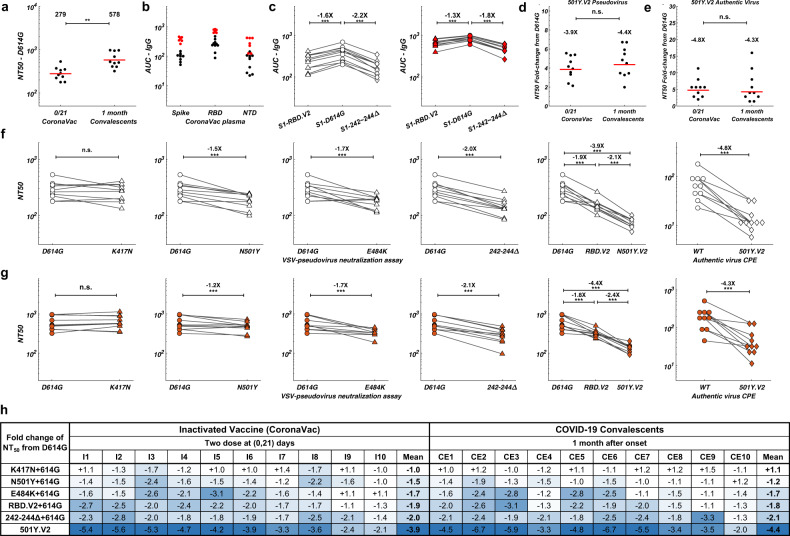
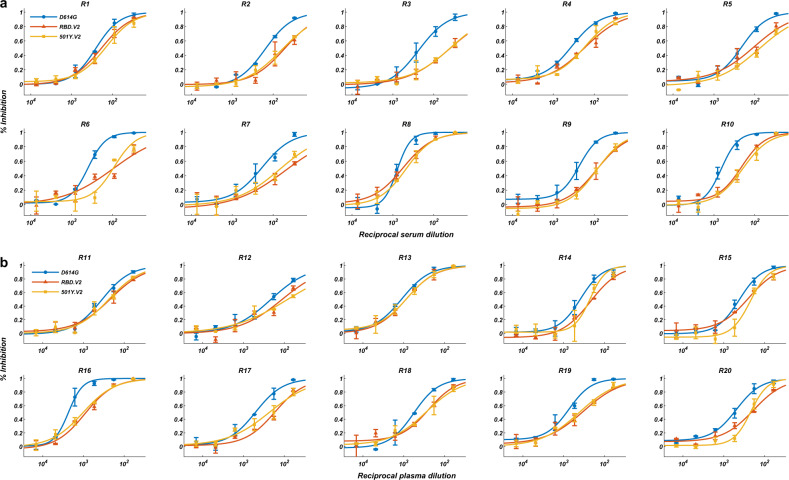
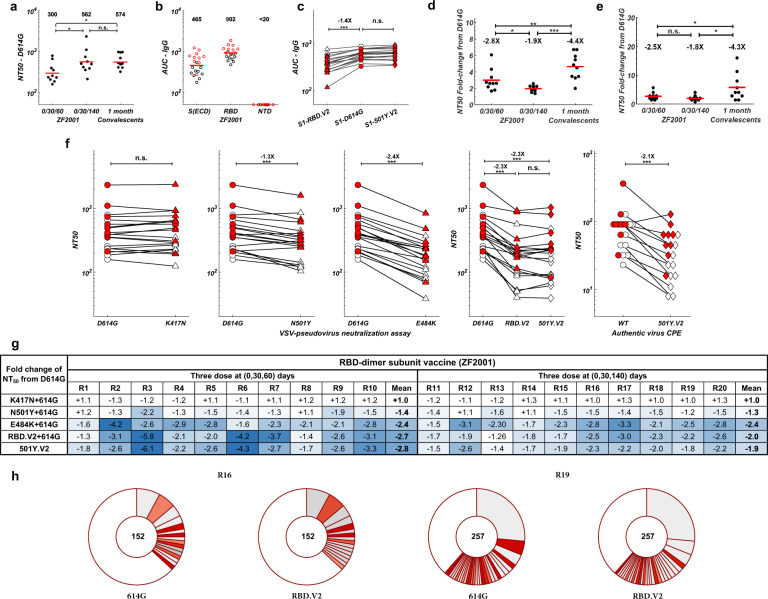
SARS-CoV-2 variants could induce immune escape by mutations on the receptor-binding domain (RBD) and N-terminal domain (NTD). Here we report the humoral immune response to circulating SARS-CoV-2 variants, such as 501Y.V2 (B.1.351), of the plasma and neutralizing antibodies (NAbs) elicited by CoronaVac (inactivated vaccine), ZF2001 (RBD-subunit vaccine) and natural infection. Among 86 potent NAbs identified by high-throughput single-cell VDJ sequencing of peripheral blood mononuclear cells from vaccinees and convalescents, near half anti-RBD NAbs showed major neutralization reductions against the K417N/E484K/N501Y mutation combination, with E484K being the dominant cause. VH3-53/VH3-66 recurrent antibodies respond differently to RBD variants, and K417N compromises the majority of neutralizing activity through reduced polar contacts with complementarity determining regions. In contrast, the 242-244 deletion (242-244Δ) would abolish most neutralization activity of anti-NTD NAbs by interrupting the conformation of NTD antigenic supersite, indicating a much less diversity of anti-NTD NAbs than anti-RBD NAbs. Plasma of convalescents and CoronaVac vaccinees displayed comparable neutralization reductions against pseudo- and authentic 501Y.V2 variants, mainly caused by E484K/N501Y and 242-244Δ, with the effects being additive. Importantly, RBD-subunit vaccinees exhibit markedly higher tolerance to 501Y.V2 than convalescents, since the elicited anti-RBD NAbs display a high diversity and are unaffected by NTD mutations. Moreover, an extended gap between the third and second doses of ZF2001 leads to better neutralizing activity and tolerance to 501Y.V2 than the standard three-dose administration. Together, these results suggest that the deployment of RBD-vaccines, through a third-dose boost, may be ideal for combating SARS-CoV-2 variants when necessary, especially for those carrying mutations that disrupt the NTD supersite.


Conflict of interest statement

The authors declare no competing interests.

Figures

Fig. 1
Fig. 1. Responses of anti-RBD and anti-NTD SARS-CoV-2 NAbs to 501Y.V2.
a IC50 fold-changes of 80 potent anti-RBD NAbs against pseudovirus carrying 501Y.V2 RBD mutations. b The geometric means of IC50 values of 80 anti-RBD NAbs against the indicated mutants. For NAbs with IC50 > 10 μg/mL, IC50 is designated as 10 μg/mL. c The IC50 values of six potent anti-NTD NAbs against pseudovirus carrying D614G or 242–244Δ. d Structure analyses of the NTD NAbs. The N1, N3, and N5 loops of NTD are highlighted in magenta. Residues 242–244 are highlighted in red. e IC50 fold-changes of VH3-53/VH3-66 NAbs against pseudovirus carrying 501Y.V2 RBD mutations. Red indicates major fold-change larger than 10-fold. Pink indicates minor fold-change between 3- and 10-fold. f Structure analyses of the interaction between VH3-53/VH3-66 NAbs and RBD. RBD is shown as a surface view, whereas the NAbs are shown as ribbons. Red solid rectangles indicate that the mutation would result in a major decrease in antibody binding. Red dashed rectangles indicate that the mutation would result in a minor decrease in antibody binding.
Fig. 2
Fig. 2. Pseudovirus neutralization assays of convalescent plasma and Coronavac vaccinee plasma against 501Y.V2 mutants.
a VSV-pseudovirus neutralization assays measuring neutralizing ability of convalescent plasma against D614G (blue), RBD.V2 (red), and 501Y.V2 (yellow) mutants. b VSV-pseudovirus neutralization assays measuring neutralizing ability of CoronaVac vaccinee plasma against D614G (blue), RBD.V2 (red), and 501Y.V2 (yellow) mutants. All experiments were reproduced at least twice.
Fig. 3
Fig. 3. Binding and neutralization of 501Y.V2 by convalescent and CoronaVac vaccinee plasma.
a NT50 values for COVID-19 convalescent plasma (CE) and CoronaVac vaccinee plasma (I) using D614G mutant pseudovirus neutralization assay. Statistical significance was determined using one-tailed t-test (**P < 0.01). b Plasma anti-IgG ELISA reactivity to S(ECD), RBD, and NTD. Normalized area under the curve (AUC) values are plotted. Black dots stand for CoronaVac vaccinees, and red dots stand for convalescents. c Comparison of anti-IgG ELISA AUC values among RBD.V2 (triangle), D614G (circle), and 242–244Δ (diamond) mutants of S1. White stands for CoronaVac vaccinees, and red stands for convalescents. Statistical significance was determined using paired one-tailed t-test (***P < 0.001). d NT50 fold-change from D614G to 501Y.V2 for convalescent and CoronaVac vaccinee plasma by pseudovirus neutralization assay. Statistical significance was determined using one-tailed t-test (n.s., no significance). e NT50 fold-change from WT to 501Y.V2 for convalescent and CoronaVac vaccinee plasma by authentic virus neutralization assay. Statistical significance was determined using one-tailed t-test (n.s., no significance). f Comparison of NT50 values by pseudovirus or authentic virus neutralization assay between WT/D614G and the indicated mutants for CoronaVac vaccinee plasma samples. g Comparison of NT50 values by pseudovirus or authentic virus neutralization assay between WT/D614G and the indicated mutants for CE samples. h Summary of the fold change of NT50 for the indicated mutants from D614G. Color gradient indicates fold change values ranging from +1 (white) to −6.7 (blue). All plotted values and horizontal bars in this figure indicate the geometric mean.
Fig. 4
Fig. 4. Pseudovirus neutralization assays of ZF2001 vaccinee plasma against 501Y.V2 mutants.
Pseudovirus neutralization assays measuring plasma neutralizing ability against D614G (blue), RBD.V2 (red), and 501Y.V2 (yellow) mutants. a R1–R10 stand for serum samples collected from ZF2001 vaccinees who received Day 0, 30, 60 administration. b R11–R20 stand for plasma samples collected from ZF2001 vaccinees who received Day 0, 30, 140 administration. All experiments were reproduced at least twice.
Fig. 5
Fig. 5. Binding and neutralization of 501Y.V2 by ZF2001 vaccinee plasma.
a NT50 values for ZF2001 vaccinee plasma/sera using D614G mutant pseudovirus neutralization assay. Statistical significance was determined using one-tailed t-test (*P < 0.05; n.s., no significance). b Plasma/serum anti-IgG ELISA reactivity to S(ECD), RBD, and NTD. Normalized AUC values are plotted. Black circles stand for R1–R10, and red circles stand for R11–R20. c Comparison of anti-IgG ELISA AUC values among RBD.V2 (triangle), D614G (circle), and 242–244Δ (diamond) mutants of S1. White stands for R1–R10, and red stands for R11–R20. Statistical significance was determined using paired one-tailed t-test (***P < 0.001; n.s., no significance). d NT50 fold-change from D614G to 501Y.V2 for ZF2001 vaccinee plasma/sera by pseudovirus neutralization assay. Statistical significance was determined using one-tailed t-test (*P < 0.05; **P < 0.01; ***P < 0.001). e NT50 fold-change from WT to 501Y.V2 for ZF2001 vaccinee plasma/sera by authentic virus neutralization assay. Statistical significance was determined using one-tailed t-test (*P < 0.05; n.s., no significance). f Comparison of NT50 values by pseudovirus or authentic virus neutralization assay between WT/D614G and the indicated mutants for ZF2001 vaccinee plasma samples. g Summary of the fold change of NT50 for the indicated mutants from D614G. Color gradient indicates fold change values ranging from +1 (white) to −6.1 (blue). All plotted values and horizontal bars in this figure indicate the geometric mean. h Pie charts indicating the distribution of antibody sequences from two ZF2001 vaccinees. The number in the inner circle indicates the number of single cells analyzed. Slice size is proportional to the number of clonal enrichment frequencies. The color of the slice indicates neutralization potency toward pseudovirus mutants. Gray, expressed antibodies but with low or no neutralization (IC50 > 1 μg/mL) and darker gray indicates lower potency; red, high neutralization potency (IC50 < 1 μg/mL) and darker red indicates higher potency; white, not expressed.

Comment in

References

    1. Rambaut, A. et al. Preliminary genomic characterisation of an emergent SARS-CoV-2 lineage in the UK defined by a novel set of spike mutations. Virological (2020).
    1. Tegally H, et al. Detection of a SARS-CoV-2 variant of concern in South Africa. Nature. 2021;592:438–443. doi: 10.1038/s41586-021-03402-9. - DOI - PubMed
    1. Voloch CM, et al. Genomic characterization of a novel SARS-CoV-2 lineage from Rio de Janeiro, Brazil. J. Virol. 2021 doi: 10.1128/jvi.00119-21. - DOI - PMC - PubMed
    1. Wibmer CK, et al. SARS-CoV-2 501Y.V2 escapes neutralization by South African COVID-19 donor plasma. Nat. Med. 2021;27:622–625. doi: 10.1038/s41591-021-01285-x. - DOI - PubMed
    1. Li Q, et al. SARS-CoV-2 501Y.V2 variants lack higher infectivity but do have immune escape. Cell. 2021;184:2362–2371. doi: 10.1016/j.cell.2021.02.042. - DOI - PMC - PubMed

Publication types

MeSH terms