. 2021 Oct;164(2):332-347.
doi: 10.1111/imm.13374. Epub 2021 Jun 13.

Post-transplant cyclophosphamide limits reactive donor T cells and delays the development of graft-versus-host disease in a humanized mouse model

Affiliations

Post-transplant cyclophosphamide limits reactive donor T cells and delays the development of graft-versus-host disease in a humanized mouse model

Sam R Adhikary et al. Immunology. 2021 Oct.

Abstract

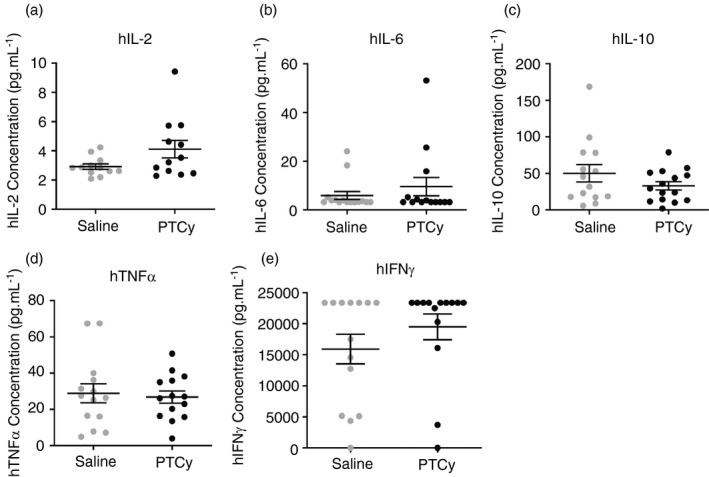
Graft-versus-host disease (GVHD) is a major complication of allogeneic haematopoietic stem cell transplantation (allo-HSCT) that develops when donor T cells in the graft become reactive against the host. Post-transplant cyclophosphamide (PTCy) is increasingly used in mismatched allo-HSCT, but how PTCy impacts donor T cells and reduces GVHD is unclear. This study aimed to determine the effect of PTCy on reactive human donor T cells and GVHD development in a preclinical humanized mouse model. Immunodeficient NOD-scid-IL2Rγnull mice were injected intraperitoneally (i.p.) with 20 × 106 human peripheral blood mononuclear cells stained with carboxyfluorescein succinimidyl ester (CFSE) (day 0). Mice were subsequently injected (i.p.) with PTCy (33 mg kg-1 ) (PTCy-mice) or saline (saline-mice) (days 3 and 4). Mice were assessed for T-cell depletion on day 6 and monitored for GVHD for up to 10 weeks. Flow cytometric analysis of livers at day 6 revealed lower proportions of reactive (CFSElow ) human (h) CD3+ T cells in PTCy-mice compared with saline-mice. Over 10 weeks, PTCy-mice showed reduced weight loss and clinical GVHD, with prolonged survival and reduced histological liver GVHD compared with saline-mice. PTCy-mice also demonstrated increased splenic hCD4+ :hCD8+ T-cell ratios and reduced splenic Tregs (hCD4+ hCD25+ hCD127lo ) compared with saline-mice. This study demonstrates that PTCy reduces GVHD in a preclinical humanized mouse model. This corresponded to depletion of reactive human donor T cells, but fewer human Tregs.

Keywords: graft-versus-host disease; humanized mice; post-transplant cyclophosphamide; reactive T cells; regulatory T cells; xenogeneic.


Conflict of interest statement

Sam R. Adhikary, Peter Cuthbertson, Leigh Nicholson, Katrina M. Bird, Chloe Sligar, Min Hu, Philip J O'Connell, Ronald Sluyter, Stephen I. Alexander and Debbie Watson declare that they have no conflict of interest.

Figures

FIGURE 1
FIGURE 1
PTCy depletes proliferating reactive human donor T cells in NSG mice. (a–h) NSG mice were injected (i.p.) with 20 × 106 CFSE‐stained hPBMCs and subsequently injected (i.p.) with 33 mg kg−1 PTCy or saline on days 3 and 4 post‐hPBMC injection. Mice were assessed for the depletion of reactive human donor T cells on day 6 by flow cytometry of the liver and spleen using (a–f) a consistent gating strategy. (a) Viable cells were gated based on forward scatter area (FSC‐A) and side scatter area (SSC‐A), and (b) live cells were gated based on Zombie NIR staining. (c) hCD45+ leucocytes and (d) hCD3+ T cells were then identified. (e,f) Reactive hCD3+ T cells were identified based on CFSE fluorescence in (e) saline‐mice and (f) PTCy‐mice. Example flow cytometric plots from the spleen are shown as an example. (g,h) Reactive (CFSElow) hCD3+ T cells are expressed as a percentage of total hCD3+ T cells in the (g) liver and (h) spleen. Data are presented as group means ± SEM (n = 11 saline‐mice, n = 9 PTCy‐mice); symbols represent individual mice. (g) *P < 0·05, compared with PTCy‐mice. CFSE, carboxyfluorescein succinimidyl ester, hPBMCs, human peripheral blood mononuclear cells, i.p, intraperitoneal, NSG, NOD‐scid‐IL2Rγnull, PTCy, post‐transplant cyclophosphamide
FIGURE 2
FIGURE 2
PTCy reduces the engraftment of human Tregs in NSG mice at end‐point. (a–q) NSG mice were injected (i.p.) with 20 × 106 hPBMCs and subsequently injected (i.p.) with 33 mg kg−1 PTCy or saline on days 3 and 4 post‐hPBMC injection. Mice were checked for the engraftment of human leucocyte subsets by flow cytometry with a consistent gating strategy (a–g) in (h–k) tail blood at 3 weeks post‐injection and (l–q) spleen at end‐point. (a) Single cells were gated by forward scatter area (FSC‐A) and height (FSC‐H), and (b) viable single lymphocytes were gated within this population using FSC‐A and side scatter (SSC‐A). (c) hCD45+ leucocytes, (d) hCD3+ T cells, (e) hCD3hCD4+ and hCD3hCD8+ T cells and (f) hCD3hCD4hCD25hCD127lo Tregs were then identified. (g) hCD39+ Tregs amongst total Tregs were also identified. (h, l) hCD45+ leucocytes are shown as a percentage of total mCD45+ and hCD45+ leucocytes. (i, m) hCD3+ T cells are shown as a percentage of total hCD45+ leucocytes. (j, n) hCD3hCD4+ and hCD3hCD8+ T cells are expressed as a percentage of hCD3+ T cells with the calculated (k, o) hCD4+:hCD8+ T‐cell ratio. (p) hCD3hCD4hCD25hCD127lo Tregs are shown as a percentage of hCD3hCD4+ T cells (q) hCD39+ Tregs are shown as a percentage of hCD3hCD4hCD25hCD127lo Tregs. (h–q) Data are presented as group means ± SEM; (h–k) n = 13 saline‐mice, n = 16 PTCy‐mice; and (l–q) n = 16 saline‐mice, n = 17 PTCy‐mice. Symbols represent individual mice: (j) *P < 0·05, compared with hCD3hCD4+ T cells in PTCy‐mice; (n) **P < 0·01 compared with hCD3hCD4+ T cells in PTCy‐mice, †† P < 0·01 compared with hCD3hCD8+ T cells; (o) *P < 0·05 compared with saline‐mice; and (p) ***P < 0·001 compared with PTCy‐mice. hPBMCs, human peripheral blood mononuclear cells, i.p, intraperitoneal, NSG, NOD‐scid‐IL2Rγnull, PTCy, post‐transplant cyclophosphamide, Tregs, regulatory T cells
FIGURE 3
FIGURE 3
PTCy lowers the proportion of hCD38hCD8+ EM cells in NSG mice. (a–l) NSG mice were injected (i.p.) with 20 × 106 hPBMCs and subsequently injected (i.p.) with 33 mg kg−1 PTCy or saline on days 3 and 4 post‐hPBMC injection. Mice were checked for the engraftment of splenic human memory T‐cell subsets at end‐point using flow cytometry with a consistent gating strategy (a–h). (a) Single cells were gated by forward scatter area (FSC‐A) and height (FSC‐H), and (b) viable single lymphocytes were gated within this population using FSC‐A and side scatter (SSC‐A). (c) hCD3+ T cells, (d) hCD3hCD4+ and hCD3hCD8+ T cells were then identified. (e, g) hCD45‐RA− hCCR7 EM, hCD45‐RAhCCR7 TEMRA, hCD45‐RAhCCR7+ naïve and hCD45‐RA− hCCR7+ CM memory T‐cell subsets were then identified within (e) hCD3hCD4+ and (g) hCD3hCD8+ T‐cell subsets. (f, h) hCD38+ (f) hCD4+ and (h) hCD8+ EM cells were then identified. (i, j) Memory T‐cell subsets are expressed as a percentage of total (i) hCD3hCD4+ T cells and (j) hCD3hCD8+ T cells. (k, l) CD38+ EM cells are expressed as a percentage of (k) hCD4+ and (l) hCD8+ EM cells. (i–l) n = 13 saline‐mice, n = 17 PTCy‐mice. (i, j) *P < 0·0001 compared with naïve, CM and TEMRA cells in PTCy‐mice; † P < 0·0001 compared with naïve, CM and TEMRA cells in saline‐mice. CM, central memory; EM, effector memory; hPBMCs, human peripheral blood mononuclear cells; i.p, intraperitoneal; NSG, NOD‐scid‐IL2Rγnull; PTCy, post‐transplant cyclophosphamide; TEMRA, terminally differentiated effector memory
FIGURE 4
FIGURE 4
PTCy reduces the development of clinical GVHD in humanized NSG mice. (a–c) NSG mice were injected (i.p.) with 20 × 106 hPBMCs and subsequently injected (i.p.) with 33 mg kg−1 PTCy or saline on days 3 and 4 post‐hPBMC injection. Mice were monitored for the development of clinical GVHD for up to 10 weeks for (a) weight loss, (b) GVHD clinical score and (c) survival. Data represent (a, b) group means ± SEM or (c) percentage survival, (a, b) *P < 0·05 compared with PTCy‐mice. (a–c) n = 16 saline‐mice, n = 17 PTCy‐mice. (c) **P < 0·01 compared with PTCy‐mice. GVHD, graft‐versus‐host disease, hPBMCs, human peripheral blood mononuclear cells, i.p, intraperitoneal, NSG, NOD‐scid‐IL2Rγnull, PTCy, post‐transplant cyclophosphamide
FIGURE 5
FIGURE 5
PTCy reduces histological damage to the liver in humanized NSG mice. (a–c) NSG mice were injected (i.p.) with 20 × 106 hPBMCs and subsequently injected (i.p.) with 33 mg kg−1 PTCy or saline on days 3 and 4 post‐hPBMC injection. (a–f) At end‐point, samples of (a, d) liver, (b, e) small intestines and (c, f) skin tissue from saline‐mice (a–c) and PTCy‐mice (d–f) were sectioned (5 µm) and assessed by haematoxylin and eosin staining. (g–l) Liver tissue from PTCy‐mice and saline‐mice was sectioned (5 µm) and assessed for infiltrating (g, h) hCD4+ (red arrows) and (j, k) hCD8+ T cells (yellow arrows) using immunohistochemistry by staining with anti‐human CD4 and anti‐human CD8, respectively. (i, l) Data represent the counts of (i) hCD4+ and (l) hCD8+ T cells around fields of vessel and interstitial tissue normalized to mm2 of tissue sections. Bars represent 50 μm. Images represent tissues from four mice per group. GVHD, graft‐versus‐host disease, hPBMCs, human peripheral blood mononuclear cells, i.p, intraperitoneal, NSG, NOD‐scid‐IL2Rγnull, PTCy, post‐transplant cyclophosphamide
FIGURE 6
FIGURE 6
PTCy reduces human Treg survival in humanized NSG mice. (a–f) NSG mice were injected (i.p.) with 20 × 106 hPBMCs and subsequently injected (i.p.) with 33 mg kg−1 PTCy or saline on days 3 and 4 post‐hPBMC injection. (a, b) Pearson's correlation of the percentage of hCD3hCD4hCD25hCD127lo Tregs vs. mouse survival for (a) saline‐mice and (b) PTCy‐mice. (c–f) The expression of hFOXP3 was assessed by qPCR in the (c) spleen, (d) liver, (e) small intestines and (f) skin and calculated relative to the expression of hFOXP3 in cDNA from freshly isolated hPBMCs from one human donor. (a–f) Symbols represent individual mice. Data represent (a–b) correlation of proportion of Tregs with mouse survival (n = 16 saline‐mice and n = 17 PTCy‐mice) or (c–f) group mean ± SEM (n = 4–11 per group). hFOXP3, human forkhead box protein 3, GVHD, graft‐versus‐host disease, hPBMCs, human peripheral blood mononuclear cells, i.p, intraperitoneal, NSG, NOD‐scid‐IL2Rγnull, PTCy, post‐transplant cyclophosphamide, Treg, regulatory T cell
FIGURE 7
FIGURE 7
PTCy significantly reduces relative hIL17A expression in the small intestine of humanized NSG mice. (a–h) NSG mice were injected (i.p.) with 20 × 106 hPBMCs and subsequently injected (i.p.) with 33 mg kg−1 PTCy or saline on days 3 and 4 post‐hPBMC injection. The relative expression of (a–d) hIL17A and (e–h) hIFNG in the (a, e) spleen, (b, f) liver, (c, g) small intestine and (d, h) skin at end‐point was examined by qPCR. (a–h) Data represent group mean ± SEM (n = 4–11 mice per group). (c) * P < 0·05 compared with PTCy‐mice. GVHD, graft‐versus‐host disease, hPBMCs, human peripheral blood mononuclear cells, hIFNG, interferon‐gamma, hIL17A, human interleukin‐17A, i.p, intraperitoneal, NSG, NOD‐scid‐IL2Rγnull, PTCy, post‐transplant cyclophosphamide
FIGURE 8
FIGURE 8
PTCy does not influence the concentrations of T‐cell cytokines in the serum of humanized NSG mice. (a–e) NSG mice were injected (i.p.) with 20 × 106 hPBMCs and subsequently injected (i.p.) with 33 mg kg−1 PTCy or saline on days 3 and 4 post‐hPBMC injection. (a–e) Concentrations of serum (a) hIL‐2, (b) hIL‐6, (c) hIL‐10, (d) hTNF‐α and (e) hIFN‐γ. (a–e) Data represent group mean ± SEM (n = 12–18 per group). Symbols represent individual mice. GVHD, graft‐versus‐host disease, h, human being, hPBMCs, human peripheral blood mononuclear cells, IFN‐γ, interferon‐gamma, IL, interleukin i.p, intraperitoneal, NSG, NOD‐scid‐IL2Rγnull, PTCy, post‐transplant cyclophosphamide, TNF‐α, tumour necrosis factor alpha

Similar articles

Cited by

References

    1. Markey KA, MacDonald KP, Hill GR. The biology of graft‐versus‐host disease: experimental systems instructing clinical practice. Blood. 2014;124:354–62. - PMC - PubMed
    1. Schultz KR, Kariminia A, Ng B, Abdossamadi S, Lauener M, Nemecek ER, et al. Immune profile differences between chronic GVHD and late acute GVHD: results of the ABLE/PBMTC 1202 studies. Blood. 2020;135:1287–98. - PMC - PubMed
    1. Zhang Y, Joe G, Hexner E, Zhu J, Emerson SG. Alloreactive memory T cells are responsible for the persistence of graft‐versus‐host disease. J Immunol. 2005;174:3051–8. - PubMed
    1. Gendelman M, Yassai M, Tivol E, Krueger A, Gorski J, Drobyski WR. Selective elimination of alloreactive donor T cells attenuates graft‐versus‐host disease and enhances T‐cell reconstitution. Biol Blood Marrow Transplant. 2003;9:742–52. - PubMed
    1. Fowler DH. Shared biology of GVHD and GVT effects: potential methods of separation. Crit Rev Oncol Hematol. 2006;57:225–44. - PubMed

Publication types

Substances

LinkOut - more resources