. 2021 Jul 14;218(3):iyab079.
doi: 10.1093/genetics/iyab079.

In vivo tissue-specific chromatin profiling in Drosophila melanogaster using GFP-tagged nuclei

Affiliations

In vivo tissue-specific chromatin profiling in Drosophila melanogaster using GFP-tagged nuclei

Juan Jauregui-Lozano et al. Genetics. .

Abstract

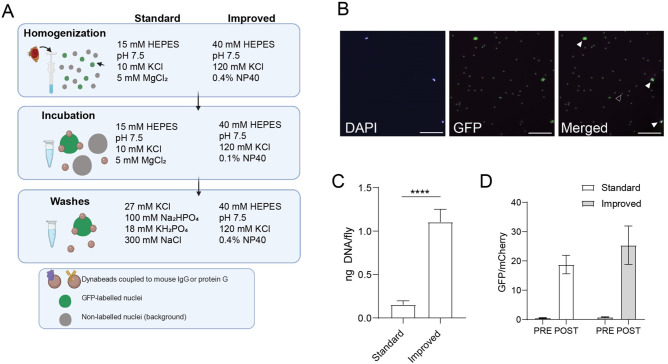
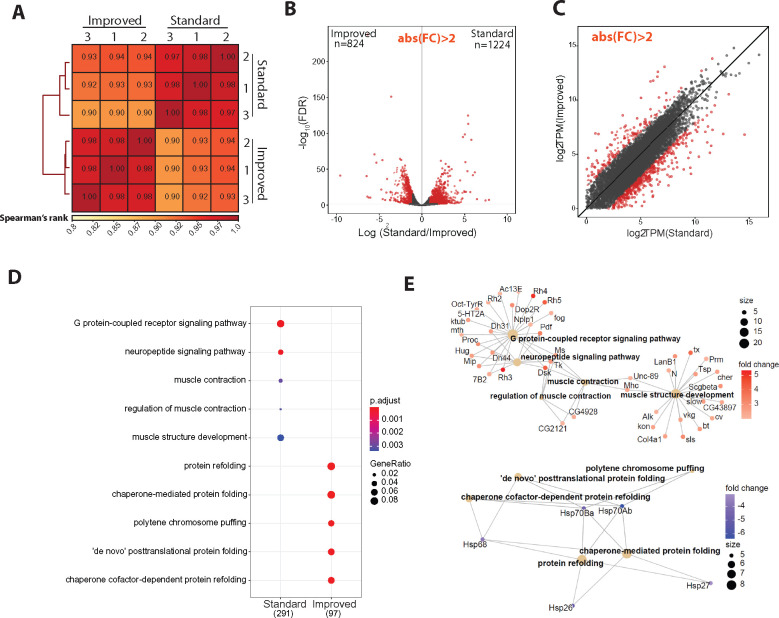
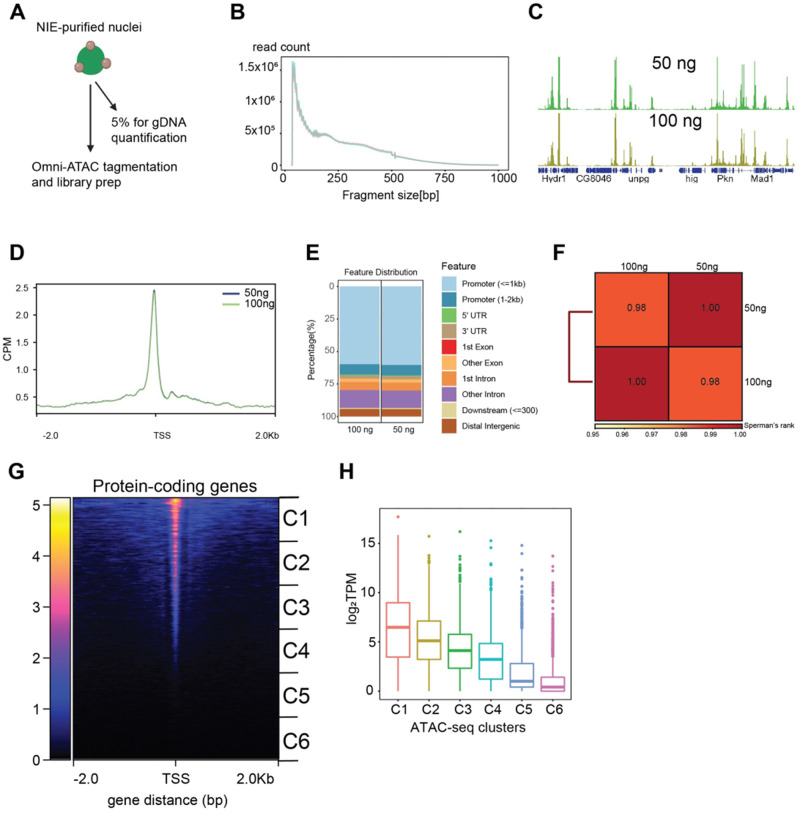
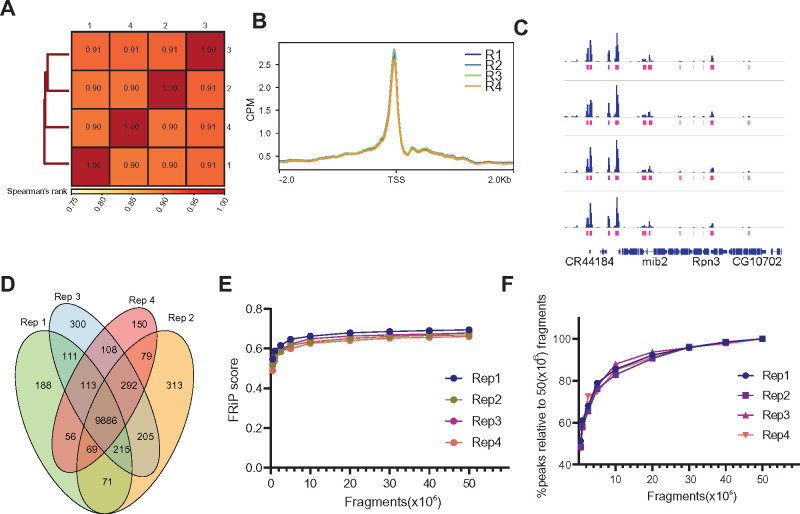
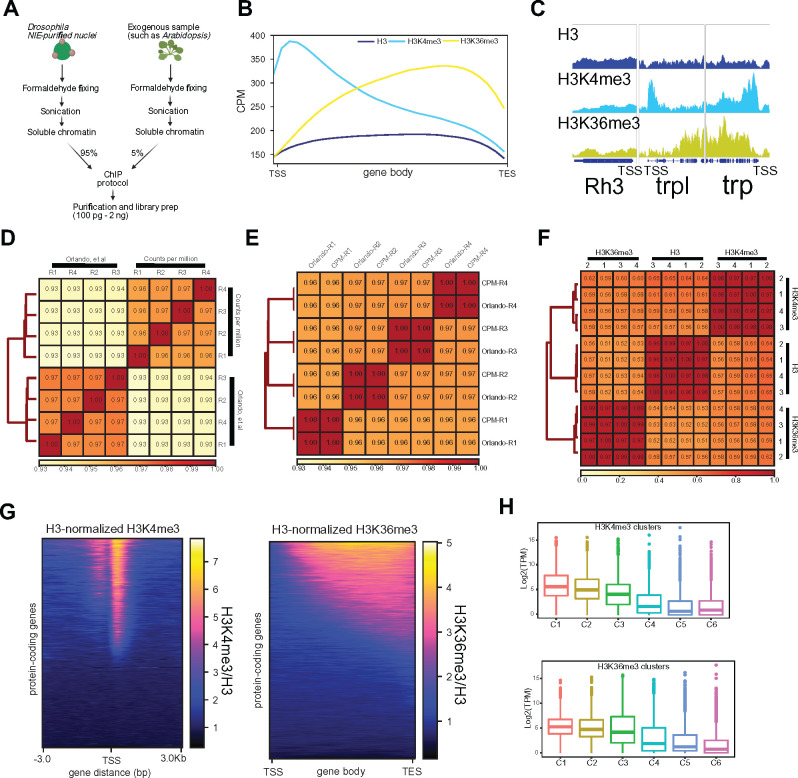
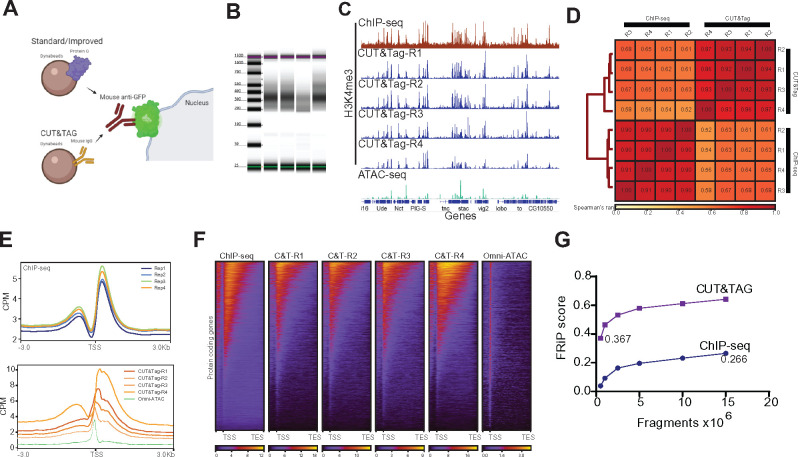
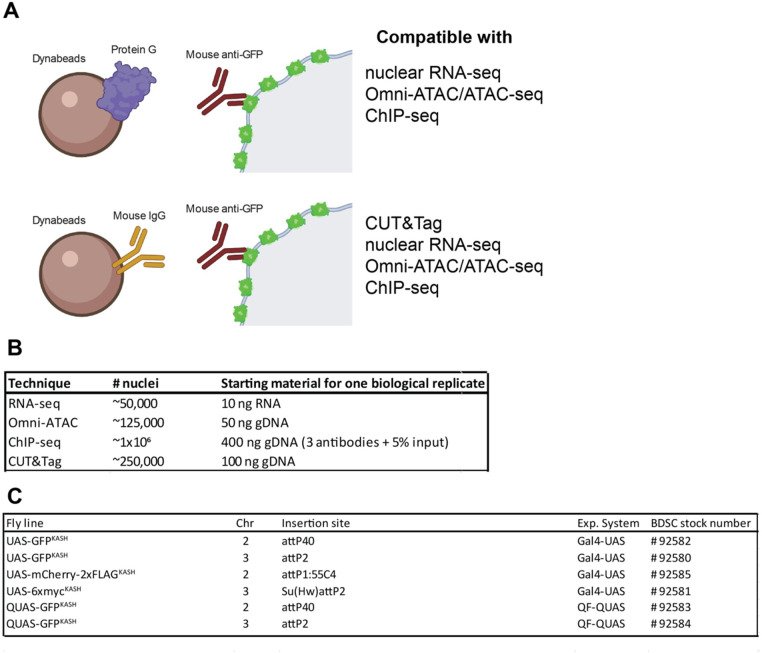
The chromatin landscape defines cellular identity in multicellular organisms with unique patterns of DNA accessibility and histone marks decorating the genome of each cell type. Thus, profiling the chromatin state of different cell types in an intact organism under disease or physiological conditions can provide insight into how chromatin regulates cell homeostasis in vivo. To overcome the many challenges associated with characterizing chromatin state in specific cell types, we developed an improved approach to isolate Drosophila melanogaster nuclei tagged with a GFPKASH protein. The perinuclear space-localized KASH domain anchors GFP to the outer nuclear membrane, and expression of UAS-GFPKASH can be controlled by tissue-specific Gal4 drivers. Using this protocol, we profiled chromatin accessibility using an improved version of Assay for Transposable Accessible Chromatin followed by sequencing (ATAC-seq), called Omni-ATAC. In addition, we examined the distribution of histone marks using Chromatin immunoprecipitation followed by sequencing (ChIP-seq) and Cleavage Under Targets and Tagmentation (CUT&Tag) in adult photoreceptor neurons. We show that the chromatin landscape of photoreceptors reflects the transcriptional state of these cells, demonstrating the quality and reproducibility of our approach for profiling the transcriptome and epigenome of specific cell types in Drosophila.

Keywords: Drosophila; ATAC-seq; cell type; chromatin; photoreceptor; transcription.


Figures

Figure 1
Figure 1
Optimization of tissue-specific NIE from adult Drosophila. (A) Schematic diagram depicting the NIE protocol highlighting major differences in buffer composition between the “standard” and “improved” methods. Heads from flies expressing Rh1 > GFPKASH were homogenized, followed by bead-antibody incubation and washes. (B) Microscopy images of POST sample using the “improved” method. Scale bars: 50 µm. White arrowhead: bead-bound nuclei. Black arrowhead: single bead. (C) Bar plot showing DNA yields when Rh1 > GFPKASH nuclei were enriched using either the “standard” or “improved” NIE method [mean ± standard deviation (SD), n = 4, P-value t-test]. D. Bar plot showing qPCR enrichment for GFP and mCherry in the PRE and POST-NIE samples comparing “methods” (mean ± SD; n = 3, P-value t-test).
Figure 2
Figure 2
The transcriptome of nuclei purified with the “improved” approach is depleted of genes enriched in other cell types relative to the “standard” approach. (A) Spearman correlation heatmap of gene expression profiles from nuclear RNA-seq of nuclei extracted with standard and improved method (n = 4). Scores between 0 and 1 shown in each box correspond to Spearman’s rank score. (B) Volcano plot showing the differentially expressed genes between methods. Genes with significant differential expression (FC > 2, FDR < 0.01) are highlighted in red. (C) Scatter plot showing log2-transformed transcript per million (TPM) values between methods. Differentially expressed genes are highlighted in red, as in panels (B, D). Gene Ontology (GO) term analysis on genes that are overrepresented in either the “standard” or “improved” method. (E) Gene Concept Network plot (Cnetplot) highlighting linkage of individual genes and associated functional categories of genes over-represented in standard (top) and improved (bottom) dataset. Color intensity represents fold change between conditions.
Figure 3
Figure 3
Profiling chromatin accessibility (Omni-ATAC) in NIE-purified nuclei. (A) Diagram depicting Omni-ATAC approach applied to NIE-purified nuclei. After NIE purification, a fraction of nuclei is used for genomic DNA extraction and quantification to determine the input material for Omni-ATAC. Nuclei remain on ice until tagmentation, followed by two washes with tagmentation buffer without Tn5 enzyme. Upon washes, nuclei are tagmented using standard ATAC-seq conditions. (B) Fragment size distribution of Omni-ATAC libraries using 50 ng (light green) or 100 ng (light red) as starting material. (C) Genome browser views of CPM-normalized Omni-ATAC signal with genes shown in blue. (D) Metaplot of CPM-normalized Omni-ATAC signal around the transcription start site (TSS) averaged for all protein-coding genes in the 50 and 100 ng samples. (E) Genomic distribution of accessible peaks of 50- and 100 ng- associated dataset. (F) Spearman correlation heatmap of Omni-ATAC read distribution over binned genome. Scores between 0 and 1 shown in each box correspond to Spearman’s rank score. (G) Heatmap showing CPM-normalized Omni-ATAC signal around TSS of protein-coding genes of 100 ng-associated dataset. Clusters used for transcript boxplot are highlighted. (H) Boxplot showing log2-transformed TPM scores for each cluster defined in 3G.
Figure 4
Figure 4
Omni-ATAC of NIE-purified nuclei does not require high sequencing depth. (A) Spearman correlation heatmap of Omni-ATAC read distribution over binned genome. Scores between 0 and 1 shown in each box correspond to Spearman’s rank score. (B) Metaplot of CPM-normalized Omni-ATAC signal around TSS averaged for all protein-coding genes comparing replicates (n = 4). (C) Genome browser inspection of CPM-normalized Omni-ATAC signal for each replicate, coupled with narrow peaks (pink). Genes are shown in blue. (D) Venn diagram showing peak overlap/similarity between replicates. (E) Fraction of Reads in Peaks (FRiP) scores of Omni-ATAC peaks comparing replicates down-sampled from 0.5 to 50 million mapped fragments. (F) Percentage of peaks called relative to peaks called using the Omni-ATAC replicate #1, with 50 × 106 mapped fragments as absolute percent of peaks.
Figure 5
Figure 5
The histone methylation landscape of adult Drosophila photoreceptors. (A) Diagram depicting Chromatin Immunoprecipitation (ChIP)-seq approach coupled to NIE-purified nuclei. Before adding the ChIP antibody, a fraction of soluble Drosophila chromatin (input) is quantified, to adjust final amount of chromatin per replicate, as well as to define amount of spike-in genome (In this case, 5% of Arabidopsis chromatin). (B) Metaplots of H3 (dark blue), H3K4me3 (light blue) and H3K36me3 (yellow) ChIP-seq signal (CPM) over gene bodies averaged for all protein-coding genes. (C) Genome browser inspection of H3, H3K4me3, and H3K36me3 ChIP-seq signal (CPM) around the inner photoreceptor-specific gene Rh3, which is not expressed in outer photoreceptors, and two highly expressed outer photoreceptor-specific genes trp and trpl. (D) Spearman correlation heatmap of H3K4me3 ChIP-seq data comparing Spike-in and CPM normalization. Spearman’s rank scores are based on read distribution over binned genome. (E) Spearman correlation heatmap of H3K36me3 ChIP-seq data comparing Spike-in and CPM normalization. Spearman’s rank scores are based on read distribution over binned genome. (F) Spearman correlation heatmap of reads that align to binned genome for all replicates of H3, H3K4me3, and H3K36me3 ChIP-seq datasets. (G) Heatmap showing signal for all protein-coding genes of H3-normalized H3K4me3 (left) and H3-normalized H3K36me3 (right). (F) Boxplots showing transcript level expressions of H3K4me3 (top) or H3K36me3 clusters (bottom).
Figure 6
Figure 6
Bead modification in NIE protocol allows application of Cleavage Under Targets and Tagmentation (CUT&Tag). (A) Schematic diagram representing the major difference between bead-antibody conjugation necessary to perform CUT&Tag in NIE-purified nuclei. Protein-G Dynabeads recognize both rabbit and mouse antibodies, while Mouse Pan IgG Dynabeads only recognize mouse antibodies. Nuclei preparation contains excess Dynabeads, therefore the protein G can interfere with CUT&Tag because it can bind the rabbit antibodies used to tag chromatin targets, such as H3K4me3. (B) Tape Station profiles of H3K4me3 CUT&Tag libraries. (C) Genome browser inspection (IGV) of CPM-normalized H3K4me3 ChIP-seq (top), H3K4me3 CUT&Tag replicates (medium) and Omni-ATAC (bottom). All samples were obtained from 10-day-old male flies. Genes are shown in blue. (D) Fraction of Reads in Peaks (FRiP) score comparison between H3K4me3 CUT&Tag replicate 4 and H3K4me3 ChIP-seq replicate 1. Both samples were down sampled from 0.5 to 15 million mapped fragments. (E) Metaplots of CPM-normalized H3K4me3 ChIP-seq (top) and H3K4me3 CUT&Tag (bottom) (n = 4 for each method). (F) Heatmaps showing CPM-normalized H3K4me3 ChIP-seq (left-most) and H3K4me3 CUT&Tag signal for all replicates, with rows representing the same gene across all heatmaps. (G) Spearman correlation heatmap of read distribution over H3K4me3 peaks called using ChIP-seq datasets. Correlation was calculated for H3K4me3 ChIP-seq and CUT&Tag replicates.
Figure 7
Figure 7
Method summary. (A) Schematic diagram representing the two versions of the “improved” NEI-method. The first version (top) uses protein G-coupled magnetic Dynabeads, and can be coupled with RNA-seq, Omni-ATAC, and ChIP-seq. The second version (bottom) uses Mouse IgG-coupled magnetic beads, and can be coupled with Cleavage Under Targets and Tagmentation (CUT&Tag), RNA-seq, Omni-ATAC, and ChIP-seq. (B) Table describing the available fly lines to perform NIE either using the Gal4-UAS or the QF-QUAS system.

Similar articles

Cited by

References

    1. Agrawal P, Chung P, Heberlein U, Kent C.. 2019. Enabling cell-type-specific behavioral epigenetics in Drosophila: a modified high-yield INTACT method reveals the impact of social environment on the epigenetic landscape in dopaminergic neurons. BMC Biol. 17:30. - PMC - PubMed
    1. Allshire RC, Madhani HD.. 2018. Ten principles of heterochromatin formation and function. Nat Rev Mol Cell Biol. 19:229–244. - PMC - PubMed
    1. Ambati S, Yu P, McKinney EC, Kandasamy MK, Hartzell D, et al. 2016. Adipocyte nuclei captured from VAT and SAT. BMC Obes. 3:35. - PMC - PubMed
    1. Amin NM, Greco TM, Kuchenbrod LM, Rigney MM, Chung M-I, et al. 2014. Proteomic profiling of cardiac tissue by isolation of nuclei tagged in specific cell types (INTACT). Development. 141:962–973. - PMC - PubMed
    1. Bai L, Morozov AV.. 2010. Gene regulation by nucleosome positioning. Trends Genet. 26:476–483. - PubMed

Publication types

MeSH terms