. 2021 Jul 23;433(15):167055.
doi: 10.1016/j.jmb.2021.167055. Epub 2021 May 20.

Fine Sampling of Sequence Space for Membrane Protein Structural Biology

Affiliations

Fine Sampling of Sequence Space for Membrane Protein Structural Biology

Michael Loukeris et al. J Mol Biol. .

Abstract

We describe an enhancement of traditional genomics-based approaches to improve the success of structure determination of membrane proteins. Following a broad screen of sequence space to identify initial expression-positive targets, we employ a second step to select orthologs with closely related sequences to these hits. We demonstrate that a greater percentage of these latter targets express well and are stable in detergent, increasing the likelihood of identifying candidates that will ultimately yield structural information.

Keywords: high throughput biology; integral membrane proteins; protein expression; protein purification; structural biology; structural genomics.


Conflict of interest statement

Competing Interests The authors declare no competing interests.

Figures

Figure 1.
Figure 1.. Microgenomic expansion of selected Pseudomonas sp. CysZ targets.
(a) Phylogenetic relationship between CysZ proteins across all Prokaryotes. Distances are plotted relative to E. coli CysZ (UniProt P0A6J3, indicated by black arrow) and was edited to ~400 sequences for simplicity. Protein sequence identities range from 40–100% identical. CysZ proteins from our ‘pan-genomic’ test set are indicated by blue dots and text; the E. coli ‘negative’ test set by red dots and text and the Pseudomonas test set by green dots and text. The phylogenetic tree was created using BlastP (https://blast.ncbi.nlm.nih.gov/), Clustal Omega (https://www.ebi.ac.uk/Tools/msa/clustalo/) and iTOL (https://itol.embl.de/, [3]). Proteins that produced crystals are indicated by asterisks. (b) Close-up of Pseudomonas targets from phylogenetic tree shown in Figure (a) and tested for expression as shown in Figure 2b. Proteins that expressed, were stable in at least two detergents, yielded well-diffracting crystals and whose structures were determined are indicated by circles, squares, diamonds and asterisks, respectively. (c) Open reading frames encoding twenty CysZ proteins closely related to CysZ from Idiomarina loihiensis (UniProt Q5QUJ8), Pseudomonas syringae (UniProt Q887V6) and Pseudomonas aeruginosa (UniProt Q9I595) were cloned into pNYCOMPS N-term and tested for expression. Expressed polyhistidine-tagged proteins were recovered by Ni2+ affinity and separated by SDS-PAGE. Resulting Coomassie blue stained gels of recovered proteins are shown. Neither of the CysZ clones from Idiomarina sp. yielded any detectable protein (lanes 1 and 2). Sixteen of the 18 Psuedomonas targets produced bands of the expected size that were clearly visible by Coomassie staining. Genome and species name of each target is shown. (d) Detergent screen results of CysZ from Pseudomonas denitrificans and Pseudomonas fragi. CysZ proteins were extracted and purified in DM, then sequentially injected on to a size exclusion column first equilibrated in DM, β-OG, LDAO and OM. Crystallization trials were set up in DM, β-OG and LDAO at two different temperatures. (e) Four proteins produced crystals in sparse matrix screens and were selected for repeated trials in optimization screens. Representative crystals produced by CysZ proteins from P. aeruginosa, P. denitrificans, P. fragi and P. syringae are shown.
Figure 2.
Figure 2.. Expression and quantification of CysZ test sets and schematic of microgenomic method.
CysZ targets from each test set were expressed in triplicate in E. coli. Bands on Coomassie stained gels corresponding to CysZ recovered by Ni2+ affinity were quantified by densitometry using ImageJ [2]. Relative expression levels from of each sample were normalized to the expression level P. syringae included on each gel to permit comparison between each of the test sets. (a) Representative Coomassie stained SDS-PAGE gel and relative expression levels of ‘pan-genomic’ test set. (b) Representative Coomassie stained SDS-PAGE gel and relative expression levels of ‘positive’ Pseudomonas test set. (c) Representative Coomassie stained SDS-PAGE gel and relative expression levels of ‘negative’ E. coli test set. * = by one-way ANOVA means are statistically different (p=0.01). *** = by Tukey’s HSD test Pseudomonas mean is statistically different from E. coli mean (p=0.01) and Pan-genomic mean (p=0.02). (d) Schematic representation of microgenomic expansion approach. Targets related to the protein of interest are identified across a broad sequence (blue dots). Expression screening tests are used to identify promising targets (yellow stars). In the second, microgenomic round of screening, targets more closely related (ie. >70–75% identity) to the those that expressed in the initial screen (green dots) are tested for expression. These targets can then be scaled up and tested for stability in detergent(s). Ultimately, one or more of these targets may yield additional structures.
Figure 3.
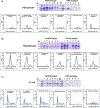
Figure 3.. Scale-up expression tests. The six top expressing targets from each test set shown in Figure 2 were selected for large scale expression and purification.
Proteins were extracted and purified in DM, treated with TEV protease to remove the affinity tag used for purification and the resulting protein loaded on to a Superdex S200 gel filtration column equilibrated in buffer containing DM and protein elution monitored by A280. Coomassie stained SDS-PAGE gels of Ni2+ purified CysZ from each sample. Coomassie stained gels and size exclusion chromatography results of purified targets from scale-up expression of (a) the pan-genomic test set (b) the Pseudomonas ‘positive’ test set and (c) the E. coli ‘negative’ test set are shown. The left side of each panel shows the protein recovered immediately following elution from the Ni2+ resin and the right side of each panel shows the protein recovered following treatment with TEV protease and rebinding to Ni2+ resin. Only one protein from the pan-genomic test set produces a good elution profile and none from the E. coli negative test set. Five of the six CysZ proteins from Pseudomonas produce good size exclusion elution profiles, indicating that they are well folded.

Similar articles

References

    1. Assur Sanghai Z, Liu Q, Clarke OB, Belcher-Dufrisne M, Wiriyasermkul P, Giese MH, et al. Structure-based analysis of CysZ-mediated cellular uptake of sulfate. Elife. 2018;7. - PMC - PubMed
    1. Schneider CA, Rasband WS, Eliceiri KW. NIH Image to ImageJ: 25 years of image analysis. Nat Methods. 2012;9:671–5. - PMC - PubMed
    1. Letunic I, Bork P. Interactive Tree Of Life (iTOL) v4: recent updates and new developments. Nucleic Acids Res. 2019;47:W256–w9. - PMC - PubMed
    1. Tate CG. A crystal clear solution for determining G-protein-coupled receptor structures. Trends Biochem Sci. 2012;37:343–52. - PubMed
    1. Vaidehi N, Grisshammer R, Tate CG. How Can Mutations Thermostabilize G-Protein-Coupled Receptors? Trends Pharmacol Sci. 2016;37:37–46. - PMC - PubMed

Publication types

LinkOut - more resources