. 2021 Jul 6;120(13):2609-2622.
doi: 10.1016/j.bpj.2021.04.036. Epub 2021 May 20.

Local actin dynamics couple speed and persistence in a cellular Potts model of cell migration

Affiliations

Local actin dynamics couple speed and persistence in a cellular Potts model of cell migration

Inge M N Wortel et al. Biophys J. .

Abstract

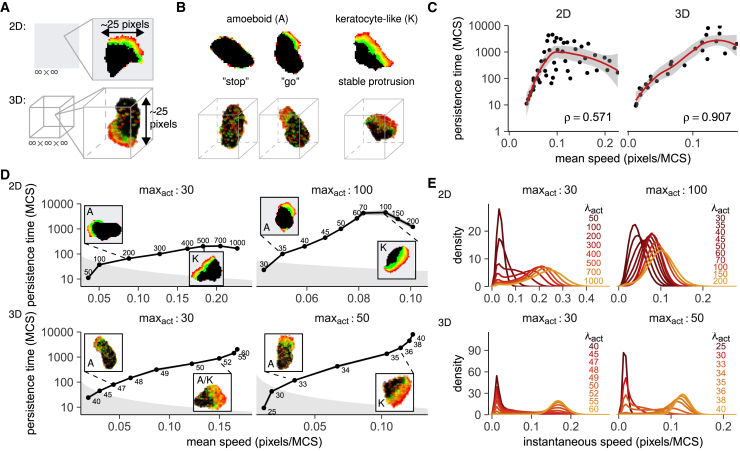
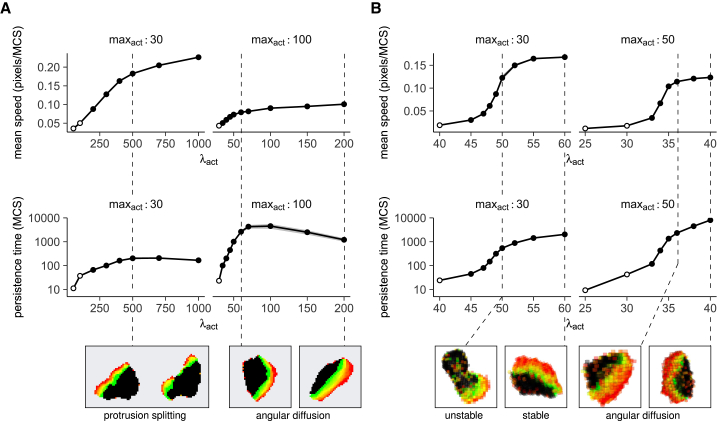
Cell migration is astoundingly diverse. Molecular signatures, cell-cell interactions, and environmental structures each play their part in shaping cell motion, yielding numerous morphologies and migration modes. Nevertheless, in recent years, a simple unifying law was found to describe cell migration across many different cell types and contexts: faster cells turn less frequently. This universal coupling between speed and persistence (UCSP) was explained by retrograde actin flow from front to back, but it remains unclear how this mechanism generalizes to cells with complex shapes and cells migrating in structured environments, which may not have a well-defined front-to-back orientation. Here, we present an in-depth characterization of an existing cellular Potts model, in which cells polarize dynamically from a combination of local actin dynamics (stimulating protrusions) and global membrane tension along the perimeter (inhibiting protrusions). We first show that the UCSP emerges spontaneously in this model through a cross talk of intracellular mechanisms, cell shape, and environmental constraints, resembling the dynamic nature of cell migration in vivo. Importantly, we find that local protrusion dynamics suffice to reproduce the UCSP-even in cases in which no clear global, front-to-back polarity exists. We then harness the spatial nature of the cellular Potts model to show how cell shape dynamics limit both the speed and persistence a cell can reach and how a rigid environment such as the skin can restrict cell motility even further. Our results broaden the range of potential mechanisms underlying the speed-persistence coupling that has emerged as a fundamental property of migrating cells.


Figures

Figure 1
Figure 1
In silico simulation of shape-driven cell migration within complex environments. (A) A CPM represents a tissue as a collection of pixels on a grid, each belonging to a specific cell or the extracellular space. Pixels randomly try to copy their cell identity into pixels of neighbor cells, with a success probability Pcopy depending on how that change would affect the “physical” properties of the involved cells (cell-cell adhesion and deviation from target volume and/or perimeter, dashed lines). The weighted sum of these energetic effects (ΔH) is negative for energetically favorable copy attempts. (B) Example track for a cell with only adhesion, volume, and perimeter constraints, resulting in Brownian, diffusion-like motion. Inset: distribution of instantaneous speeds, which remain very small throughout the track. (C) In the Act-CPM (12), each pixel’s “activity” represents the time elapsed since its most recent successful protrusion. Copy attempts into less active pixels are stimulated (negative ΔHact), and copy attempts into more active pixels are punished (positive ΔHact). (D) Act cells alternate between persistent motion and “stops” in which they change direction (intermittent random walk, “I-RW”). Plot shows example tracks of five Act cells with overlaying starting point (black dot, t = 0). Inset: distribution of instantaneous speeds during the I-RW, “stop-and-go” motion, with peaks at zero (the “stops” in the track) and at high speeds (“go” intervals). (E) Displacement plot of CPM cells. Brownian motion (without the Act extension, gray line) results in a linear curve. Act cell movement appears as Brownian motion on large time scales (linear part of red line) but is persistent on smaller time scales (nonlinear start of red line). To see this figure in color, go online.
Figure 2
Figure 2
The Act-CPM reproduces the UCSP observed in experimental data. (A) Simulation setup for “1D” migration in microchannels. Color gradients indicate active protrusions. Microchannels consist of two parallel walls with 10 pixels between them. (B) “Exponential” speed-persistence coupling arises in the Act-CPM (i.e., there is a range in which speed is proportional to the log persistence time; ρ = Spearman correlation coefficient). Red line and shaded area represent a loess fit ± 95% confidence interval. Both maxact and λact were varied; see Tables S1 and S2 for parameters used and (C) for the relationship at fixed maxact. (C) Speed-persistence coupling is stronger for cells with the same maxact. Plot shows mean ± standard deviation (SD) of persistence time plotted against speed, for two values of maxact; numbers in the plot indicate the corresponding value of λact. Shaded gray areas in the background indicate regions where the persistence time is lower than the time it takes for the cell to move 10% of its length. (D) Phase diagram of migration modes in microchannels for different maxact and λact (left), as based on the displacement distributions (right). Cells were classified as NM if they hardly moved (displacement distribution with a single peak centered at 0). Cells were classified as P-RW if the displacement distribution had two clear peaks (for motion to the left and right, respectively) and as I-RW if it had three peaks (with an extra peak at zero for the “stops”); see Supporting materials and methods for details. This classification yielded fairly consistent “phases” in the parameter space, although it was harder to distinguish peaks for cells that were barely moving (e.g., point 3). Some λact and maxact combinations in the CPM are not viable because the protrusion tear the cell apart; these were classified as “broken.” In the diagram, colors represent migration mode, and the intensity of the color represents agreement of the classification between different independent estimates (see Supporting materials and methods). To see this figure in color, go online.
Figure 3
Figure 3
Speed-persistence coupling in 2D and 3D spans a range of migration modes. (A) 2D and 3D simulations were performed in an empty grid. (B) Migration modes in the Act-CPM; see also (12). Amoeboid cells form small, narrow protrusions that decay quickly, yielding stop-and-go motion. Keratocyte-like cells have broader, more stable protrusions. (C) Exponential speed-persistence coupling for various (λact, maxact). ρ = Spearman’s correlation. See Tables S1 and S2 for exact parameters. Red line and shaded area represent a loess fit ± 95% confidence interval. (D) The UCSP is stronger among cells with the same maxact and spans a transition from amoeboid to keratocyte-like motion. Plots show mean ± SD persistence time versus speed with representative cell shapes as insets (note the competing protrusion in one of the amoeboid cells); in the gray area, persistence times are below the time needed to move 0.1 cell length. See also Fig. S3A. (E) Instantaneous speed distributions of 2D and 3D Act cells. Cells transit from not moving (single peak at ~0 pixels/MCS), via “stop-and-go” motility (bimodal distributions), to near-continuous motion (single peak at high speed). See also Fig. S3B. To see this figure in color, go online.
Figure 4
Figure 4
Cell shape dynamics limit both the speed and persistence of migrating cells. Mean ± SD of speed and persistence time of (A) 2D and (B) 3D Act cells, plotted against λact for different values of maxact. Open circles indicate points where the persistence time is lower than the time it takes the cell to move 10% of its length (corresponding to the points in the gray background in Fig. 3B). Insets show cell shapes at the indicated parameter values. To see this figure in color, go online.
Figure 5
Figure 5
Environmental constraints limit T-cell persistence in a model of the epidermis. (A) An Act T cell (black) moving in between keratinocytes (gray) in the epidermis. Simulations were performed in a 150 × 150 pixel grid with linked borders (for example, a cell moving off the grid toward the red region on the right re-enters the grid at the equivalent red region on the left). (B) Shapes of Act T cells constrained between keratinocytes. At lower λact/maxact values, T cells show typical amoeboid “stop-and-go” behavior. At higher λact and/or maxact values, cells do not obtain a broad, keratocyte-like shape like they normally would (Fig. 3) but stay elongated because of environmental constraints. At junctions between keratinocytes, however, protrusions tend to split. (C) Whereas formation of broad protrusions is mostly prevented in “stiff” skin tissue, Act cells in a more deformable tissue can form broad protrusions by pushing apart surrounding cells. (D) Mean persistence time plotted against speed for different combinations of λact and maxact, tissues with different stiffness. Shaded gray background indicates regions where the persistence time is lower than the time it takes for a cell to move 10% of its length. To see this figure in color, go online.

Similar articles

Cited by

References

    1. Ariotti S., Beltman J.B., Schumacher T.N. Tissue-resident memory CD8+ T cells continuously patrol skin epithelia to quickly recognize local antigen. Proc. Natl. Acad. Sci. USA. 2012;109:19739–19744. - PMC - PubMed
    1. Theilgaard-Mönch K., Knudsen S., Borregaard N. The transcriptional activation program of human neutrophils in skin lesions supports their important role in wound healing. J. Immunol. 2004;172:7684–7693. - PubMed
    1. Pastar I., Stojadinovic O., Tomic-Canic M. Epithelialization in wound healing: a comprehensive review. Adv. Wound Care (New Rochelle) 2014;3:445–464. - PMC - PubMed
    1. Friedl P., Wolf K. Plasticity of cell migration: a multiscale tuning model. J. Cell Biol. 2010;188:11–19. - PMC - PubMed
    1. Maiuri P., Terriac E., Théry M., WCR participants The first world cell race. Curr. Biol. 2012;22:R673–R675. - PMC - PubMed

Publication types

LinkOut - more resources