. 2021 Aug 15:237:118190.
doi: 10.1016/j.neuroimage.2021.118190. Epub 2021 May 19.

Emergence of canonical functional networks from the structural connectome

Affiliations

Emergence of canonical functional networks from the structural connectome

Xihe Xie et al. Neuroimage. .

Abstract

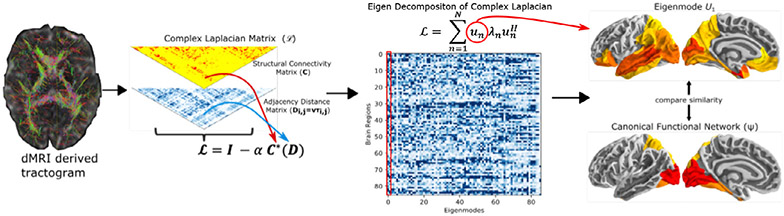
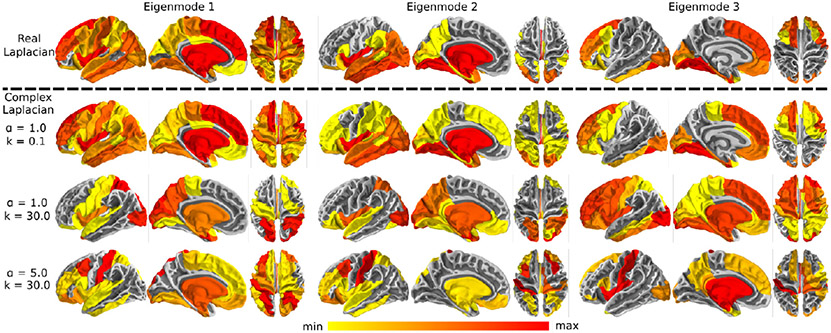
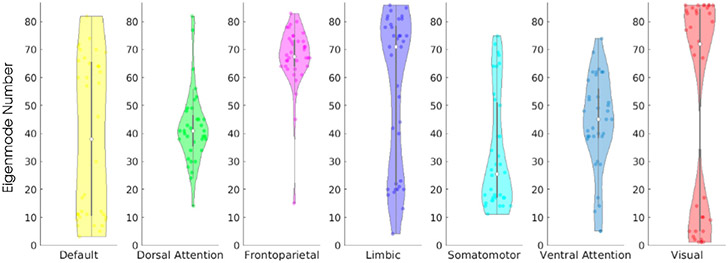
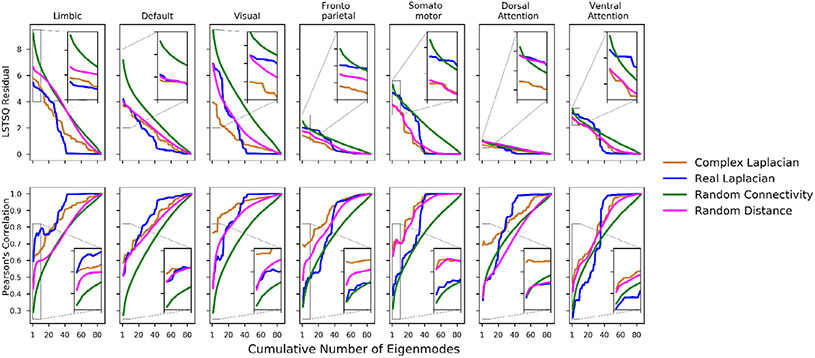
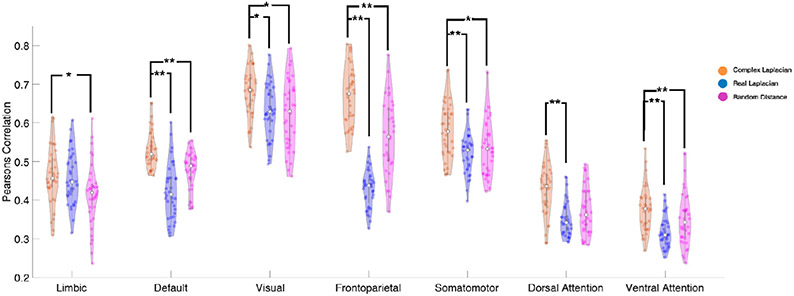
How do functional brain networks emerge from the underlying wiring of the brain? We examine how resting-state functional activation patterns emerge from the underlying connectivity and length of white matter fibers that constitute its "structural connectome". By introducing realistic signal transmission delays along fiber projections, we obtain a complex-valued graph Laplacian matrix that depends on two parameters: coupling strength and oscillation frequency. This complex Laplacian admits a complex-valued eigen-basis in the frequency domain that is highly tunable and capable of reproducing the spatial patterns of canonical functional networks without requiring any detailed neural activity modeling. Specific canonical functional networks can be predicted using linear superposition of small subsets of complex eigenmodes. Using a novel parameter inference procedure we show that the complex Laplacian outperforms the real-valued Laplacian in predicting functional networks. The complex Laplacian eigenmodes therefore constitute a tunable yet parsimonious substrate on which a rich repertoire of realistic functional patterns can emerge. Although brain activity is governed by highly complex nonlinear processes and dense connections, our work suggests that simple extensions of linear models to the complex domain effectively approximate rich macroscopic spatial patterns observable on BOLD fMRI.

Keywords: Complex Laplacian; Functional networks; Graph Laplacian; Structural connectivity.


Figures

Fig. 1.
Fig. 1.
The analysis overview. Structural connectivity matrix (C) and distance adjacency matrix (D) were extracted from diffusion MRI derived tractograms, to construct the complex Laplacian of the brain’s structural network. An eigen decomposition on the network’s complex Laplacian (L) was performed obtain complex structural eigenmodes of the brain (U). The spatial similarities were computed between the structural eigenmodes and canonical functional networks in fMRI. Here, as an example, we show brain rendering of the leading eigenmode from the HCP template structural connectome (right column, top) and the canonical visual functional network (right column, bottom).
Fig. 2.
Fig. 2.
Complex Laplacian eigenmode for different parameter choices. Three representative eigenmodes decomposed from the complex Laplacian with different tuning parameters and three representative eigenmodes decomposed from the real-valued Laplacian without transmission speed and distance delay properties are shown. The top row shows brain renderings of the real Laplacian eigenmodes with coupling strength α = 1. Complex Laplacian eigenmodes with high transmission speed approaches extremely small wave number or delays in the network (α = 1, k = 0 . 1), closely resembles the real Laplacian eigenmodes (second row). Complex Laplacian eigenmodes with higher wave numbers with parameters (α = 1, k = 30) and (α = 5, k = 30) are respectively shown in the third and fourth rows, demonstrating that parameter choice control the spatial distribution of structural eigenmodes.
Fig. 3.
Fig. 3.
Canonical functional networks reproduced by structural eigenmodes. A) Brain renderings of the seven canonical functional networks are shown in the left column. Individual structural eigenmodes with the highest spatial correlation to each functional network, after parameter optimization, are shown in the middle column. After ranking all structural eigenmodes by highest spatial correlation, a linear combination of the top ten best performing eigenmodes are shown in the right column. Parameter values producing the best spatial matches to each canonical functional network are listed in the right column and applies to all eigenmodes. B) Top 10 best fitted structural eigenmodes and canonical functional network comparisons shown in scatter plots with linear regression line and 95% confidence interval.
Fig. 4.
Fig. 4.
Structural eigenmode spatial similarity to canonical functional networks depends on model parameters. Colors display the spatial correlation values (Spearman’s) of all complex Laplacian eigenmodes across all parameter values with each canonical functional network. Shifts in coupling strength (α, top, with wave number held constant at k = 10) does not cause a change in peak spatial correlation, but only in the ordering of the eigenmodes. In contrast, however, shifts in wave number (k, bottom), with coupling strength held constant at α = 1, leads to changes in eigenmode spatial patterns and spatial correlation to canonical functional networks.
Fig. 5.
Fig. 5.
Canonical functional networks have complex Laplacian eigenmode specificity. Each dot on the violin plot corresponds to the best performing eigenmode number. Showing that across all subjects (n = 36) , canonical functional networks occupies specific structural eigenmodes as the dominant structural basis. Default mode network is the exception as the best performing eigenmode spans across all eigenmodes. On the other hand, the rest of the canonical functional networks cluster to specific eigenmode numbers.
Fig. 6.
Fig. 6.
Structural eigenmodes of the HCP template complex Laplacian predict canonical functional networks better than structural eigenmodes of the real Laplacian. For each canonical functional network, we quantified its spatial similarity against linear combinations of structural eigenmodes obtained from various types of Laplacians. The spatial similarities quantified by linear least squares residuals are shown on top, and Pearson’s correlations are shown on the bottom. Overall, accumulation of structural eigenmodes improves the spatial similarity between functional networks and structural eigenmodes. The complex HCP eigenmodes (orange) and real-valued HCP eigenmodes (blue) both outperform eigenmodes decomposed from random connectomes and random distance matrices (green). However, only the complex HCP eigenmodes outperform complex eigenmodes decomposed from the HCP template connectome paired with random distance matrices (magenta).
Fig. 7.
Fig. 7.
Complex Laplacian outperforms real Laplacian in recapitulating canonical functional networks with individual structural connectomes. Violin plot showing that on a group level (each dot correspond to one subject, n = 36), the best performing structural eigenmodes of the complex Laplacian (orange) outperforms the corresponding structural eigenmode from the real Laplacian (blue) and random distance complex Laplacian (magenta). Paired T-test results of complex Laplacian against either real Laplacian or random distance complex Laplacian shows the complex Laplacians eigenmodes achieving significantly higher spatial similarity on the group level (P-values shown as *< 0.5 - **< 0.01).

References

    1. Abdelnour F, Dayan M, Devinsky O, Thesen T, Raj A, 2018. Functional brain connectivity is predictable from anatomic network’s Laplacian eigen-structure. NeuroImage 172, 728–739. - PMC - PubMed
    1. Abdelnour F, Voss HU, Raj A, 2014. Network diffusion accurately models the relationship between structural and functional brain connectivity networks. NeuroImage 90, 335–347. - PMC - PubMed
    1. Alexander-Bloch AF, Vértes PE, Stidd R, Lalonde F, Clasen L, Rapoport J, Giedd J, Bullmore ET, Gogtay N, 2013-January. The anatomical distance of functional connections predicts brain network topology in health and schizophrenia. Cereb. Cortex (New York, NY) 23 (1), 127–138. - PMC - PubMed
    1. Arancibia-Cárcamo IL, Ford MC, Cossell L, Ishida K, Tohyama K, Attwell D, 2017. Node of ranvier length as a potential regulator of myelinated axon conduction speed. eLife 6, e23329. - PMC - PubMed
    1. Atasoy S, Donnelly I, Pearson J, 2016. Human brain networks function in connectome-specific harmonic waves. Nat. Commun 7, 10340. - PMC - PubMed

Publication types

MeSH terms