

Whole brain 3D MR fingerprinting in multiple sclerosis: a pilot study
- PMID: 34022832
- PMCID: PMC8141188
- DOI: 10.1186/s12880-021-00620-5
Whole brain 3D MR fingerprinting in multiple sclerosis: a pilot study
Erratum in
-
Correction to: Whole brain 3D MR fingerprinting in multiple sclerosis: a pilot study.BMC Med Imaging. 2021 Sep 27;21(1):137. doi: 10.1186/s12880-021-00673-6. BMC Med Imaging. 2021. PMID: 34579664 Free PMC article. No abstract available.
Abstract
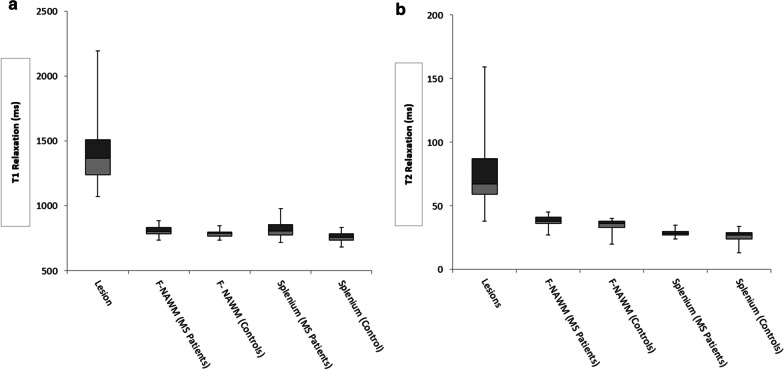
Background: MR fingerprinting (MRF) is a novel imaging method proposed for the diagnosis of Multiple Sclerosis (MS). This study aims to determine if MR Fingerprinting (MRF) relaxometry can differentiate frontal normal appearing white matter (F-NAWM) and splenium in patients diagnosed with MS as compared to controls and to characterize the relaxometry of demyelinating plaques relative to the time of diagnosis.
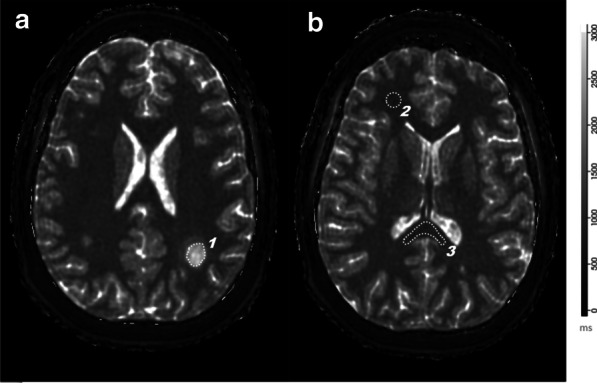
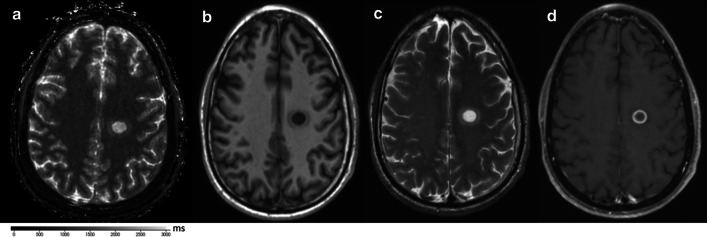
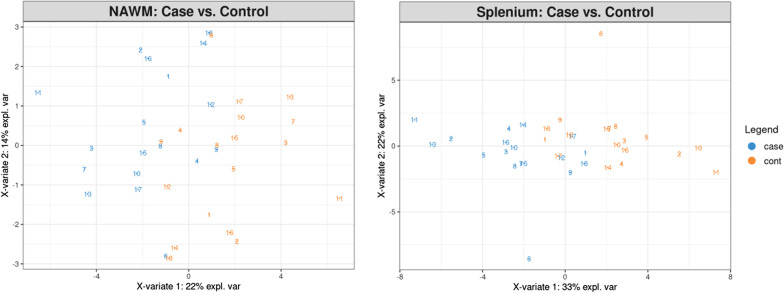
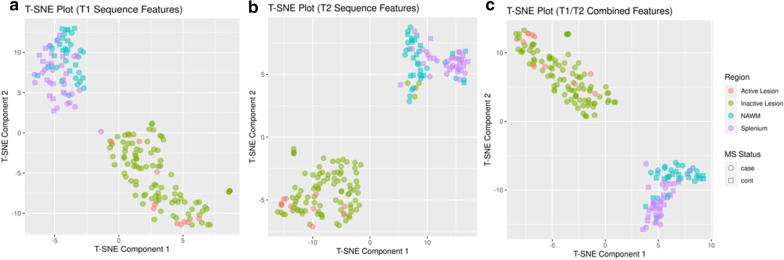
Methods: Three-dimensional (3D) MRF data were acquired on a 3.0T MRI system resulting in isotropic voxels (1 × 1 × 1 mm3) and a total acquisition time of 4 min 38 s. Data were collected on 18 subjects paired with 18 controls. Regions of interest were drawn over MRF-derived T1 relaxometry maps encompassing selected MS lesions, F-NAWM and splenium. T1 and T2 relaxometry features from those segmented areas were used to classify MS lesions from F-NAWM and splenium with T-distributed stochastic neighbor embedding algorithms. Partial least squares discriminant analysis was performed to discriminate NAWM and Splenium in MS compared with controls.
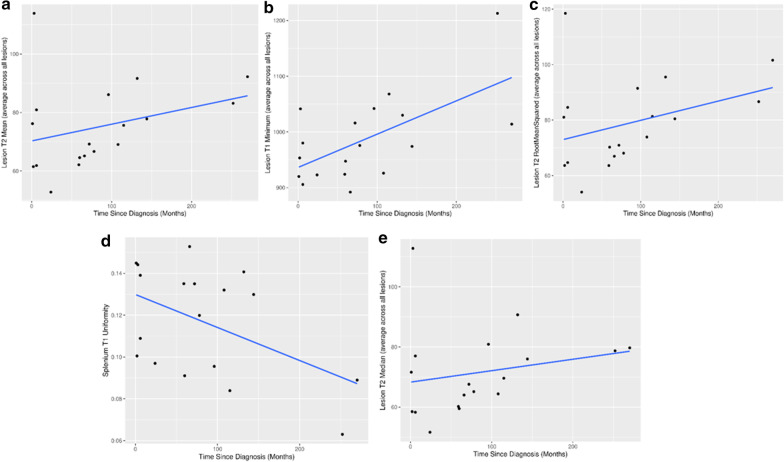
Results: Mean out-of-fold machine learning prediction accuracy for discriminant results between MS patients and controls for F-NAWM was 65 % (p = 0.21) and approached 90 % (p < 0.01) for the splenium. There was significant positive correlation between time since diagnosis and MS lesions mean T2 (p = 0.015), minimum T1 (p = 0.03) and negative correlation with splenium uniformity (p = 0.04). Perfect discrimination (AUC = 1) was achieved between selected features from MS lesions and F-NAWM.
Conclusions: 3D-MRF has the ability to differentiate between MS and controls based on relaxometry properties from the F-NAWM and splenium. Whole brain coverage allows the assessment of quantitative properties within lesions that provide chronological assessment of the time from MS diagnosis.
Keywords: MR Fingerprinting; Multiple Sclerosis; Normal appearing white matter; Relaxometry; Splenium.
Conflict of interest statement
The authors declare that they have no competing interests.
Figures
Similar articles
-
3 T MRI relaxometry detects T2 prolongation in the cerebral normal-appearing white matter in multiple sclerosis.Neuroimage. 2009 Jul 1;46(3):633-41. doi: 10.1016/j.neuroimage.2009.03.001. Epub 2009 Mar 10. Neuroimage. 2009. PMID: 19281850 Free PMC article.
-
Magnetic resonance fingerprinting in multiple sclerosis.Mult Scler Relat Disord. 2023 Nov;79:105024. doi: 10.1016/j.msard.2023.105024. Epub 2023 Sep 27. Mult Scler Relat Disord. 2023. PMID: 37783196
-
Whole-brain 3D MR fingerprinting brain imaging: clinical validation and feasibility to patients with meningioma.MAGMA. 2021 Oct;34(5):697-706. doi: 10.1007/s10334-021-00924-1. Epub 2021 May 4. MAGMA. 2021. PMID: 33945050 Free PMC article.
-
Diffusely abnormal white matter in multiple sclerosis.J Neuroimaging. 2022 Jan;32(1):5-16. doi: 10.1111/jon.12945. Epub 2021 Nov 9. J Neuroimaging. 2022. PMID: 34752664 Review.
-
Quantitative MRI in Multiple Sclerosis: From Theory to Application.AJNR Am J Neuroradiol. 2022 Dec;43(12):1688-1695. doi: 10.3174/ajnr.A7536. Epub 2022 Jun 9. AJNR Am J Neuroradiol. 2022. PMID: 35680161 Review.
Cited by
-
Whole Brain 3D T1 Mapping in Multiple Sclerosis Using Standard Clinical Images Compared to MP2RAGE and MR Fingerprinting.NMR Biomed. 2025 Jun;38(6):e70037. doi: 10.1002/nbm.70037. NMR Biomed. 2025. PMID: 40235062 Free PMC article.
-
Correction to: Whole brain 3D MR fingerprinting in multiple sclerosis: a pilot study.BMC Med Imaging. 2021 Sep 27;21(1):137. doi: 10.1186/s12880-021-00673-6. BMC Med Imaging. 2021. PMID: 34579664 Free PMC article. No abstract available.
-
Machine learning for refining interpretation of magnetic resonance imaging scans in the management of multiple sclerosis: a narrative review.R Soc Open Sci. 2025 Jan 22;12(1):241052. doi: 10.1098/rsos.241052. eCollection 2025 Jan. R Soc Open Sci. 2025. PMID: 39845718 Free PMC article. Review.
-
Synthesis of MR fingerprinting information from magnitude-only MR imaging data using a parallelized, multi network U-Net convolutional neural network.Front Radiol. 2024 Dec 16;4:1498411. doi: 10.3389/fradi.2024.1498411. eCollection 2024. Front Radiol. 2024. PMID: 39742349 Free PMC article.
-
Artificial Intelligence and Multiple Sclerosis: Up-to-Date Review.Cureus. 2023 Sep 17;15(9):e45412. doi: 10.7759/cureus.45412. eCollection 2023 Sep. Cureus. 2023. PMID: 37854769 Free PMC article. Review.
References
Publication types
MeSH terms
LinkOut - more resources
Full Text Sources
Other Literature Sources
Medical
Miscellaneous
