. 2021 May 22;18(1):119.
doi: 10.1186/s12974-021-02174-3.

Annexin A1 protects against cerebral ischemia-reperfusion injury by modulating microglia/macrophage polarization via FPR2/ALX-dependent AMPK-mTOR pathway

Affiliations

Annexin A1 protects against cerebral ischemia-reperfusion injury by modulating microglia/macrophage polarization via FPR2/ALX-dependent AMPK-mTOR pathway

Xin Xu et al. J Neuroinflammation. .

Abstract

Background: Cerebral ischemia-reperfusion (I/R) injury is a major cause of early complications and unfavorable outcomes after endovascular thrombectomy (EVT) therapy in patients with acute ischemic stroke (AIS). Recent studies indicate that modulating microglia/macrophage polarization and subsequent inflammatory response may be a potential adjunct therapy to recanalization. Annexin A1 (ANXA1) exerts potent anti-inflammatory and pro-resolving properties in models of cerebral I/R injury. However, whether ANXA1 modulates post-I/R-induced microglia/macrophage polarization has not yet been fully elucidated.

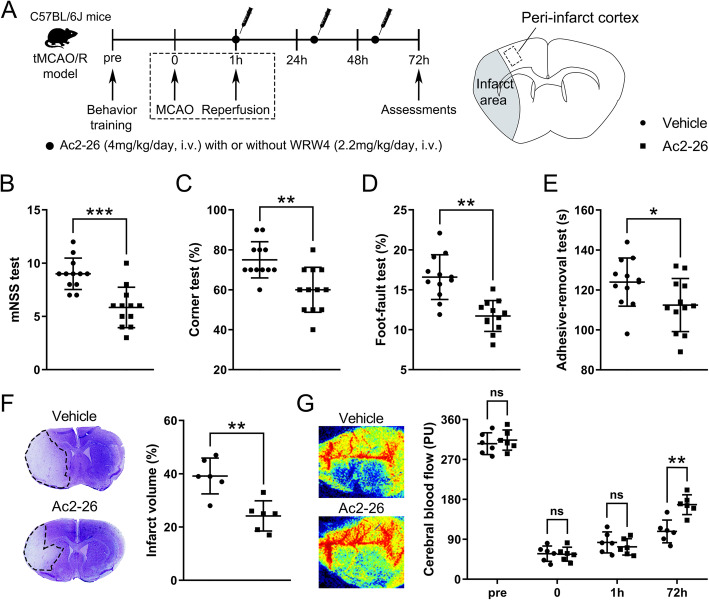
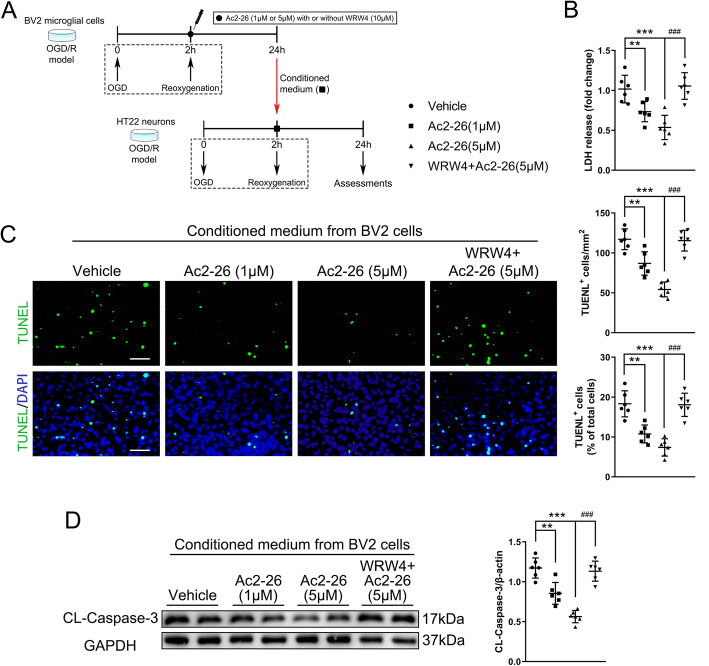
Methods: We retrospectively collected blood samples from AIS patients who underwent successful recanalization by EVT and analyzed ANXA1 levels longitudinally before and after EVT and correlation between ANXA1 levels and 3-month clinical outcomes. We also established a C57BL/6J mouse model of transient middle cerebral artery occlusion/reperfusion (tMCAO/R) and an in vitro model of oxygen-glucose deprivation and reoxygenation (OGD/R) in BV2 microglia and HT22 neurons to explore the role of Ac2-26, a pharmacophore N-terminal peptide of ANXA1, in regulating the I/R-induced microglia/macrophage activation and polarization.

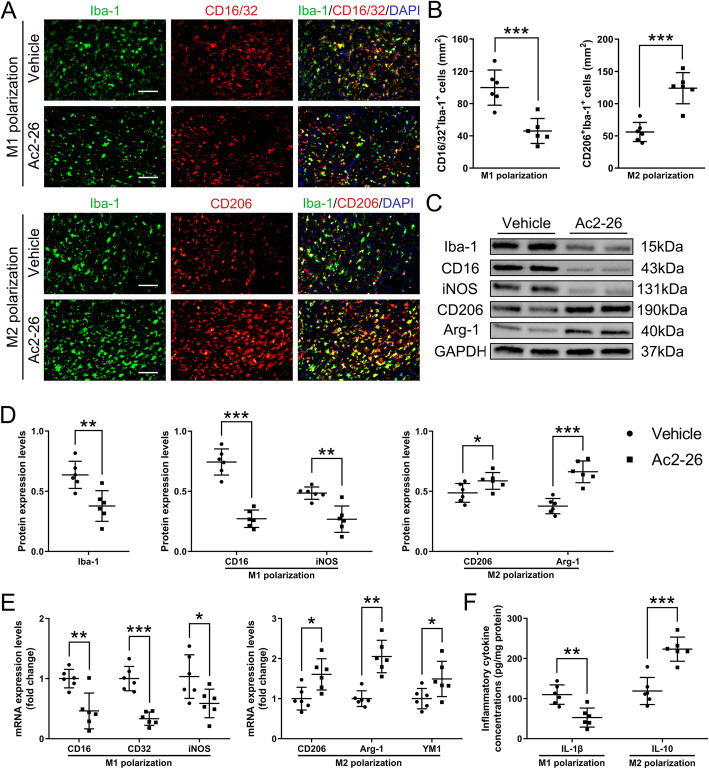
Results: The baseline levels of ANXA1 pre-EVT were significantly lower in 23 AIS patients, as compared with those of healthy controls. They were significantly increased to the levels found in controls 2-3 days post-EVT. The increased post-EVT levels of ANXA1 were positively correlated with 3-month clinical outcomes. In the mouse model, we then found that Ac2-26 administered at the start of reperfusion shifted microglia/macrophage polarization toward anti-inflammatory M2-phenotype in ischemic penumbra, thus alleviating blood-brain barrier leakage and neuronal apoptosis and improving outcomes at 3 days post-tMCAO/R. The protection was abrogated when mice received Ac2-26 together with WRW4, which is a specific antagonist of formyl peptide receptor type 2/lipoxin A4 receptor (FPR2/ALX). Furthermore, the interaction between Ac2-26 and FPR2/ALX receptor activated the 5' adenosine monophosphate-activated protein kinase (AMPK) and inhibited the downstream mammalian target of rapamycin (mTOR). These in vivo findings were validated through in vitro experiments.

Conclusions: Ac2-26 modulates microglial/macrophage polarization and alleviates subsequent cerebral inflammation by regulating the FPR2/ALX-dependent AMPK-mTOR pathway. It may be investigated as an adjunct strategy for clinical prevention and treatment of cerebral I/R injury after recanalization. Plasma ANXA1 may be a potential biomarker for outcomes of AIS patients receiving EVT.

Keywords: Annexin A1; Cerebral ischemia-reperfusion injury; Endovascular thrombectomy; Formyl peptide receptor 2; Microglial/macrophage polarization; Neuroinflammation.


Conflict of interest statement

The authors declare no competing interests.

Figures

Fig. 1
Fig. 1
Expression profiles of endogenous ANXA1 in EVT-treated AIS patients and tMCAO/R-injured mice. a Plasma ANXA1 levels detected by ELISA in normal control subjects (n = 12) and AIS patients treated with EVT (n = 23). Data were presented as median and IQR, and were analyzed by Mann–Whitney U test. **p < 0.01, and ***p < 0.001. b Plasma ANXA1 levels or ∆ANXA1 levels in EVT-treated AIS patients with favorable (n = 11) and unfavorable (n = 12) clinical outcomes. ∆ANXA1: ANXA1 concentration on 2–3 days post-EVT minus pre-EVT ANXA1 concentration. Data were presented as median and IQR and were analyzed by Mann–Whitney U test. ns, not significant. **p < 0.01. c Spearman correlation coefficient analyses of correlation between plasma ANXA1 levels or ∆ANXA1 levels in AIS patients and 3-month mRS scores. d ELISA analyses of the expressions of ANXA1 in peripheral blood of tMCAO/R-injured mice. Data were presented as the mean ± SD (n = 12/group), and were analyzed by one-way ANOVA followed by Bonferroni’s multiple comparison test. *p < 0.05, **p < 0.01, and ***p < 0.001. e Representative western blotting bands and densitometric quantifications of ANXA1 in the peri-infarct cortex after tMCAO/R. Data were presented as the mean ± SD (n = 6/group) and were analyzed by one-way ANOVA followed by Bonferroni’s multiple comparison test. **p < 0.01, and ***p < 0.001
Fig. 2
Fig. 2
Effect of Ac2-26 on neurological function, cerebral infarct volume, and cortical CBF at 3 days post-tMCAO/R. a Schematic diagram of the experimental design. b–e Neurological function was evaluated by mNSS test (b), corner test (c), foot fault test (d), and adhesive removal test (e). f Representative photographs of nissl staining and quantitative analyses of cerebral infarct volume. g Representative photographs of laser speckle contrast imaging and quantitative analyses of cortical CBF. PU, perfusion unit. Data were presented as the mean ± SD (be n = 12/group; fg n = 6/group) and were analyzed by independent samples t test. *p < 0.05, **p < 0.01, and ***p < 0.001
Fig. 3
Fig. 3
Effect of Ac2-26 on microglial/macrophage polarization in the peri-infarct cortex at 3 days post-tMCAO/R. a–b Representative photographs of double immunostaining and quantitative analyses of microglial/macrophage polarization. M1-phenotype: CD16/32+ (red) and Iba-1+ (green); M2-phenotype: CD206+ (red) and Iba-1+ (green). Scale bar = 200 μm. c–d Representative western blotting bands and densitometric quantifications of activated microglial/macrophage marker Iba-1, M1-phenotype markers (CD16 and iNOS), and M2-phenotype markers (CD206 and Arg-1). e qRT-PCR analyses of mRNA expressions of M1-phenotype markers (CD16, CD32, and iNOS) and M2-phenotype markers (CD206, Arg-1, and YM1). f ELISA analyses of the expressions of a pro-inflammatory cytokine IL-1β (M1-phenotype) and an anti-inflammatory cytokine IL-10 (M2-phenotype). Data were presented as the mean ± SD (n = 6/group) and were analyzed by independent samples t test. *p < 0.05, **p < 0.01, and ***p < 0.001
Fig. 4
Fig. 4
Effect of Ac2-26 on BBB disruption and neuronal apoptosis in the peri-infarct cortex at 3 days post-tMCAO/R. a Representative photographs of immunostaining and quantitative analyses of EB dye extravasation. White arrows indicated exudative EB dye. Scale bar = 100 μm. b Representative western blotting bands and densitometric quantifications of albumin extravasation and TJ (occludin and claudin-5) expressions. c–d Representative photographs of immunostaining and quantitative analyses of TJ (occludin and claudin-5; red) expression and neuronal apoptosis (NeuN, red; TUNEL, green). Scale bar = 200 μm. Data were presented as the mean ± SD (n = 6/group), and were analyzed by independent samples t test. *p < 0.05, **p < 0.01, and ***p < 0.001
Fig. 5
Fig. 5
Effect of FPR2/ALX-dependent AMPK-mTOR pathway on Ac2-26-mediated microglial/macrophage polarization in the peri-infarct cortex at 3 days post-tMCAO/R. a Neurological function was evaluated by mNSS test. b Representative nissl staining and quantitative analyses of cerebral infarct volume. c Quantitative analyses of EB dye extravasation. d Representative western blotting bands and densitometric quantifications of activated microglial/macrophage marker Iba-1, M1-phenotype marker CD16, and M2-phenotype marker CD206. e qRT-PCR analyses of mRNA expressions of M1-phenotype markers (CD16, CD32, and iNOS) and M2-phenotype markers (CD206, Arg-1, and YM1). f ELISA analyses of the expressions of a pro-inflammatory cytokine IL-1β (M1-phenotype) and an anti-inflammatory cytokine IL-10 (M2-phenotype). g Representative western blotting bands and densitometric quantifications of phosphorylation of AMPKα and mTOR. Data were presented as the mean ± SD (A n = 12/group; bg n = 6/group) and were analyzed by one-way ANOVA followed by Bonferroni’s multiple comparison test. *p < 0.05, **p < 0.01, and ***p < 0.001, #p < 0.05, ##p < 0.01, and ###p < 0.001
Fig. 6
Fig. 6
Effect of FPR2/ALX-dependent AMPK-mTOR pathway on Ac2-26-mediated in vitro BV2 microglial polarization. a Schematic diagram of the experimental design. b Representative photographs of double immunostaining and quantitative analyses of BV2 microglial polarization. M1-phenotype: iNOS+ (green) and Iba-1+ (red); M2-phenotype: Arg-1+ (green) and Iba-1+ (red). Scale bar = 100 μm. c qRT-PCR analyses of mRNA expressions of M1-phenotype markers (CD32 and iNOS) and M2-phenotype markers (CD206 and Arg-1). d ELISA analyses of the expressions of a pro-inflammatory cytokine IL-1β (M1-phenotype) and an anti-inflammatory cytokine IL-10 (M2-phenotype). e Representative western blotting bands and densitometric quantifications of phosphorylation of AMPKα and mTOR. Data were presented as the mean ± SD (n = 6/group) and were analyzed by one-way ANOVA followed by Bonferroni’s multiple comparison test. *p < 0.05, **p < 0.01, and ***p < 0.001, #p < 0.05, ##p < 0.01, and ###p < 0.001
Fig. 7
Fig. 7
Effect of Ac2-26-mediated microglia polarization on post-OGD/R HT22 neuronal apoptosis. a Schematic diagram of the experimental design. b Quantitative analyses of treated HT22 neuronal death using LDH release assay. c Representative photographs of immunostaining and quantitative analyses of HT22 neuronal apoptosis (TUNEL, green). Scale bar = 100 μm. d Representative western blotting bands and densitometric quantifications of cleaved-caspase-3. CL: cleaved. Data were presented as the mean ± SD (n = 6/group) and were analyzed by one-way ANOVA followed by Bonferroni's multiple comparison test. **p < 0.01, and ***p < 0.001, ###p < 0.001

Similar articles

Cited by

References

    1. Powers WJ, Rabinstein AA, Ackerson T, Adeoye OM, Bambakidis NC, Becker K, Biller J, Brown M, Demaerschalk BM, Hoh B, Jauch EC, Kidwell CS, Leslie-Mazwi TM, Ovbiagele B, Scott PA, Sheth KN, Southerland AM, Summers DV, Tirschwell DL, on behalf of the American Heart Association Stroke Council Guidelines for the early management of patients with acute ischemic stroke: 2019 update to the 2018 guidelines for the early management of acute ischemic stroke: a guideline for healthcare professionals from the American Heart Association/American Stroke Association. Stroke. 2019;50(12):e344–e418. doi: 10.1161/STR.0000000000000211. - DOI - PubMed
    1. Phipps MS, Cronin CA. Management of acute ischemic stroke. BMJ. 2020;368:l6983. doi: 10.1136/bmj.l6983. - DOI - PubMed
    1. Shafie M, Yu W. Recanalization therapy for acute ischemic stroke with large vessel occlusion: where we are and what comes next? Transl Stroke Res. 2021;12(3):369–381. doi: 10.1007/s12975-020-00879-w. - DOI - PMC - PubMed
    1. Nie X, Pu Y, Zhang Z, Liu X, Duan W, Liu L. Futile recanalization after endovascular therapy in acute ischemic stroke. Biomed Res Int. 2018;2018:5879548–5879545. doi: 10.1155/2018/5879548. - DOI - PMC - PubMed
    1. Xu H, Jia B, Huo X, Mo D, Ma N, Gao F, Yang M, Miao Z. Predictors of futile recanalization after endovascular treatment in patients with acute ischemic stroke in a multicenter registry study. J Stroke Cerebrovasc Dis. 2020;29(10):105067. doi: 10.1016/j.jstrokecerebrovasdis.2020.105067. - DOI - PubMed

MeSH terms